Dema Ema Crossover | viResearchDema Ema Crossover | viResearch
Conceptual Foundation and Innovation
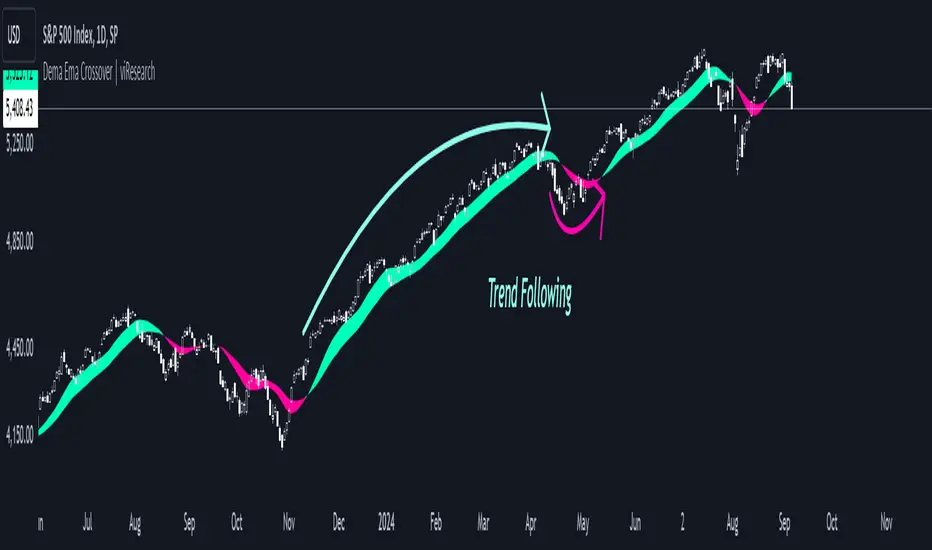
The "Dema Ema Crossover" indicator combines the strengths of the Double Exponential Moving Average (DEMA) with an Exponential Moving Average (EMA) crossover strategy. The DEMA is well-known for its ability to reduce lag compared to standard moving averages, offering smoother trend-following signals. In this script, the DEMA is used as the foundation, with two EMAs applied on top of it to further refine the trend detection and crossover points. This combination provides traders with a robust tool for identifying trend shifts and potential entry or exit points.
By leveraging the faster responsiveness of the DEMA and using EMA crossovers, the "Dema Ema Crossover" indicator helps traders detect and act on trend reversals more efficiently, making it a powerful solution for capturing both short- and long-term market movements.
Technical Composition and Calculation
The "Dema Ema Crossover" script consists of three main components: the Double Exponential Moving Average (DEMA), the fast EMA, and the slow EMA. The DEMA is calculated based on the selected length and source price, providing a smooth representation of market trends. Two EMAs are then applied to the DEMA, with one being faster (shorter period) and the other slower (longer period). The crossover between these two EMAs generates the signals for trend changes.
For the DEMA, the calculation uses the ta.dema function, which reduces lag while maintaining smoothness in the moving average. The fast and slow EMAs are calculated using the ta.ema function, with the fast EMA responding more quickly to price changes, while the slow EMA captures broader trends. The crossover between these two EMAs is used to generate buy and sell signals based on the direction of the crossover.
Features and User Inputs
The "Dema Ema Crossover" script offers several customizable inputs that allow traders to tailor the indicator to their trading strategies. The DEMA Length controls how smooth the DEMA is, with a longer length creating a slower-moving average and a shorter length providing a more responsive one. The Fast EMA Length and Slow EMA Length are also customizable, allowing traders to adjust the sensitivity of the crossover signals based on their market outlook and preferred trading timeframe.
Practical Applications
The "Dema Ema Crossover" indicator is designed for traders looking for a reliable crossover strategy that combines the responsiveness of the DEMA with the precision of EMA crossovers. This tool is particularly effective for:
Identifying Trend Reversals: The crossover between the fast and slow EMAs applied to the DEMA provides early signals of potential trend reversals, allowing traders to position themselves in the market more effectively. Confirming Trend Direction: The combined effect of the DEMA and EMA crossovers helps confirm the strength of a trend, improving decision-making around trade entries and exits. Adapting to Different Market Conditions: The customizable parameters allow traders to adjust the sensitivity of the crossover signals, making the indicator suitable for both fast-moving markets and slower, trending environments.
Advantages and Strategic Value
The "Dema Ema Crossover" script offers a significant advantage by combining the smoothness of the DEMA with the accuracy of EMA crossovers. The DEMA’s ability to reduce lag while maintaining responsiveness makes it ideal for trend-following strategies, while the crossover between the fast and slow EMAs provides precise entry and exit points. This combination reduces false signals and helps traders adapt to changing market conditions, resulting in a more reliable and efficient trend-following system.
Alerts and Visual Cues
The script includes alert conditions to notify traders of key crossover events. The "Dema Ema Crossover Long" alert is triggered when the fast EMA crosses above the slow EMA, signaling a potential upward trend. Conversely, the "Dema Ema Crossover Short" alert signals a possible downward trend when the fast EMA crosses below the slow EMA. Visual cues such as colored fills between the two EMAs highlight these crossover points on the chart, helping traders quickly identify trend shifts.
Summary and Usage Tips
The "Dema Ema Crossover | viResearch" indicator provides traders with a powerful combination of the DEMA and EMA crossovers, offering a smooth yet responsive tool for detecting trend reversals and confirming trend direction. By incorporating this script into your trading strategy, you can improve your ability to capture trend changes with greater accuracy, reducing the impact of market noise. Whether you are focused on short-term market moves or long-term trends, the "Dema Ema Crossover" indicator offers a flexible and reliable solution for traders at all levels.
Note: Backtests are based on past results and are not indicative of future performance.
在腳本中搜尋"Exponential"
Dema Supertrend | viResearchDema Supertrend | viResearch
Conceptual Foundation and Innovation
The "Dema Supertrend" indicator by viResearch combines the benefits of the Double Exponential Moving Average (DEMA) with the popular Supertrend method to provide an advanced tool for trend detection and volatility management. By integrating DEMA into the Supertrend calculation, the indicator reduces lag while enhancing responsiveness to market changes. This results in more accurate trend identification and a refined method for capturing directional movements.
Technical Composition and Calculation
The "Dema Supertrend" builds on the core principles of the Supertrend indicator by incorporating DEMA for smoother and more responsive trend detection. The key innovation lies in replacing the raw price data with the DEMA-smoothed values, allowing traders to identify trends with reduced noise and enhanced precision.
DEMA and ATR-Based Supertrend Calculation:
DEMA Calculation (demalen): The Double Exponential Moving Average is applied to the price data (hlc3 by default) over a user-defined length, providing a smoothed representation of the market trend. DEMA minimizes lag compared to simple or exponential moving averages, allowing for more timely trend identification.
Supertrend Bands (u, l): The Supertrend upper and lower bands are calculated by adding or subtracting a multiple of the Average True Range (ATR) from the DEMA value. These bands dynamically adjust to market volatility, acting as support and resistance levels to guide trading decisions.
Trend Logic (L, S): The script determines whether the price is above or below the bands to signal an uptrend (L) or downtrend (S). Crosses above or below these bands trigger visual alerts and trend changes, with alerts built in for potential long or short positions.
Trend Continuation and Reversal:
The indicator ensures that once a trend is identified, it persists until clear reversal criteria are met. This is achieved through a comparison of the current and previous values of the Supertrend bands, reducing the occurrence of false signals in volatile markets.
Features and User Inputs
The "Dema Supertrend" script offers a range of customizable options, allowing traders to tailor the indicator to different market conditions and trading strategies:
Supertrend Length: The length of the Supertrend period can be adjusted, allowing traders to control the sensitivity of the trend detection.
Multiplier: The ATR multiplier adjusts the distance between the DEMA and the Supertrend bands. A higher multiplier reduces the frequency of trend changes, while a lower multiplier increases sensitivity to price movements.
DEMA Length: The length of the DEMA calculation can be customized to smooth price data over different timeframes, helping traders capture long-term trends or short-term movements more effectively.
Practical Applications
The "Dema Supertrend" is an ideal tool for traders who seek to follow trends while minimizing the impact of market noise. Its combination of DEMA and Supertrend provides a clear, dynamic view of the market's direction, making it especially effective in volatile environments.
Key Uses:
- Trend Following: The Dema Supertrend helps traders align their positions with the prevailing market trend by providing clear signals for uptrends and downtrends based on DEMA-smoothened price action.
- Volatility Management: The integration of ATR ensures that the Supertrend bands adapt to changes in market volatility, allowing traders to avoid entering trades during choppy, unpredictable price movements.
- Signal Confirmation: The script includes visual and alert-based signals for trend continuation and reversal, enabling traders to confirm entries and exits with greater accuracy.
Advantages and Strategic Value
The "Dema Supertrend" offers several strategic advantages:
- Reduced Lag: By integrating DEMA into the Supertrend calculation, the indicator responds more quickly to price changes, reducing the lag inherent in traditional moving averages.
- Noise Reduction: The use of DEMA filters out short-term fluctuations, providing a clearer signal for traders looking to capture significant market trends.
- Dynamic Adjustments: The combination of ATR and DEMA allows the indicator to adapt to both trending and ranging markets, making it suitable for a variety of trading strategies.
Summary and Usage Tips
The "Dema Supertrend" is a powerful tool for trend-following traders, offering a precise and adaptive method for identifying and confirming market direction. Traders can experiment with different settings for the Supertrend and DEMA lengths, as well as the ATR multiplier, to optimize the indicator for various trading environments. For best results, use the "Dema Supertrend" in conjunction with other technical analysis tools to confirm trends and manage risk. Whether you're seeking to capture long-term market moves or react to short-term volatility, the "Dema Supertrend" provides a reliable and flexible solution for your trading strategy.

DSL Oscillator [BigBeluga]DSL Oscillator BigBeluga
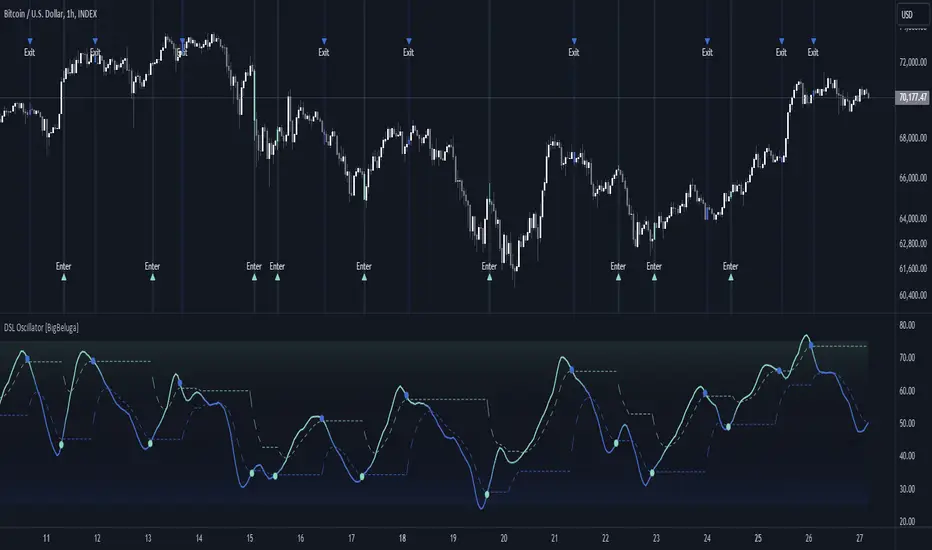
The DSL (Discontinued Signal Lines) Oscillator is an advanced technical analysis tool that combines elements of the Relative Strength Index (RSI), Discontinued Signal Lines, and Zero-Lag Exponential Moving Average (ZLEMA). This versatile indicator is designed to help traders identify trend direction, momentum, and potential reversal points in the market.
What are Discontinued Signal Lines (DSL)?
Discontinued Signal Lines are an extension of the traditional signal line concept used in many indicators. While a standard signal line compares an indicator's value to its smoothed (slightly lagging) state, DSL takes this idea further by using multiple adaptive lines that respond to the indicator's current value. This approach provides a more nuanced view of the indicator's state and momentum, making it easier to determine trends and desired states of the indicator.
🔵 KEY FEATURES
● Discontinued Signal Lines (DSL)
Uses multiple adaptive lines that respond to the indicator's value
Provides a more nuanced view of the indicator's state and momentum
Helps determine trends and desired states of the indicator more effectively
Available in "Fast" and "Slow" modes for different responsiveness
Acts as dynamic support and resistance levels for the oscillator
● DSL Oscillator
Based on a combination of RSI and Discontinued Signal Lines
// Discontinued Signal Lines
dsl_lines(src, length)=>
UP = 0.
DN = 0.
UP := (src > ta.sma(src, length)) ? nz(UP ) + dsl_mode / length * (src - nz(UP )) : nz(UP )
DN := (src < ta.sma(src, length)) ? nz(DN ) + dsl_mode / length * (src - nz(DN )) : nz(DN )
Smoothed using Zero-Lag Exponential Moving Average for reduced lag
// Zero-Lag Exponential Moving Average function
zlema(src, length) =>
lag = math.floor((length - 1) / 2)
ema_data = 2 * src - src
ema2 = ta.ema(ema_data, length)
ema2
Oscillates between 0 and 100
Color-coded for easy interpretation of market conditions
● Signal Generation
Generates buy signals when the oscillator crosses above the lower DSL line below 50
Generates sell signals when the oscillator crosses below the upper DSL line above 50
Signals are visualized on both the oscillator and the main chart
● Visual Cues
Background color changes on signal occurrences for easy identification
Candles on the main chart are colored based on the latest signal
Oscillator line color changes based on its position relative to the DSL lines
🔵 HOW TO USE
● Trend Identification
Use the color and position of the DSL Oscillator relative to its Discontinued Signal Lines to determine the overall market trend
● Entry Signals
Look for buy signals (green circles) when the oscillator crosses above the lower DSL line
Look for sell signals (blue circles) when the oscillator crosses below the upper DSL line
Confirm signals with the triangles on the main chart and background color changes
● Exit Signals
Consider exiting long positions on exit signals and short positions on Entery signals
Watch for the oscillator crossing back between the DSL lines as a potential early exit signal
● Momentum Analysis
Strong momentum is indicated when the oscillator moves rapidly towards extremes and away from the DSL lines
Weakening momentum can be spotted when the oscillator struggles to reach new highs or lows, or starts converging with the DSL lines
The space between the DSL lines can indicate potential momentum strength - wider gaps suggest stronger trends
● Confirmation
Use the DSL lines as dynamic support/resistance levels for the oscillator
Look for convergence between oscillator signals and price action on the main chart
Combine signals with other technical indicators or chart patterns for stronger confirmation
🔵 CUSTOMIZATION
The DSL Oscillator offers several customization options:
Adjust the main calculation length for the DSL lines
Choose between "Fast" and "Slow" modes for the DSL lines calculation
By fine-tuning these settings, traders can adapt the DSL Oscillator to various market conditions and personal trading strategies.
The DSL Oscillator provides a multi-faceted approach to market analysis, combining trend identification, momentum assessment, and signal generation in one comprehensive tool. Its dynamic nature and visual cues make it suitable for both novice and experienced traders across various timeframes and markets. The integration of RSI, Discontinued Signal Lines, and ZLEMA offers traders a sophisticated yet intuitive tool to inform their trading decisions.
The use of Discontinued Signal Lines sets this oscillator apart from traditional indicators by providing a more adaptive and nuanced view of market conditions. This can potentially lead to more accurate trend identification and signal generation, especially in markets with varying volatility.
Traders can use the DSL Oscillator to identify trends, spot potential reversals, and gauge market momentum. The combination of the oscillator, dynamic signal lines, and clear visual signals provides a holistic view of market conditions. As with all technical indicators, it's recommended to use the DSL Oscillator in conjunction with other forms of analysis and within the context of a well-defined trading strategy.
Moving Average Z-Score Suite [BackQuant]Moving Average Z-Score Suite
1. What is this indicator
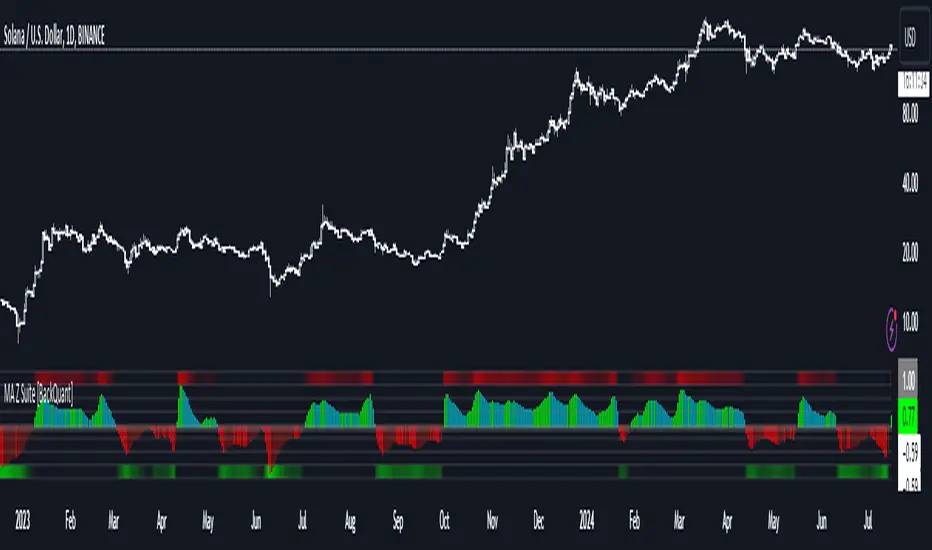
The Moving Average Z-Score Suite is a versatile indicator designed to help traders identify and capitalize on market trends by utilizing a variety of moving averages. This indicator transforms selected moving averages into a Z-Score oscillator, providing clear signals for potential buy and sell opportunities. The indicator includes options to choose from eleven different moving average types, each offering unique benefits and characteristics. It also provides additional features such as standard deviation levels, extreme levels, and divergence detection, enhancing its utility in various market conditions.
2. What is a Z-Score
A Z-Score is a statistical measurement that describes a value's relationship to the mean of a group of values. It is measured in terms of standard deviations from the mean. For instance, a Z-Score of 1.0 means the value is one standard deviation above the mean, while a Z-Score of -1.0 indicates it is one standard deviation below the mean. In the context of financial markets, Z-Scores can be used to identify overbought or oversold conditions by determining how far a particular value (such as a moving average) deviates from its historical mean.
3. What moving averages can be used
The Moving Average Z-Score Suite allows users to select from the following eleven moving averages:
Simple Moving Average (SMA)
Hull Moving Average (HMA)
Exponential Moving Average (EMA)
Weighted Moving Average (WMA)
Double Exponential Moving Average (DEMA)
Running Moving Average (RMA)
Linear Regression Curve (LINREG) (This script can be found standalone )
Triple Exponential Moving Average (TEMA)
Arnaud Legoux Moving Average (ALMA)
Kalman Hull Moving Average (KHMA)
T3 Moving Average
Each of these moving averages has distinct properties and reacts differently to price changes, allowing traders to select the one that best fits their trading style and market conditions.
4. Why Turning a Moving Average into a Z-Score is Innovative and Its Benefits
Transforming a moving average into a Z-Score is an innovative approach because it normalizes the moving average values, making them more comparable across different periods and instruments. This normalization process helps in identifying extreme price movements and mean-reversion opportunities more effectively. By converting the moving average into a Z-Score, traders can better gauge the relative strength or weakness of a trend and detect potential reversals. This method enhances the traditional moving average analysis by adding a statistical perspective, providing clearer and more objective trading signals.
5. How It Can Be Used in the Context of a Trading System
In a trading system, it can be used to generate buy and sell signals based on the Z-Score values. When the Z-Score crosses above zero, it indicates a potential buying opportunity, suggesting that the price is above its mean and possibly trending upward. Conversely, a Z-Score crossing below zero signals a potential selling opportunity, indicating that the price is below its mean and might be trending downward. Additionally, the indicator's ability to show standard deviation levels and extreme levels helps traders set profit targets and stop-loss levels, improving risk management and trade planning.
6. How It Can Be Used for Trend Following
For trend-following strategies, it can be particularly useful. The Z-Score oscillator helps traders identify the strength and direction of a trend. By monitoring the Z-Score and its rate of change, traders can confirm the persistence of a trend and make informed decisions to enter or exit trades. The indicator's divergence detection feature further enhances trend-following by identifying potential reversals before they occur, allowing traders to capitalize on trend shifts. By providing a clear and quantifiable measure of trend strength, this indicator supports disciplined and systematic trend-following strategies.
No backtests for this indicator due to the many options and ways it can be used,
Enjoy
Filtered MACD with Backtest [UAlgo]The "Filtered MACD with Backtest " indicator is an advanced trading tool designed for the TradingView platform. It combines the Moving Average Convergence Divergence (MACD) with additional filters such as Moving Average (MA) and Average Directional Index (ADX) to enhance trading signals. This indicator aims to provide more reliable entry and exit points by filtering out noise and confirming trends. Additionally, it includes a comprehensive backtesting module to simulate trading strategies and assess their performance based on historical data. The visual backtest module allows traders to see potential trades directly on the chart, making it easier to evaluate the effectiveness of the strategy.
🔶 Customizable Parameters :
Price Source Selection: Users can choose their preferred price source for calculations, providing flexibility in analysis.
Filter Parameters:
MA Filter: Option to use a Moving Average filter with types such as EMA, SMA, WMA, RMA, and VWMA, and a customizable length.
ADX Filter: Option to use an ADX filter with adjustable length and threshold to determine trend strength.
MACD Parameters: Customizable fast length, slow length, and signal smoothing for the MACD indicator.
Backtest Module:
Entry Type: Supports "Buy and Sell", "Buy", and "Sell" strategies.
Stop Loss Types: Choose from ATR-based, fixed point, or X bar high/low stop loss methods.
Reward to Risk Ratio: Set the desired take profit level relative to the stop loss.
Backtest Visuals: Display entry, stop loss, and take profit levels directly on the chart with
colored backgrounds.
Alerts: Configurable alerts for buy and sell signals.
🔶 Filtered MACD : Understanding How Filters Work with ADX and MA
ADX Filter:
The Average Directional Index (ADX) measures the strength of a trend. The script calculates ADX using the user-defined length and applies a threshold value.
Trading Signals with ADX Filter:
Buy Signal: A regular MACD buy signal (crossover of MACD line above the signal line) is only considered valid if the ADX is above the set threshold. This suggests a stronger uptrend to potentially capitalize on.
Sell Signal: Conversely, a regular MACD sell signal (crossunder of MACD line below the signal line) is only considered valid if the ADX is above the threshold, indicating a stronger downtrend for potential shorting opportunities.
Benefits: The ADX filter helps avoid whipsaws or false signals that might occur during choppy market conditions with weak trends.
MA Filter:
You can choose from various Moving Average (MA) types (EMA, SMA, WMA, RMA, VWMA) for the filter. The script calculates the chosen MA based on the user-defined length.
Trading Signals with MA Filter:
Buy Signal: A regular MACD buy signal is only considered valid if the closing price is above the MA value. This suggests a potential uptrend confirmed by the price action staying above the moving average.
Sell Signal: Conversely, a regular MACD sell signal is only considered valid if the closing price is below the MA value. This suggests a potential downtrend confirmed by the price action staying below the moving average.
Benefits: The MA filter helps identify potential trend continuation opportunities by ensuring the price aligns with the chosen moving average direction.
Combining Filters:
You can choose to use either the ADX filter, the MA filter, or both depending on your strategy preference. Using both filters adds an extra layer of confirmation for your signals.
🔶 Backtesting Module
The backtesting module in this script allows you to visually assess how the filtered MACD strategy would have performed on historical data. Here's a deeper dive into its features:
Backtesting Type: You can choose to backtest for buy signals only, sell signals only, or both. This allows you to analyze the strategy's effectiveness in different market conditions.
Stop-Loss Types: You can define how stop-loss orders are placed:
ATR (Average True Range): This uses a volatility measure (ATR) multiplied by a user-defined factor to set the stop-loss level.
Fixed Point: This allows you to specify a fixed dollar amount or percentage value as the stop-loss.
X bar High/Low: This sets the stop-loss at a certain number of bars (defined by the user) above/below the bar's high (for long positions) or low (for short positions).
Reward-to-Risk Ratio: Define the desired ratio between your potential profit and potential loss on each trade. The backtesting module will calculate take-profit levels based on this ratio and the stop-loss placement.
🔶 Disclaimer:
Use with Caution: This indicator is provided for educational and informational purposes only and should not be considered as financial advice. Users should exercise caution and perform their own analysis before making trading decisions based on the indicator's signals.
Not Financial Advice: The information provided by this indicator does not constitute financial advice, and the creator (UAlgo) shall not be held responsible for any trading losses incurred as a result of using this indicator.
Backtesting Recommended: Traders are encouraged to backtest the indicator thoroughly on historical data before using it in live trading to assess its performance and suitability for their trading strategies.
Risk Management: Trading involves inherent risks, and users should implement proper risk management strategies, including but not limited to stop-loss orders and position sizing, to mitigate potential losses.
No Guarantees: The accuracy and reliability of the indicator's signals cannot be guaranteed, as they are based on historical price data and past performance may not be indicative of future results.

Directional Movement Index DEThis script uses the existing built-in DMI indicator but adds two lines indicating strength of the ADX trend. The original author J. Welles Wilder, indicated a ADX trending strongly above 25 (yellow by default), and ADX trending weaker at a threshold of 20 or below (dashed yellow by default).
The default colours have been changed so that ADX is yellow, +DI is green, and -DI is red.
Calculation
Calculating the DMI can actually be broken down into two parts. First, calculating the +DI and -DI, and second, calculating the ADX. To calculate the +DI and -DI you need to find the +DM and -DM (Directional Movement). +DM and -DM are calculated using the High, Low and Close for each period. You can then calculate the following:
Current High - Previous High = UpMove
Previous Low - Current Low = DownMove
If UpMove > DownMove and UpMove > 0, then +DM = UpMove, else +DM = 0
If DownMove > Upmove and Downmove > 0, then -DM = DownMove, else -DM = 0
Once you have the current +DM and -DM calculated, the +DM and -DM lines can be calculated and plotted based on the number of user defined periods.
+DI = 100 times Exponential Moving Average of (+DM / Average True Range)
-DI = 100 times Exponential Moving Average of (-DM / Average True Range)
Now that -+DX and -DX have been calculated, the last step is calculating the ADX.
ADX = 100 times the Exponential Moving Average of the Absolute Value of (+DI - -DI) / (+DI + -DI)
The basics
DMI has a value between 0 and 100 and is used to measure the strength of the current trend. +DI and -DI are then used to measure direction. When combined, the indicator can provide some valuable insight. A general interpretation would be that during a strong trend (ADX above 25 but dependent on the analyst's interpretation), when the +DI is above the -DI, then a Bullish Market is defined. When -DI is above +DI, then a Bearish Market is at hand.
One thing to be considered is that what DMI values determine, strength or a potential signal, is up to the trader's interpretation. Acceptable values may change depending on the financial instrument being examined, therefore some historical analysis of the instrument in question would be prudent. A technical analyst can make better decisions based on what has occurred in historical examples.
All credit goes to the original script .

Median Moving Average @shrilssThe "Median Moving Average" (MMA) It allows users to select from two moving average lengths—short and long—and plots the median moving average, which is the midpoint between these two averages. Colored green for upward trends and red for downward trends, enhancing visual analysis.
Additionally, users can choose from a range of moving average types including Simple (SMA), Exponential (EMA), Weighted (WMA), Double Exponential (DEMA), Triple Exponential (TEMA), Hull (HMA), and Volume Weighted (VWMA).
Moving Average Bands with Signals [UAlgo]The "Moving Average Bands with Signals combines various moving average types with ATR-based bands to help traders identify potential support and resistance levels.
It plots moving average bands with upper and lower support/resistance levels based on the Average True Range (ATR) and user-defined settings.Additionally, the script generates buy/sell signals based on price crossing above or below the bands.
🔶 Key Features
Multiple Moving Average Types:
Supports various moving average calculations including Arnaud Legoux Moving Average (ALMA), Exponential Moving Average (EMA), Double Exponential Moving Average (DEMA), Triple Exponential Moving Average (TEMA), Kaufman Adaptive Moving Average (KAMA), Hull Moving Average (HMA), Least Squares Moving Average (LSMA), Simple Moving Average (SMA), Triangular Moving Average (TMA), Volume-Weighted Moving Average (VWMA), Weighted Moving Average (WMA), and Zero-Lag Moving Average (ZLMA).
Customizable ATR Bands:
Integrates the Average True Range (ATR) to calculate dynamic support and resistance bands around the moving average. The multiplier for the bands is user-adjustable, allowing for finer control over the sensitivity and width of the bands.
Signal Generation:
Provides visual signals on the chart when the price interacts with the support or resistance bands. Users can choose between using the wick or the close price to generate these signals, adding an extra layer of customization based on their trading style.
Flexible Input Parameters:
Allows users to input parameters for moving average length, ATR length, band multiplier, and signal type. Additional settings are available for specific moving average types, such as ALMA's offset and sigma, KAMA's fast and slow periods, and LSMA's offset.
🔶 Disclaimer
This script is provided for educational purposes only and should not be considered financial advice.
Trading financial instruments involves substantial risk and can result in significant financial losses.
The script’s performance in the past is not indicative of future results, and no guarantees are made regarding its accuracy, reliability, or performance.

GM-8 and ADX Strategy with Second EMADescription:
This TradingView script implements a trading strategy based on the Moving Average (GM-8), the Average Directional Index (ADX), and the second Exponential Moving Average (EMA). The strategy utilizes these indicators to identify potential buy and sell signals on the chart.
Indicators:
GM-8 (Moving Average 8): This indicator calculates the average price of the last 8 periods and is used to identify trends.
ADX (Average Directional Index): The ADX measures the strength of a trend and is used to determine whether the market is moving in a particular direction or not.
Second EMA (Exponential Moving Average): This is an additional EMA line with a period of 59, which is used to provide additional confirmation signals for the trend.
Trading Conditions:
Buy Condition: A buy signal is generated when the closing price is above the GM-8 and the second EMA, and the ADX value is above the specified threshold.
Sell Condition: A sell signal is generated when the closing price is below the GM-8 and the second EMA, and the ADX value is above the specified threshold.
Trading Logic:
If a buy condition is met, a long position is opened with a user-defined lot size.
If a sell condition is met, a short position is opened with the same user-defined lot size.
Positions are closed when the opposite conditions are met.
User Parameters:
Users can adjust the periods for the GM-8, the second EMA, and the ADX, as well as the threshold for the ADX and the lot size according to their preferences.
Note:
This script has been developed for use on a $100,000 account with FTMO, therefore the account size is set to $100,000. Please ensure that the strategy parameters and settings meet the requirements of your trading strategy and carefully review the results before committing real capital.
--------------------------------------------------------------------------------------------------------------
Beschreibung:
Dieses TradingView-Skript implementiert eine Handelsstrategie, die auf dem gleitenden Mittelwert (GM-8), dem Average Directional Index (ADX) und der zweiten exponentiellen gleitenden Durchschnittslinie (EMA) basiert. Die Strategie verwendet diese Indikatoren, um potenzielle Kauf- und Verkaufssignale auf dem Chart zu identifizieren.
Indikatoren:
GM-8 (Gleitender Mittelwert 8): Dieser Indikator berechnet den Durchschnittspreis der letzten 8 Perioden und wird verwendet, um Trends zu identifizieren.
ADX (Average Directional Index): Der ADX misst die Stärke eines Trends und wird verwendet, um festzustellen, ob sich der Markt in eine bestimmte Richtung bewegt oder nicht.
Zweite EMA (Exponential Moving Average): Dies ist eine zusätzliche EMA-Linie mit einer Periode von 59, die verwendet wird, um zusätzliche Bestätigungssignale für den Trend zu liefern.
Handelsbedingungen:
Kaufbedingung: Es wird ein Kaufsignal generiert, wenn der Schlusskurs über dem GM-8 und der zweiten EMA liegt und der ADX-Wert über dem angegebenen Schwellenwert liegt.
Verkaufsbedingung: Es wird ein Verkaufssignal generiert, wenn der Schlusskurs unter dem GM-8 und der zweiten EMA liegt und der ADX-Wert über dem angegebenen Schwellenwert liegt.
Handelslogik:
Wenn eine Kaufbedingung erfüllt ist, wird eine Long-Position mit einer benutzerdefinierten Losgröße eröffnet.
Wenn eine Verkaufsbedingung erfüllt ist, wird eine Short-Position mit derselben benutzerdefinierten Losgröße eröffnet.
Positionen werden geschlossen, wenn die Gegenbedingungen erfüllt sind.
Benutzerparameter:
Benutzer können die Perioden für den GM-8, die zweite EMA und den ADX sowie den Schwellenwert für den ADX und die Losgröße nach ihren eigenen Präferenzen anpassen.
Hinweis:
Dieses Skript wurde für die Verwendung auf einem $100.000-Konto bei FTMO entwickelt, daher ist die Kontogröße auf $100.000 festgelegt. Bitte stellen Sie sicher, dass die Strategieparameter und -einstellungen den Anforderungen Ihrer Handelsstrategie entsprechen und dass Sie die Ergebnisse sorgfältig überprüfen, bevor Sie echtes Kapital einsetzen.

EMA 9/13/18/25 + Bollinger BandThe indicator combines two components: Exponential Moving Averages (EMAs) and Bollinger Bands.
Exponential Moving Averages (EMAs): The indicator calculates four EMAs with different periods: 9, 13, 18, and 25. An Exponential Moving Average is a type of moving average that places a greater weight and significance on the most recent data points. As the name suggests, it's an average of the asset's price over a certain period, with recent prices given more weight in the calculation, making it more responsive to recent price changes.
Bollinger Bands: Bollinger Bands consist of a simple moving average (the basis) and two standard deviations plotted away from it. The standard deviations are multiplied by a factor (usually 2) to determine the distance from the basis. These bands dynamically adjust themselves based on recent price movements. The upper band represents the highest price level reached in the given period, while the lower band represents the lowest price level.
Combining these components provides traders with insights into both trend direction and volatility. The EMAs help identify trends by smoothing out price data, while the Bollinger Bands offer insights into volatility and potential price reversal points. Traders often use the crossovers of EMAs and interactions with Bollinger Bands to make trading decisions. For example, when the price touches the upper Bollinger Band, it may indicate overbought conditions, while touching the lower band may suggest oversold conditions. Additionally, crossovers of EMAs (such as the shorter-term EMA crossing above or below the longer-term EMA) may signal changes in trend direction.
Fine-tune Inputs: Fourier Smoothed Volume zone oscillator WFSVZ0Use this Strategy to Fine-tune inputs for the (W&)FSVZ0 Indicator.
Strategy allows you to fine-tune the indicator for 1 TimeFrame at a time; cross Timeframe Input fine-tuning is done manually after exporting the chart data.
I suggest using "Close all" input False when fine-tuning Inputs for 1 TimeFrame. When you export data to Excel/Numbers/GSheets I suggest using "Close all" input as True, except for the lowest TimeFrame.
MEANINGFUL DESCRIPTION:
The Volume Zone oscillator breaks up volume activity into positive and negative categories. It is positive when the current closing price is greater than the prior closing price and negative when it's lower than the prior closing price. The resulting curve plots through relative percentage levels that yield a series of buy and sell signals, depending on level and indicator direction.
The Wavelet & Fourier Smoothed Volume Zone Oscillator (W&)FSVZO is a refined version of the Volume Zone Oscillator, enhanced by the implementation of the Discrete Fourier Transform . Its primary function is to streamline price data and diminish market noise, thus offering a clearer and more precise reflection of price trends.
By combining the Wavalet and Fourier aproximation with Ehler's white noise histogram, users gain a comprehensive perspective on volume-related market conditions.
HOW TO USE THE INDICATOR:
The default period is 2 but can be adjusted after backtesting. (I suggest 5 VZO length and NoiceR max length 8 as-well)
The VZO points to a positive trend when it is rising above the 0% level, and a negative trend when it is falling below the 0% level. 0% level can be adjusted in setting by adjusting VzoDifference. Oscillations rising below 0% level or falling above 0% level result in a natural trend.
HOW TO USE THE STRATEGY:
Here you fine-tune the inputs until you find a combination that works well on all Timeframes you will use when creating your Automated Trade Algorithmic Strategy. I suggest 4h, 12h, 1D, 2D, 3D, 4D, 5D, 6D, W and M.
When I ndicator/Strategy returns 0 or natural trend , Strategy Closes All it's positions.
ORIGINALITY & USFULLNESS:
Personal combination of Fourier and Wavalet aproximation of a price which results in less noise Volume Zone Oscillator.
The Wavelet Transform is a powerful mathematical tool for signal analysis, particularly effective in analyzing signals with varying frequency or non-stationary characteristics. It dissects a signal into wavelets, small waves with varying frequency and limited duration, providing a multi-resolution analysis. This approach captures both frequency and location information, making it especially useful for detecting changes or anomalies in complex signals.
The Discrete Fourier Transform (DFT) is a mathematical technique that transforms discrete data from the time domain into its corresponding representation in the frequency domain. This process involves breaking down a signal into its individual frequency components, thereby exposing the amplitude and phase characteristics inherent in each frequency element.
This indicator utilizes the concept of Ehler's Universal Oscillator and displays a histogram, offering critical insights into the prevailing levels of market noise. The Ehler's Universal Oscillator is grounded in a statistical model that captures the erratic and unpredictable nature of market movements. Through the application of this principle, the histogram aids traders in pinpointing times when market volatility is either rising or subsiding.
DETAILED DESCRIPTION:
My detailed description of the indicator and use cases which I find very valuable.
What is oscillator?
Oscillators are chart indicators that can assist a trader in determining overbought or oversold conditions in ranging (non-trending) markets.
What is volume zone oscillator?
Price Zone Oscillator measures if the most recent closing price is above or below the preceding closing price.
Volume Zone Oscillator is Volume multiplied by the 1 or -1 depending on the difference of the preceding 2 close prices and smoothed with Exponential moving Average.
What does this mean?
If the VZO is above 0 and VZO is rising. We have a bullish trend. Most likely.
If the VZO is below 0 and VZO is falling. We have a bearish trend. Most likely.
Rising means that VZO on close is higher than the previous day.
Falling means that VZO on close is lower than the previous day.
What if VZO is falling above 0 line?
It means we have a high probability of a bearish trend.
Thus the indicator returns 0 and Strategy closes all it's positions when falling above 0 (or rising bellow 0) and we combine higher and lower timeframes to gauge the trend.
In the next Image you can see that trend is negative on 4h, negative on 12h and positive on 1D. That means trend is negative.
I am sorry, the chart is a bit messy. The idea is to use the indicator over more than 1 Timeframe.
What is approximation and smoothing?
They are mathematical concepts for making a discrete set of numbers a
continuous curved line.
Fourier and Wavelet approximation of a close price are taken from aprox library.
Key Features:
You can tailor the Indicator/Strategy to your preferences with adjustable parameters such as VZO length, noise reduction settings, and smoothing length.
Volume Zone Oscillator (VZO) shows market sentiment with the VZO, enhanced with Exponential Moving Average (EMA) smoothing for clearer trend identification.
Noise Reduction leverages Euler's White noise capabilities for effective noise reduction in the VZO, providing a cleaner and more accurate representation of market dynamics.
Choose between the traditional Fast Fourier Transform (FFT) , the innovative Double Discrete Fourier Transform (DTF32) and Wavelet soothed Fourier soothed price series to suit your analytical needs.
Image of Wavelet transform with FAST settings, Double Fourier transform with FAST settings. Improved noice reduction with SLOW settings, and standard FSVZO with SLOW settings:
Fast setting are setting by default:
VZO length = 2
NoiceR max Length = 2
Slow settings are:
VZO length = 5 or 7
NoiceR max Length = 8
As you can see fast setting are more volatile. I suggest averaging fast setting on 4h 12h 1d 2d 3d 4d W and M Timeframe to get a clear view on market trend.
What if I want long only when VZO is rising and above 15 not 0?
You have set Setting VzoDifference to 15. That reduces the number of trend changes.
Example of W&FSVZO with VzoDifference 15 than 0:
VZO crossed 0 line but not 15 line and that's why Indicator returns 0 in one case an 1 in another.
What is Smooth length setting?
A way of calculating Bullish or Bearish (W&)FSVZO .
If smooth length is 2 the trend is rising if:
rising = VZO > ta.ema(VZO, 2)
Meaning that we check if VZO is higher that exponential average of the last 2 elements.
If smooth length is 1 the trend is rising if:
rising = VZO_ > VZO_
Use this Strategy to fine-tune inputs for the (W&)FSVZO Indicator.
(Strategy allows you to fine-tune the indicator for 1 TimeFrame at a time; cross Timeframe Input fine-tuning is done manually after exporting the chart data)
I suggest using " Close all " input False when fine-tuning Inputs for 1 TimeFrame . When you export data to Excel/Numbers/GSheets I suggest using " Close all " input as True , except for the lowest TimeFrame . I suggest using 100% equity as your default quantity for fine-tune purposes. I have to mention that 100% equity may lead to unrealistic backtesting results. Be avare. When backtesting for trading purposes use Contracts or USDT.

200 EMA Trend Strategy Anti meanDescription:
The "200 EMA Trend Strategy" is a versatile technical analysis tool designed for day trading and long-term investing. It aims to identify potential trend reversal points in the market based on the interaction between the price and the 200-period Exponential Moving Average (EMA). This strategy utilizes the 200 EMA, standard deviation bands, and basic trend analysis to generate buy and sell signals.
Key Features:
200-period Exponential Moving Average (EMA): The indicator plots the 200-period Exponential Moving Average, a reliable trend-following indicator that smooths out price data to identify the underlying trend direction.
Standard Deviation Bands: Upper and lower bands around the 200 EMA are calculated based on a specified standard deviation multiplier. These bands help identify potential overbought and oversold levels in the market.
Trend Signals: Buy signals are generated when the price crosses above the 200 EMA, indicating a potential bullish trend, while sell signals are generated when the price crosses below the 200 EMA, indicating a potential bearish trend.
Exit Signals: Exit signals are triggered when the price moves beyond the standard deviation bands in the opposite direction of the current trend. Most trades will be exited with minimal losses, aiming to grow the trading account over time. Multiple exit signals may be displayed, but only the first signal will be considered, ignoring subsequent signals to minimize drawdown.
Usage:
Day Trading: For intraday trading, traders can use a one-minute chart and fix the indicator's timeframe to five minutes. This allows for quick decision-making and minimizes drawdown by focusing on short-term price movements.
Long-Term Investing: For long-term investing, traders can utilize a four-hour or two-hour chart and fix the indicator's timeframe to daily or one-day timeframe. This provides a broader perspective of the market trends and allows for strategic positioning over longer time horizons.
Risk Management: Employ proper risk management techniques and position sizing strategies to mitigate losses and maximize profits. Use the indicator's exit signals to exit trades with minimal losses and allow profitable trades to grow the trading account over time.
Risk Disclosure: Trading involves risks, and this indicator should be used as part of a comprehensive trading strategy. It is essential to consider risk management principles and employ proper position sizing techniques when trading based on the signals generated by this indicator.
Composite Trend Oscillator [ChartPrime]CODE DUELLO:
Have you ever stopped to wonder what the underlying filters contained within complex algorithms are actually providing for you? Wouldn't it be nice to actually visually inspect for that? Those would require some kind of wild west styled quick draw duel or some comparison method as a proper 'code duello'. Then it can be determined which filter can 'draw' the quickest from it's computational holster with the least amount of lag and smoothness.
In Pine we can do so, discovering how beneficial that would be. This can be accomplished by quickly switching from one filter to another by input() back and forth, requiring visual memory. A better way could be done by placing two indicators added to the chart and then eventually placed into one indicator pane on top of each other.
By adding a filter() helper function that calls other moving average functions chosen for comparison, it can put to the test which moving average is the best drawing filter suited to our expected needs. PhiSmoother was formerly debuted and now it is utilized in a more complex environment in a multitude of ways along side other commonly utilized filters. Now, you the reader, get to judge for yourself...
FILTER VERSATILITY:
Having the capability to adjust between various smoothing methods such as PhiSmoother, TEMA, DEMA, WMA, EMA, and SMA on historical market data within the code provides an advantage. Each of these filter methods offers distinct advantages and hinderances. PhiSmoother stands out often by having superb noise rejection, while also being able to manipulate the fine-tuning of the phase or lag of the indicator, enhancing responsiveness to price movements.
The following are more well-known classic filters. TEMA (Triple Exponential Moving Average) and DEMA (Double Exponential Moving Average) offer reduced transient response times to price changes fluctuations. WMA (Weighted Moving Average) assigns more weight to recent data points, making it particularly useful for reduced lag. EMA (Exponential Moving Average) strikes a balance between responsiveness and computational efficiency, making it a popular choice. SMA (Simple Moving Average) provides a straightforward calculation based on the arithmetic mean of the data. VWMA and RMA have both been excluded for varying reasons, both being unworthy of having explanation here.
By allowing for adjustment refinements between these filter methods, traders may garner the flexibility to adapt their analysis to different market dynamics, optimizing their algorithms for improved decision-making and performance on demand.
INDICATOR INTRODUCTION:
ChartPrime's Composite Trend Oscillator operates as an oscillator based on the concept of a moving average ribbon. It utilizes up to 32 filters with progressively longer periods to assess trend direction and strength. Embedded within this indicator is an alternative view that utilizes the separation of the ribbon filaments to assess volatility. Both versions are excellent candidates for trend and momentum, both offering visualization of polarity, directional coloring, and filter crossings. Anyone who has former experience using RSI or stochastics may have ease of understanding applying this to their chart.
COMPOSITE CLUSTER MODES EXPLAINED:
In Trend Strength mode, the oscillator behavior signifies market direction and movement strength. When the oscillator is rising and above zero, the market is within a bullish phase, and visa versa. If the signal filter crosses the composite trend, this indicates a potential dynamic shift signaling a possible reversal. When the oscillator is teetering on its extremities, the market is more inclined to reverse later.
With Volatility mode, the oscillator undergoes a transformation, displaying an unbounded oscillator driven by market volatility. While it still employs the same scoring mechanism, it is now scaled according to the strength of the market move. This can aid with identification of ranging scenarios. However, one side effect is that the oscillator no longer has minimum or maximum boundaries. This can still be advantageous when considering divergences.
NOTEWORTHY SETTINGS FEATURES:
The following input settings described offer comprehensive control over the indicator's behavior and visualization.
Common Controls:
Price Source Selection - The indicator offers flexibility in choosing the price source for analysis. Traders can select from multiple options.
Composite Cluster Mode - Choose between "Trend Strength" and "Volatility" modes, providing insights into trend directionality or volatility weighting.
Cluster Filter and Length - Selects a filter for the cluster composition. This includes a length parameter adjustment.
Cluster Options:
Cluster Dispersion - Users can adjust the separation between moving averages in the cluster, influencing the sensitivity of the analysis.
Cluster Trimming - By modifying upper and lower trim parameters, traders can adjust the sensitivity of the moving averages within the cluster, enhancing its adaptability.
PostSmooth Filter and Length - Choose a filter to refine the composite cluster's post-smoothing with a length parameter adjustment.
Signal Filter and Length - Users can select a filter for the lagging signal plot, also having a length parameter adjustment.
Transition Easing - Sensitivity adjustment to influence the transition between bullish and bearish colors.
Enjoy

Wavelet & Fourier Smoothed Volume zone oscillator (W&)FSVZO Indicator id:
USER;e7a774913c1242c3b1354334a8ea0f3c
(only relevant to those that use API requests)
MEANINGFUL DESCRIPTION:
The Volume Zone oscillator breaks up volume activity into positive and negative categories. It is positive when the current closing price is greater than the prior closing price and negative when it's lower than the prior closing price. The resulting curve plots through relative percentage levels that yield a series of buy and sell signals, depending on level and indicator direction.
The Wavelet & Fourier Smoothed Volume Zone Oscillator (W&)FSVZO is a refined version of the Volume Zone Oscillator, enhanced by the implementation of the Discrete Fourier Transform. Its primary function is to streamline price data and diminish market noise, thus offering a clearer and more precise reflection of price trends.
By combining the Wavalet and Fourier aproximation with Ehler's white noise histogram, users gain a comprehensive perspective on volume-related market conditions.
HOW TO USE THE INDICATOR:
The default period is 2 but can be adjusted after backtesting. (I suggest 5 VZO length and NoiceR max length 8 as-well)
The VZO points to a positive trend when it is rising above the 0% level, and a negative trend when it is falling below the 0% level. 0% level can be adjusted in setting by adjusting VzoDifference. Oscillations rising below 0% level or falling above 0% level result in natural trend.
ORIGINALITY & USFULLNESS:
Personal combination of Fourier and Wavalet aproximation of a price which results in less noise Volume Zone Oscillator.
The Wavelet Transform is a powerful mathematical tool for signal analysis, particularly effective in analyzing signals with varying frequency or non-stationary characteristics. It dissects a signal into wavelets, small waves with varying frequency and limited duration, providing a multi-resolution analysis. This approach captures both frequency and location information, making it especially useful for detecting changes or anomalies in complex signals.
The Discrete Fourier Transform (DFT) is a mathematical technique that transforms discrete data from the time domain into its corresponding representation in the frequency domain. This process involves breaking down a signal into its individual frequency components, thereby exposing the amplitude and phase characteristics inherent in each frequency element.
This indicator utilizes the concept of Ehler's Universal Oscillator and displays a histogram, offering critical insights into the prevailing levels of market noise. The Ehler's Universal Oscillator is grounded in a statistical model that captures the erratic and unpredictable nature of market movements. Through the application of this principle, the histogram aids traders in pinpointing times when market volatility is either rising or subsiding.
DETAILED DESCRIPTION:
My detailed description of the indicator and use cases which I find very valuable.
What is oscillator?
Oscillators are chart indicators that can assist a trader in determining overbought or oversold conditions in ranging (non-trending) markets.
What is volume zone oscillator?
Price Zone Oscillator measures if the most recent closing price is above or below the preceding closing price.
Volume Zone Oscillator is Volume multiplied by the 1 or -1 depending on the difference of the preceding 2 close prices and smoothed with Exponential moving Average.
What does this mean?
If the VZO is above 0 and VZO is rising. We have a bullish trend. Most likely.
If the VZO is below 0 and VZO is falling. We have a bearish trend. Most likely.
Rising means that VZO on close is higher than the previous day.
Falling means that VZO on close is lower than the previous day.
What if VZO is falling above 0 line?
It means we have a high probability of a bearish trend.
Thus the indicator returns 0 when falling above 0 (or rising bellow 0) and we combine higher and lower timeframes to gauge the trend.
In the next Image you can see that trend is positive on 4h, neutral on 12h and positive on 1D. That means trend is positive.
I am sorry, the chart is a bit messy. The idea is to use the indicator over more than 1 Timeframe.
What is approximation and smoothing?
They are mathematical concepts for making a discrete set of numbers a
continuous curved line.
Fourier and Wavelet approximation of a close price are taken from aprox library.
Key Features:
You can tailor the indicator to your preferences with adjustable parameters such as VZO length, noise reduction settings, and smoothing length.
Volume Zone Oscillator (VZO) shows market sentiment with the VZO, enhanced with Exponential Moving Average (EMA) smoothing for clearer trend identification.
Noise Reduction leverages Euler's White noise capabilities for effective noise reduction in the VZO, providing a cleaner and more accurate representation of market dynamics.
Choose between the traditional Fast Fourier Transform (FFT), the innovative Double Discrete Fourier Transform (DTF32) and Wavelet soothed Fourier soothed price series to suit your analytical needs.
Image of Wavelet transform with FAST settings, Double Fourier transform with FAST settings. Improved noice reduction with SLOW settings, and standard FSVZO with SLOW settings:
Fast setting are setting by default:
VZO length = 2
NoiceR max Length = 2
Slow settings are:
VZO length = 5 or 7
NoiceR max Length = 8
As you can see fast setting are more volatile. I suggest averaging fast setting on 4h 12h 1d 2d 3d 4d W and M Timeframe to get a clear view on market trend.
What if I want long only when VZO is rising and above 15 not 0?
You have set Setting VzoDifference to 15. That reduces the number of trend changes.
Example of W&FSVZO with VzoDifference 15 than 0:
VZO crossed 0 line but not 15 line and that's why Indicator returns 0 in one case an 1 in another.
What is Smooth length setting?
A way of calculating Bullish or Bearish FSVZO.
If smooth length is 2 the trend is rising if:
rising = VZO > ta.ema(VZO, 2)
Meaning that we check if VZO is higher that exponential average of the last 2 elements.
If smooth length is 1 the trend is rising if:
rising = VZO_ > VZO_
Rising is boolean value, meaning TRUE if rising and FALSE if falling.
Mathematical equations presented in Pinescript:
Fourier of the real (x axis) discrete:
x_0 = array.get(x, 0) + array.get(x, 1) + array.get(x, 2)
x_1 = array.get(x, 0) + array.get(x, 1) * math.cos( -2 * math.pi * _dir / 3 ) - array.get(y, 1) * math.sin( -2 * math.pi * _dir / 3 ) + array.get(x, 2) * math.cos( -4 * math.pi * _dir / 3 ) - array.get(y, 2) * math.sin( -4 * math.pi * _dir / 3 )
x_2 = array.get(x, 0) + array.get(x, 1) * math.cos( -4 * math.pi * _dir / 3 ) - array.get(y, 1) * math.sin( -4 * math.pi * _dir / 3 ) + array.get(x, 2) * math.cos( -8 * math.pi * _dir / 3 ) - array.get(y, 2) * math.sin( -8 * math.pi * _dir / 3 )
Euler's Noice reduction with both close and Discrete Furrier approximated price.
w = (dft1*src - dft1 *src ) / math.sqrt(math.pow(math.abs(src- src ),2) + math.pow(math.abs(dft1 - dft1 ),2))
filt := na(filt ) ? 0 : c1 * (w*dft1 + nz(w *dft1 )) / 2.0 /math.abs(dft1 -dft1 ) + c2 * nz(filt ) - c3 * nz(filt )
Usecase:
First option:
Select the preferred version of DFT and noise reduction settings based on your analysis requirements.
Leverage the script to identify Bullish and Bearish trends, shown with green and red triangle.
Combine Different Timeframes to accurately determine market trend.
Second option:
Pull the data with API sockets to automate your trading journey.
plot(close, title="ClosePrice", display=display.status_line)
plot(open, title="OpenPrice", display=display.status_line)
plot(greencon ? 1 : redcon ? -1 : 0, title="position", display=display.status_line)
Use ClosePrice, OpenPrice and "position" titles to easily read and backtest your strategy utilising more than 1 Time Frame.
Indicator id:
USER;e7a774913c1242c3b1354334a8ea0f3c
(only relevant to those that use API requests)

Trend Deviation strategy - BTC [IkkeOmar]Intro:
This is an example if anyone needs a push to get started with making strategies in pine script. This is an example on BTC, obviously it isn't a good strategy, and I wouldn't share my own good strategies because of alpha decay.
This strategy integrates several technical indicators to determine market trends and potential trade setups. These indicators include:
Directional Movement Index (DMI)
Bollinger Bands (BB)
Schaff Trend Cycle (STC)
Moving Average Convergence Divergence (MACD)
Momentum Indicator
Aroon Indicator
Supertrend Indicator
Relative Strength Index (RSI)
Exponential Moving Average (EMA)
Volume Weighted Average Price (VWAP)
It's crucial for you guys to understand the strengths and weaknesses of each indicator and identify synergies between them to improve the strategy's effectiveness.
Indicator Settings:
DMI (Directional Movement Index):
Length: This parameter determines the number of bars used in calculating the DMI. A higher length may provide smoother results but might lag behind the actual price action.
Bollinger Bands:
Length: This parameter specifies the number of bars used to calculate the moving average for the Bollinger Bands. A longer length results in a smoother average but might lag behind the price action.
Multiplier: The multiplier determines the width of the Bollinger Bands. It scales the standard deviation of the price data. A higher multiplier leads to wider bands, indicating increased volatility, while a lower multiplier results in narrower bands, suggesting decreased volatility.
Schaff Trend Cycle (STC):
Length: This parameter defines the length of the STC calculation. A longer length may result in smoother but slower-moving signals.
Fast Length: Specifies the length of the fast moving average component in the STC calculation.
Slow Length: Specifies the length of the slow moving average component in the STC calculation.
MACD (Moving Average Convergence Divergence):
Fast Length: Determines the number of bars used to calculate the fast EMA (Exponential Moving Average) in the MACD.
Slow Length: Specifies the number of bars used to calculate the slow EMA in the MACD.
Signal Length: Defines the number of bars used to calculate the signal line, which is typically an EMA of the MACD line.
Momentum Indicator:
Length: This parameter sets the number of bars over which momentum is calculated. A longer length may provide smoother momentum readings but might lag behind significant price changes.
Aroon Indicator:
Length: Specifies the number of bars over which the Aroon indicator calculates its values. A longer length may result in smoother Aroon readings but might lag behind significant market movements.
Supertrend Indicator:
Trendline Length: Determines the length of the period used in the Supertrend calculation. A longer length results in a smoother trendline but might lag behind recent price changes.
Trendline Factor: Specifies the multiplier used in calculating the trendline. It affects the sensitivity of the indicator to price changes.
RSI (Relative Strength Index):
Length: This parameter sets the number of bars over which RSI calculates its values. A longer length may result in smoother RSI readings but might lag behind significant price changes.
EMA (Exponential Moving Average):
Fast EMA: Specifies the number of bars used to calculate the fast EMA. A shorter period results in a more responsive EMA to recent price changes.
Slow EMA: Determines the number of bars used to calculate the slow EMA. A longer period results in a smoother EMA but might lag behind recent price changes.
VWAP (Volume Weighted Average Price):
Default settings are typically used for VWAP calculations, which consider the volume traded at each price level over a specific period. This indicator provides insights into the average price weighted by trading volume.
backtest range and rules:
You can specify the start date for backtesting purposes.
You can can select the desired trade direction: Long, Short, or Both.
Entry and Exit Conditions:
LONG:
DMI Cross Up: The Directional Movement Index (DMI) indicates a bullish trend when the positive directional movement (+DI) crosses above the negative directional movement (-DI).
Bollinger Bands (BB): The price is below the upper Bollinger Band, indicating a potential reversal from the upper band.
Momentum Indicator: Momentum is positive, suggesting increasing buying pressure.
MACD (Moving Average Convergence Divergence): The MACD line is above the signal line, indicating bullish momentum.
Supertrend Indicator: The Supertrend indicator signals an uptrend.
Schaff Trend Cycle (STC): The STC indicates a bullish trend.
Aroon Indicator: The Aroon indicator signals a bullish trend or crossover.
When all these conditions are met simultaneously, the strategy considers it a favorable opportunity to enter a long trade.
SHORT:
DMI Cross Down: The Directional Movement Index (DMI) indicates a bearish trend when the negative directional movement (-DI) crosses above the positive directional movement (+DI).
Bollinger Bands (BB): The price is above the lower Bollinger Band, suggesting a potential reversal from the lower band.
Momentum Indicator: Momentum is negative, indicating increasing selling pressure.
MACD (Moving Average Convergence Divergence): The MACD line is below the signal line, signaling bearish momentum.
Supertrend Indicator: The Supertrend indicator signals a downtrend.
Schaff Trend Cycle (STC): The STC indicates a bearish trend.
Aroon Indicator: The Aroon indicator signals a bearish trend or crossover.
When all these conditions align, the strategy considers it an opportune moment to enter a short trade.
Disclaimer:
THIS ISN'T AN OPTIMAL STRATEGY AT ALL! It was just an old project from when I started learning pine script!
The backtest doesn't promise the same results in the future, always do both in-sample and out-of-sample testing when backtesting a strategy. And make sure you forward test it as well before implementing it!
Furthermore this strategy uses both trend and mean-reversion systems, that is usually a no-go if you want to build robust trend systems .
Don't hesitate to comment if you have any questions or if you have some good notes for a beginner.

CPR by JBISIncludes CPR, Pivot Points and an EMA. This advanced technical indicator amalgamates critical components essential for robust market analysis: CPR (Central Pivot Range), Pivot Points, and EMA (Exponential Moving Average). Designed to empower traders with comprehensive insights, this indicator serves as a dynamic tool for chart analysis across various timeframes and markets.
CPR (Central Pivot Range):
Central Pivot Range, often abbreviated as CPR, represents a pivotal zone delineating critical support and resistance levels within a given trading session. Calculated from the previous session's high, low, and close, CPR helps identify potential reversal points and areas of price consolidation.
Pivot Points:
Pivot Points are key price levels derived from the previous session's high, low, and close. These levels serve as significant reference points for traders to anticipate potential price movements, gauge market sentiment, and formulate strategic entry and exit points.
EMA (Exponential Moving Average):
EMA, or Exponential Moving Average, is a widely-used trend-following indicator that places greater emphasis on recent price data. By smoothing out price fluctuations, EMA provides traders with a clearer depiction of market trends, facilitating timely decision-making and trend identification.
Key Features:
Customizable Parameters: Tailor the indicator settings to align with your trading strategy and risk tolerance.
Multi-Timeframe Analysis: Seamlessly analyze price action across different timeframes, enabling comprehensive market assessment and strategy formulation.
Visual Clarity: Intuitive chart visualization ensures easy interpretation of key levels and trend dynamics.
Real-Time Updates: Stay informed with real-time updates as market conditions evolve, empowering proactive decision-making and trade execution.

Advanced Volume Analytics and Distribution IndicatorThe Advanced Volume Analytics and Distribution Indicator is a sophisticated tool designed for financial analysts and traders who seek in-depth insights into market volume dynamics. This Pine Script-based indicator is a comprehensive solution, offering a rich set of features that analyze volume data using various statistical methods and theories. It's tailored for those who require a deeper understanding of market movements and volume distribution.
Key Features:
Volume Distribution Analysis: Utilizes standard deviation and mean calculations to analyze the distribution of trading volume. Employs z-scores to measure the standard deviations of volume from its mean, offering insights into volume anomalies.
Bell Curve Modeling: Constructs a bell curve (normal distribution) based on volume data, enabling users to visualize and assess the distribution of volume in a standard statistical format.
Provides a z-score based bell curve, offering a normalized view of volume deviations.
Exponential Smoothing: Applies exponential smoothing to volume data, giving more weight to recent observations. This feature is crucial for analyzing trending behaviors in volume data.
Stress Metric Calculation: Introduces a unique 'stress' metric, calculated using a custom formula. This metric is designed to evaluate the volatility or variability in the volume data over a specified period.
Central Limit Theorem (CLT) Mean Estimation: Implements CLT for estimating the mean of volume data. The CLT states that the distribution of sample means approximates a normal distribution as the sample size becomes larger.
Variance Point Estimation: Calculates the variance of volume data, providing insights into its variability and consistency over time.
Chi-Squared Test (Commented): Although not active in the initial release, the script includes a framework for a Chi-Squared Test to compare observed and expected volume frequencies, offering potential for future statistical comparisons.
Percentile Calculations and Convolution: Performs percentile calculations on volume data and employs convolution to these percentiles, enabling a more nuanced analysis of volume distribution.
Customizability: Users can input various parameters like anchor period, degrees of freedom, and smoothing preferences, making the tool adaptable to different analysis needs.
Visualization and Plotting: Features multiple plots for easy visualization of volume metrics, including stress, bell curves, point estimators, and smoothed data.
Theoretical Foundations:
This indicator is grounded in established statistical theories and methods, including the Central Limit Theorem, Chi-Squared Test (for future implementations), and convolution techniques. These foundations ensure that the indicator not only provides practical insights but also maintains a high standard of statistical rigor.
Intended Users:
This indicator is ideal for technical analysts, traders, and financial professionals who require a deep and statistically sound understanding of market volume behavior.
Release Notes:
This tool is designed a theoretical test of established statistical models and requires familiarity with Pine Script for customization. Future updates may include activation and expansion of the Chi-Squared Test functionality and additional statistical modules based on user feedback. It should be noted that it is advisable to use a logarithmic-inverted scale; when combined, these scales can provide a unique perspective that neither could offer alone. This combination might be particularly useful in highlighting exponential growth or decay trends, or in cases where the most significant data points are in the lower range of the dataset.
Notes of Stress Calculations:
The "stress metric" in the script is a custom-designed feature intended to measure the level of variability or volatility in the volume data over a given time period. This metric is calculated using a novel approach with concepts similar to those used in the field of engineering , particularly in stress analysis and finite element analysis (FEA).
Segmentation of Time Frame:
The script divides the given time frame (timeFrame) into smaller segments based on a specified number of units (units). This segmentation essentially breaks down the entire period into smaller, more manageable intervals for analysis. For each segment, the script calculates a 'stress' value. This involves iterating through each segment and performing calculations based on the source data (src), the default src is the volume data.
Calculation per Segment:
For each segment, the script identifies two points: the starting point (x1) and the ending point (x2). It then retrieves the corresponding values of the source data at these points (y1 and y2).
It calculates the difference in the x-axis (delta_x, the length of the segment) and the difference in the y-axis (delta_y, the change in volume over that segment).
Stress Calculation:
The script then calculates the 'stress' for each segment as the ratio of delta_y to delta_x. This ratio gives a measure of how much the volume has changed per unit of time within each segment. The stress values for each segment are then summed up to provide a cumulative measure of stress over the entire time frame.
The stress metric is essentially a measure of the volatility or variability in volume data. High stress values indicate larger changes in volume over shorter periods, suggesting more volatile market conditions. For traders and analysts, understanding the level of volatility is crucial. It can inform decision-making processes, risk management strategies, and provide insights into market sentiment. By comparing stress levels across different time frames or different securities, analysts can gain insights into relative market dynamics.
{Gunzo} Trend Sniper (Multiple MAs with coefficient)Updated GUNZO's Trend Sniper script by adding in different MA types to choose from. This can help reduce false signals and sharpen the trend reversal points.
Here's a summary of the key changes:
1. Multiple Moving Average Types: The original script was focused solely on the Weighted Moving Average (WMA) with a coefficient. The updated script introduces flexibility by allowing users to choose from a variety of Moving Average types, including WMA, VWMA (Volume Weighted Moving Average), EMA (Exponential Moving Average), SMA (Simple Moving Average), HullMA (Hull Moving Average), TEMA (Triple Exponential Moving Average), DEMA (Double Exponential Moving Average), T3, and RMA (Running Moving Average).
2. Coefficient Integration: In the original script, the coefficient was specifically designed for the WMA calculation. The updated script extends this concept to all the selected Moving Average types. This coefficient is applied differently depending on the type of MA, often affecting the length of the MA calculation.
3. Dynamic Length Calculation: For MAs that traditionally use an integer length (like SMA, EMA, etc.), the updated script calculates this length dynamically by multiplying the user-defined length by the coefficient and then rounding it to the nearest integer. This ensures compatibility with Pine Script's requirements for these functions.
All credits to GUNZO
original script:
The Flash-Strategy with Minervini Stage Analysis QualifierThe Flash-Strategy (Momentum-RSI, EMA-crossover, ATR) with Minervini Stage Analysis Qualifier
Introduction
Welcome to a comprehensive guide on a cutting-edge trading strategy I've developed, designed for the modern trader seeking an edge in today's dynamic markets. This strategy, which I've honed through my years of experience in the trading arena, stands out for its unique blend of technical analysis and market intuition, tailored specifically for use on the TradingView platform.
As a trader with a deep passion for the financial markets, my journey began several years ago, driven by a relentless pursuit of a trading methodology that is both effective and adaptable. My background in trading spans various market conditions and asset classes, providing me with a rich tapestry of experiences from which to draw. This strategy is the culmination of that journey, embodying the lessons learned and insights gained along the way.
The cornerstone of this strategy lies in its ability to generate precise long signals in a Stage 2 uptrend and equally accurate short signals in a Stage 4 downtrend. This approach is rooted in the principles of trend following and momentum trading, harnessing the power of key indicators such as the Momentum-RSI, EMA Crossover, and Average True Range (ATR). What sets this strategy apart is its meticulous design, which allows it to adapt to the ever-changing market conditions, providing traders with a robust tool for navigating both bullish and bearish scenarios.
This strategy was born out of a desire to create a trading system that is not only highly effective in identifying potential trade setups but also straightforward enough to be implemented by traders of varying skill levels. It's a reflection of my belief that successful trading hinges on clarity, precision, and disciplined execution. Whether you are a seasoned trader or just beginning your journey, this guide aims to provide you with a comprehensive understanding of how to harness the full potential of this strategy in your trading endeavors.
In the following sections, we will delve deeper into the mechanics of the strategy, its implementation, and how to make the most out of its features. Join me as we explore the nuances of a strategy that is designed to elevate your trading to the next level.
Stage-Specific Signal Generation
A distinctive feature of this trading strategy is its focus on generating long signals exclusively during Stage 2 uptrends and short signals during Stage 4 downtrends. This approach is based on the widely recognized market cycle theory, which divides the market into four stages: Stage 1 (accumulation), Stage 2 (uptrend), Stage 3 (distribution), and Stage 4 (downtrend). By aligning the signal generation with these specific stages, the strategy aims to capitalize on the most dynamic and clear-cut market movements, thereby enhancing the potential for profitable trades.
1. Long Signals in Stage 2 Uptrends
• Characteristics of Stage 2: Stage 2 is characterized by a strong uptrend, where prices are consistently rising. This stage typically follows a period of accumulation (Stage 1) and is marked by increased investor interest and bullish sentiment in the market.
• Criteria for Long Signal Generation: Long signals are generated during this stage when the technical indicators align with the characteristics of a Stage 2 uptrend.
• Rationale for Stage-Specific Signals: By focusing on Stage 2 for long trades, the strategy seeks to enter positions during the phase of strong upward momentum, thus riding the wave of rising prices and investor optimism. This stage-specific approach minimizes exposure to less predictable market phases, like the consolidation in Stage 1 or the indecision in Stage 3.
2. Short Signals in Stage 4 Downtrends
• Characteristics of Stage 4: Stage 4 is identified by a pronounced downtrend, with declining prices indicating prevailing bearish sentiment. This stage typically follows the distribution phase (Stage 3) and is characterized by increasing selling pressure.
• Criteria for Short Signal Generation: Short signals are generated in this stage when the indicators reflect a strong bearish trend.
• Rationale for Stage-Specific Signals: Targeting Stage 4 for shorting capitalizes on the market's downward momentum. This tactic aligns with the natural market cycle, allowing traders to exploit the downward price movements effectively. By doing so, the strategy avoids the potential pitfalls of shorting during the early or late stages of the market cycle, where trends are less defined and more susceptible to reversals.
In conclusion, the strategy’s emphasis on stage-specific signal generation is a testament to its sophisticated understanding of market dynamics. By tailoring the long and short signals to Stages 2 and 4, respectively, it leverages the most compelling phases of the market cycle, offering traders a clear and structured approach to aligning their trades with dominant market trends.
Strategy Overview
At the heart of this trading strategy is a philosophy centered around capturing market momentum and trend efficiency. The core objective is to identify and capitalize on clear uptrends and downtrends, thereby allowing traders to position themselves in sync with the market's prevailing direction. This approach is grounded in the belief that aligning trades with these dominant market forces can lead to more consistent and profitable outcomes.
The strategy is built on three foundational components, each playing a critical role in the decision-making process:
1. Momentum-RSI (Relative Strength Index): The Momentum-RSI is a pivotal element of this strategy. It's an enhanced version of the traditional RSI, fine-tuned to better capture the strength and velocity of market trends. By measuring the speed and change of price movements, the Momentum-RSI provides invaluable insights into whether a market is potentially overbought or oversold, suggesting possible entry and exit points. This indicator is especially effective in filtering out noise and focusing on substantial market moves.
2. EMA (Exponential Moving Average) Crossover: The EMA Crossover is a crucial component for trend identification. This strategy employs two EMAs with different timeframes to determine the market trend. When the shorter-term EMA crosses above the longer-term EMA, it signals an emerging uptrend, suggesting a potential long entry. Conversely, a crossover below indicates a possible downtrend, hinting at a short entry opportunity. This simple yet powerful tool is key in confirming trend directions and timing market entries.
3. ATR (Average True Range): The ATR is instrumental in assessing market volatility. This indicator helps in understanding the average range of price movements over a given period, thus providing a sense of how much a market might move on a typical day. In this strategy, the ATR is used to adjust stop-loss levels and to gauge the potential risk and reward of trades. It allows for more informed decisions by aligning trade management techniques with the current volatility conditions.
The synergy of these three components – the Momentum-RSI, EMA Crossover, and ATR – creates a robust framework for this trading strategy. By combining momentum analysis, trend identification, and volatility assessment, the strategy offers a comprehensive approach to navigating the markets. Whether it's capturing a strong trend in its early stages or identifying a potential reversal, this strategy aims to provide traders with the tools and insights needed to make well-informed, strategically sound trading decisions.
Detailed Component Analysis
The efficacy of this trading strategy hinges on the synergistic functioning of its three key components: the Momentum-RSI, EMA Crossover, and Average True Range (ATR). Each component brings a unique perspective to the strategy, contributing to a well-rounded approach to market analysis.
1. Momentum-RSI (Relative Strength Index)
• Definition and Function: The Momentum-RSI is a modified version of the classic Relative Strength Index. While the traditional RSI measures the velocity and magnitude of directional price movements, the Momentum-RSI amplifies aspects that reflect trend strength and momentum.
• Significance in Identifying Trend Strength: This indicator excels in identifying the strength behind a market's move. A high Momentum-RSI value typically indicates strong bullish momentum, suggesting the potential continuation of an uptrend. Conversely, a low Momentum-RSI value signals strong bearish momentum, possibly indicative of an ongoing downtrend.
• Application in Strategy: In this strategy, the Momentum-RSI is used to gauge the underlying strength of market trends. It helps in filtering out minor fluctuations and focusing on significant movements, providing a clearer picture of the market's true momentum.
2. EMA (Exponential Moving Average) Crossover
• Definition and Function: The EMA Crossover component utilizes two exponential moving averages of different timeframes. Unlike simple moving averages, EMAs give more weight to recent prices, making them more responsive to new information.
• Contribution to Market Direction: The interaction between the short-term and long-term EMAs is key to determining market direction. A crossover of the shorter EMA above the longer EMA is an indicator of an emerging uptrend, while a crossover below signals a developing downtrend.
• Application in Strategy: The EMA Crossover serves as a trend confirmation tool. It provides a clear, visual representation of the market's direction, aiding in the decision-making process for entering long or short positions. This component ensures that trades are aligned with the prevailing market trend, a crucial factor for the success of the strategy.
3. ATR (Average True Range)
• Definition and Function: The ATR is an indicator that measures market volatility by calculating the average range between the high and low prices over a specified period.
• Role in Assessing Market Volatility: The ATR provides insights into the typical market movement within a given timeframe, offering a measure of the market's volatility. Higher ATR values indicate increased volatility, while lower values suggest a calmer market environment.
• Application in Strategy: Within this strategy, the ATR is instrumental in tailoring risk management techniques, particularly in setting stop-loss levels. By accounting for the market's volatility, the ATR ensures that stop-loss orders are placed at levels that are neither too tight (risking premature exits) nor too loose (exposing to excessive risk).
In summary, the combination of Momentum-RSI, EMA Crossover, and ATR in this trading strategy provides a comprehensive toolkit for market analysis. The Momentum-RSI identifies the strength of market trends, the EMA Crossover confirms the market direction, and the ATR guides in risk management by assessing volatility. Together, these components form the backbone of a strategy designed to navigate the complexities of the financial markets effectively.
1. Signal Generation Process
• Combining Indicators: The strategy operates by synthesizing signals from the Momentum-RSI, EMA Crossover, and ATR indicators. Each indicator serves a specific purpose: the Momentum-RSI gauges trend momentum, the EMA Crossover identifies the trend direction, and the ATR assesses the market’s volatility.
• Criteria for Signal Validation: For a signal to be considered valid, it must meet specific criteria set by each of the three indicators. This multi-layered approach ensures that signals are not only based on one aspect of market behavior but are a result of a comprehensive analysis.
2. Conditions for Long Positions
• Uptrend Confirmation: A long position signal is generated when the shorter-term EMA crosses above the longer-term EMA, indicating an uptrend.
• Momentum-RSI Alignment: Alongside the EMA crossover, the Momentum-RSI should indicate strong bullish momentum. This is typically represented by the Momentum-RSI being at a high level, confirming the strength of the uptrend.
• ATR Consideration: The ATR is used to fine-tune the entry point and set an appropriate stop-loss level. In a low volatility scenario, as indicated by the ATR, the stop-loss can be set tighter, closer to the entry point.
3. Conditions for Short Positions
• Downtrend Confirmation: Conversely, a short position signal is indicated when the shorter-term EMA crosses below the longer-term EMA, signaling a downtrend.
• Momentum-RSI Confirmation: The Momentum-RSI should reflect strong bearish momentum, usually seen when the Momentum-RSI is at a low level. This confirms the bearish strength of the market.
• ATR Application: The ATR again plays a role in determining the stop-loss level for the short position. Higher volatility, as indicated by a higher ATR, would warrant a wider stop-loss to accommodate larger market swings.
By adhering to these mechanics, the strategy aims to ensure that each trade is entered with a high probability of success, aligning with the market’s current momentum and trend. The integration of these indicators allows for a holistic market analysis, providing traders with clear and actionable signals for both entering and exiting trades.
Customizable Parameters in the Strategy
Flexibility and adaptability are key features of this trading strategy, achieved through a range of customizable parameters. These parameters allow traders to tailor the strategy to their individual trading style, risk tolerance, and specific market conditions. By adjusting these parameters, users can fine-tune the strategy to optimize its performance and align it with their unique trading objectives. Below are the primary parameters that can be customized within the strategy:
1. Momentum-RSI Settings
• Period: The lookback period for the Momentum-RSI can be adjusted. A shorter period makes the indicator more sensitive to recent price changes, while a longer period smoothens the RSI line, offering a broader view of the momentum.
• Overbought/Oversold Thresholds: Users can set their own overbought and oversold levels, which can help in identifying extreme market conditions more precisely according to their trading approach.
2. EMA Crossover Settings
• Timeframes for EMAs: The strategy uses two EMAs with different timeframes. Traders can modify these timeframes, choosing shorter periods for a more responsive approach or longer periods for a more conservative one.
• Source Data: The choice of price data (close, open, high, low) used in calculating the EMAs can be varied depending on the trader’s preference.
3. ATR Settings
• Lookback Period: Adjusting the lookback period for the ATR impacts how the indicator measures volatility. A longer period may provide a more stable but less responsive measure, while a shorter period offers quicker but potentially more erratic readings.
• Multiplier for Stop-Loss Calculation: This parameter allows traders to set how aggressively or conservatively they want their stop-loss to be in relation to the ATR value.
Here are the standard settings:

Choose Symbol, Mode with Hull,Stochatic Mom,EMA,MACD,RSI,TableThis Pine Script code is a comprehensive indicator for the TradingView platform, offering a variety of technical analysis tools. Below is an English introduction to its features and purposes:
Introduction:
This indicator is designed for traders on TradingView and provides a multi-functional analysis toolset. It includes different charting modes (Heikin-Ashi, Linear, and Normal), a Hull Moving Average (Hull), Stochastic Momentum, RSI (Relative Strength Index), MACD (Moving Average Convergence Divergence), EMA (Exponential Moving Average), Bollinger Bands, and a summary table displaying key metrics.
Key Features:
Charting Modes:
Users can choose between "Heikin-Ashi," "Linear," or "Normal" modes to visualize price data in different ways.
Hull Moving Average:
The script incorporates the Hull Moving Average for trend analysis, highlighting potential buy and sell signals.
Stochastic Momentum:
Stochastic Momentum, with customizable parameters (K, D, and Smooth), is included to identify overbought and oversold conditions.
RSI (Relative Strength Index):
RSI is calculated and displayed, aiding in identifying potential trend reversals or exhaustion points.
MACD (Moving Average Convergence Divergence):
The MACD indicator is included, along with a histogram, to highlight changes in momentum and potential crossovers.
RSI Momentum:
RSI Momentum is calculated, providing additional insights into momentum changes.
Exponential Moving Averages (EMA):
The script calculates and displays three EMAs (Exponential Moving Averages) with customizable periods.
Bollinger Bands:
Bollinger Bands are incorporated, offering insights into volatility and potential price reversals.
Summary Table:
A table is displayed on the chart summarizing key metrics, including Stochastic MoM, RSI, MACD, RSI EMA, Hull percentage change, and EMA values.
Customization:
Users have the option to customize various parameters, including chart modes, lengths of moving averages, Stochastic parameters, and more.
Usage:
The indicator aims to provide a comprehensive view of price action and potential trend changes. Traders can use it for technical analysis and decision-making.
Important Note:
This script is provided for educational purposes and does not constitute financial advice. Traders and investors should conduct their research and analysis before making any trading decisions.

Supertrend Advance Pullback StrategyHandbook for the Supertrend Advance Strategy
1. Introduction
Purpose of the Handbook:
The main purpose of this handbook is to serve as a comprehensive guide for traders and investors who are looking to explore and harness the potential of the Supertrend Advance Strategy. In the rapidly changing financial market, having the right tools and strategies at one's disposal is crucial. Whether you're a beginner hoping to dive into the world of trading or a seasoned investor aiming to optimize and diversify your portfolio, this handbook offers the insights and methodologies you need. By the end of this guide, readers should have a clear understanding of how the Supertrend Advance Strategy works, its benefits, potential pitfalls, and practical application in various trading scenarios.
Overview of the Supertrend Advance Pullback Strategy:
At its core, the Supertrend Advance Strategy is an evolution of the popular Supertrend Indicator. Designed to generate buy and sell signals in trending markets, the Supertrend Indicator has been a favorite tool for many traders around the world. The Advance Strategy, however, builds upon this foundation by introducing enhanced mechanisms, filters, and methodologies to increase precision and reduce false signals.
1. Basic Concept:
The Supertrend Advance Strategy relies on a combination of price action and volatility to determine the potential trend direction. By assessing the average true range (ATR) in conjunction with specific price points, this strategy aims to highlight the potential starting and ending points of market trends.
2. Methodology:
Unlike the traditional Supertrend Indicator, which primarily focuses on closing prices and ATR, the Advance Strategy integrates other critical market variables, such as volume, momentum oscillators, and perhaps even fundamental data, to validate its signals. This multidimensional approach ensures that the generated signals are more reliable and are less prone to market noise.
3. Benefits:
One of the main benefits of the Supertrend Advance Strategy is its ability to filter out false breakouts and minor price fluctuations, which can often lead to premature exits or entries in the market. By waiting for a confluence of factors to align, traders using this advanced strategy can increase their chances of entering or exiting trades at optimal points.
4. Practical Applications:
The Supertrend Advance Strategy can be applied across various timeframes, from intraday trading to swing trading and even long-term investment scenarios. Furthermore, its flexible nature allows it to be tailored to different asset classes, be it stocks, commodities, forex, or cryptocurrencies.
In the subsequent sections of this handbook, we will delve deeper into the intricacies of this strategy, offering step-by-step guidelines on its application, case studies, and tips for maximizing its efficacy in the volatile world of trading.
As you journey through this handbook, we encourage you to approach the Supertrend Advance Strategy with an open mind, testing and tweaking it as per your personal trading style and risk appetite. The ultimate goal is not just to provide you with a new tool but to empower you with a holistic strategy that can enhance your trading endeavors.
2. Getting Started
Navigating the financial markets can be a daunting task without the right tools. This section is dedicated to helping you set up the Supertrend Advance Strategy on one of the most popular charting platforms, TradingView. By following the steps below, you'll be able to integrate this strategy into your charts and start leveraging its insights in no time.
Setting up on TradingView:
TradingView is a web-based platform that offers a wide range of charting tools, social networking, and market data. Before you can apply the Supertrend Advance Strategy, you'll first need a TradingView account. If you haven't set one up yet, here's how:
1. Account Creation:
• Visit TradingView's official website.
• Click on the "Join for free" or "Sign up" button.
• Follow the registration process, providing the necessary details and setting up your login credentials.
2. Navigating the Dashboard:
• Once logged in, you'll be taken to your dashboard. Here, you'll see a variety of tools, including watchlists, alerts, and the main charting window.
• To begin charting, type in the name or ticker of the asset you're interested in the search bar at the top.
3. Configuring Chart Settings:
• Before integrating the Supertrend Advance Strategy, familiarize yourself with the chart settings. This can be accessed by clicking the 'gear' icon on the top right of the chart window.
• Adjust the chart type, time intervals, and other display settings to your preference.
Integrating the Strategy into a Chart:
Now that you're set up on TradingView, it's time to integrate the Supertrend Advance Strategy.
1. Accessing the Pine Script Editor:
• Located at the top-center of your screen, you'll find the "Pine Editor" tab. Click on it.
• This is where custom strategies and indicators are scripted or imported.
2. Loading the Supertrend Advance Strategy Script:
• Depending on whether you have the script or need to find it, there are two paths:
• If you have the script: Copy the Supertrend Advance Strategy script, and then paste it into the Pine Editor.
• If searching for the script: Click on the “Indicators” icon (looks like a flame) at the top of your screen, and then type “Supertrend Advance Strategy” in the search bar. If available, it will show up in the list. Simply click to add it to your chart.
3. Applying the Strategy:
• After pasting or selecting the Supertrend Advance Strategy in the Pine Editor, click on the “Add to Chart” button located at the top of the editor. This will overlay the strategy onto your main chart window.
4. Configuring Strategy Settings:
• Once the strategy is on your chart, you'll notice a small settings ('gear') icon next to its name in the top-left of the chart window. Click on this to access settings.
• Here, you can adjust various parameters of the Supertrend Advance Strategy to better fit your trading style or the specific asset you're analyzing.
5. Interpreting Signals:
• With the strategy applied, you'll now see buy/sell signals represented on your chart. Take time to familiarize yourself with how these look and behave over various timeframes and market conditions.
3. Strategy Overview
What is the Supertrend Advance Strategy?
The Supertrend Advance Strategy is a refined version of the classic Supertrend Indicator, which was developed to aid traders in spotting market trends. The strategy utilizes a combination of data points, including average true range (ATR) and price momentum, to generate buy and sell signals.
In essence, the Supertrend Advance Strategy can be visualized as a line that moves with the price. When the price is above the Supertrend line, it indicates an uptrend and suggests a potential buy position. Conversely, when the price is below the Supertrend line, it hints at a downtrend, suggesting a potential selling point.
Strategy Goals and Objectives:
1. Trend Identification: At the core of the Supertrend Advance Strategy is the goal to efficiently and consistently identify prevailing market trends. By recognizing these trends, traders can position themselves to capitalize on price movements in their favor.
2. Reducing Noise: Financial markets are often inundated with 'noise' - short-term price fluctuations that can mislead traders. The Supertrend Advance Strategy aims to filter out this noise, allowing for clearer decision-making.
3. Enhancing Risk Management: With clear buy and sell signals, traders can set more precise stop-loss and take-profit points. This leads to better risk management and potentially improved profitability.
4. Versatility: While primarily used for trend identification, the strategy can be integrated with other technical tools and indicators to create a comprehensive trading system.
Type of Assets/Markets to Apply the Strategy:
1. Equities: The Supertrend Advance Strategy is highly popular among stock traders. Its ability to capture long-term trends makes it particularly useful for those trading individual stocks or equity indices.
2. Forex: Given the 24-hour nature of the Forex market and its propensity for trends, the Supertrend Advance Strategy is a valuable tool for currency traders.
3. Commodities: Whether it's gold, oil, or agricultural products, commodities often move in extended trends. The strategy can help in identifying and capitalizing on these movements.
4. Cryptocurrencies: The volatile nature of cryptocurrencies means they can have pronounced trends. The Supertrend Advance Strategy can aid crypto traders in navigating these often tumultuous waters.
5. Futures & Options: Traders and investors in derivative markets can utilize the strategy to make more informed decisions about contract entries and exits.
It's important to note that while the Supertrend Advance Strategy can be applied across various assets and markets, its effectiveness might vary based on market conditions, timeframe, and the specific characteristics of the asset in question. As always, it's recommended to use the strategy in conjunction with other analytical tools and to backtest its effectiveness in specific scenarios before committing to trades.
4. Input Settings
Understanding and correctly configuring input settings is crucial for optimizing the Supertrend Advance Strategy for any specific market or asset. These settings, when tweaked correctly, can drastically impact the strategy's performance.
Grouping Inputs:
Before diving into individual input settings, it's important to group similar inputs. Grouping can simplify the user interface, making it easier to adjust settings related to a specific function or indicator.
Strategy Choice:
This input allows traders to select from various strategies that incorporate the Supertrend indicator. Options might include "Supertrend with RSI," "Supertrend with MACD," etc. By choosing a strategy, the associated input settings for that strategy become available.
Supertrend Settings:
1. Multiplier: Typically, a default value of 3 is used. This multiplier is used in the ATR calculation. Increasing it makes the Supertrend line further from prices, while decreasing it brings the line closer.
2. Period: The number of bars used in the ATR calculation. A common default is 7.
EMA Settings (Exponential Moving Average):
1. Period: Defines the number of previous bars used to calculate the EMA. Common periods are 9, 21, 50, and 200.
2. Source: Allows traders to choose which price (Open, Close, High, Low) to use in the EMA calculation.
RSI Settings (Relative Strength Index):
1. Length: Determines how many periods are used for RSI calculation. The standard setting is 14.
2. Overbought Level: The threshold at which the asset is considered overbought, typically set at 70.
3. Oversold Level: The threshold at which the asset is considered oversold, often at 30.
MACD Settings (Moving Average Convergence Divergence):
1. Short Period: The shorter EMA, usually set to 12.
2. Long Period: The longer EMA, commonly set to 26.
3. Signal Period: Defines the EMA of the MACD line, typically set at 9.
CCI Settings (Commodity Channel Index):
1. Period: The number of bars used in the CCI calculation, often set to 20.
2. Overbought Level: Typically set at +100, denoting overbought conditions.
3. Oversold Level: Usually set at -100, indicating oversold conditions.
SL/TP Settings (Stop Loss/Take Profit):
1. SL Multiplier: Defines the multiplier for the average true range (ATR) to set the stop loss.
2. TP Multiplier: Defines the multiplier for the average true range (ATR) to set the take profit.
Filtering Conditions:
This section allows traders to set conditions to filter out certain signals. For example, one might only want to take buy signals when the RSI is below 30, ensuring they buy during oversold conditions.
Trade Direction and Backtest Period:
1. Trade Direction: Allows traders to specify whether they want to take long trades, short trades, or both.
2. Backtest Period: Specifies the time range for backtesting the strategy. Traders can choose from options like 'Last 6 months,' 'Last 1 year,' etc.
It's essential to remember that while default settings are provided for many of these tools, optimal settings can vary based on the market, timeframe, and trading style. Always backtest new settings on historical data to gauge their potential efficacy.
5. Understanding Strategy Conditions
Developing an understanding of the conditions set within a trading strategy is essential for traders to maximize its potential. Here, we delve deep into the logic behind these conditions, using the Supertrend Advance Strategy as our focal point.
Basic Logic Behind Conditions:
Every strategy is built around a set of conditions that provide buy or sell signals. The conditions are based on mathematical or statistical methods and are rooted in the study of historical price data. The fundamental idea is to recognize patterns or behaviors that have been profitable in the past and might be profitable in the future.
Buy and Sell Conditions:
1. Buy Conditions: Usually formulated around bullish signals or indicators suggesting upward price momentum.
2. Sell Conditions: Centered on bearish signals or indicators indicating downward price momentum.
Simple Strategy:
The simple strategy could involve using just the Supertrend indicator. Here:
• Buy: When price closes above the Supertrend line.
• Sell: When price closes below the Supertrend line.
Pullback Strategy:
This strategy capitalizes on price retracements:
• Buy: When the price retraces to the Supertrend line after a bullish signal and is supported by another bullish indicator.
• Sell: When the price retraces to the Supertrend line after a bearish signal and is confirmed by another bearish indicator.
Indicators Used:
EMA (Exponential Moving Average):
• Logic: EMA gives more weight to recent prices, making it more responsive to current price movements. A shorter-period EMA crossing above a longer-period EMA can be a bullish sign, while the opposite is bearish.
RSI (Relative Strength Index):
• Logic: RSI measures the magnitude of recent price changes to analyze overbought or oversold conditions. Values above 70 are typically considered overbought, and values below 30 are considered oversold.
MACD (Moving Average Convergence Divergence):
• Logic: MACD assesses the relationship between two EMAs of a security’s price. The MACD line crossing above the signal line can be a bullish signal, while crossing below can be bearish.
CCI (Commodity Channel Index):
• Logic: CCI compares a security's average price change with its average price variation. A CCI value above +100 may mean the price is overbought, while below -100 might signify an oversold condition.
And others...
As the strategy expands or contracts, more indicators might be added or removed. The crucial point is to understand the core logic behind each, ensuring they align with the strategy's objectives.
Logic Behind Each Indicator:
1. EMA: Emphasizes recent price movements; provides dynamic support and resistance levels.
2. RSI: Indicates overbought and oversold conditions based on recent price changes.
3. MACD: Showcases momentum and direction of a trend by comparing two EMAs.
4. CCI: Measures the difference between a security's price change and its average price change.
Understanding strategy conditions is not just about knowing when to buy or sell but also about comprehending the underlying market dynamics that those conditions represent. As you familiarize yourself with each condition and indicator, you'll be better prepared to adapt and evolve with the ever-changing financial markets.
6. Trade Execution and Management
Trade execution and management are crucial aspects of any trading strategy. Efficient execution can significantly impact profitability, while effective management can preserve capital during adverse market conditions. In this section, we'll explore the nuances of position entry, exit strategies, and various Stop Loss (SL) and Take Profit (TP) methodologies within the Supertrend Advance Strategy.
Position Entry:
Effective trade entry revolves around:
1. Timing: Enter at a point where the risk-reward ratio is favorable. This often corresponds to confirmatory signals from multiple indicators.
2. Volume Analysis: Ensure there's adequate volume to support the movement. Volume can validate the strength of a signal.
3. Confirmation: Use multiple indicators or chart patterns to confirm the entry point. For instance, a buy signal from the Supertrend indicator can be confirmed with a bullish MACD crossover.
Position Exit Strategies:
A successful exit strategy will lock in profits and minimize losses. Here are some strategies:
1. Fixed Time Exit: Exiting after a predetermined period.
2. Percentage-based Profit Target: Exiting after a certain percentage gain.
3. Indicator-based Exit: Exiting when an indicator gives an opposing signal.
Percentage-based SL/TP:
• Stop Loss (SL): Set a fixed percentage below the entry price to limit potential losses.
• Example: A 2% SL on an entry at $100 would trigger a sell at $98.
• Take Profit (TP): Set a fixed percentage above the entry price to lock in gains.
• Example: A 5% TP on an entry at $100 would trigger a sell at $105.
Supertrend-based SL/TP:
• Stop Loss (SL): Position the SL at the Supertrend line. If the price breaches this line, it could indicate a trend reversal.
• Take Profit (TP): One could set the TP at a point where the Supertrend line flattens or turns, indicating a possible slowdown in momentum.
Swing high/low-based SL/TP:
• Stop Loss (SL): For a long position, set the SL just below the recent swing low. For a short position, set it just above the recent swing high.
• Take Profit (TP): For a long position, set the TP near a recent swing high or resistance. For a short position, near a swing low or support.
And other methods...
1. Trailing Stop Loss: This dynamic SL adjusts with the price movement, locking in profits as the trade moves in your favor.
2. Multiple Take Profits: Divide the position into segments and set multiple TP levels, securing profits in stages.
3. Opposite Signal Exit: Exit when another reliable indicator gives an opposite signal.
Trade execution and management are as much an art as they are a science. They require a blend of analytical skill, discipline, and intuition. Regularly reviewing and refining your strategies, especially in light of changing market conditions, is crucial to maintaining consistent trading performance.
7. Visual Representations
Visual tools are essential for traders, as they simplify complex data into an easily interpretable format. Properly analyzing and understanding the plots on a chart can provide actionable insights and a more intuitive grasp of market conditions. In this section, we’ll delve into various visual representations used in the Supertrend Advance Strategy and their significance.
Understanding Plots on the Chart:
Charts are the primary visual aids for traders. The arrangement of data points, lines, and colors on them tell a story about the market's past, present, and potential future moves.
1. Data Points: These represent individual price actions over a specific timeframe. For instance, a daily chart will have data points showing the opening, closing, high, and low prices for each day.
2. Colors: Used to indicate the nature of price movement. Commonly, green is used for bullish (upward) moves and red for bearish (downward) moves.
Trend Lines:
Trend lines are straight lines drawn on a chart that connect a series of price points. Their significance:
1. Uptrend Line: Drawn along the lows, representing support. A break below might indicate a trend reversal.
2. Downtrend Line: Drawn along the highs, indicating resistance. A break above might suggest the start of a bullish trend.
Filled Areas:
These represent a range between two values on a chart, usually shaded or colored. For instance:
1. Bollinger Bands: The area between the upper and lower band is filled, giving a visual representation of volatility.
2. Volume Profile: Can show a filled area representing the amount of trading activity at different price levels.
Stop Loss and Take Profit Lines:
These are horizontal lines representing pre-determined exit points for trades.
1. Stop Loss Line: Indicates the level at which a trade will be automatically closed to limit losses. Positioned according to the trader's risk tolerance.
2. Take Profit Line: Denotes the target level to lock in profits. Set according to potential resistance (for long trades) or support (for short trades) or other technical factors.
Trailing Stop Lines:
A trailing stop is a dynamic form of stop loss that moves with the price. On a chart:
1. For Long Trades: Starts below the entry price and moves up with the price but remains static if the price falls, ensuring profits are locked in.
2. For Short Trades: Starts above the entry price and moves down with the price but remains static if the price rises.
Visual representations offer traders a clear, organized view of market dynamics. Familiarity with these tools ensures that traders can quickly and accurately interpret chart data, leading to more informed decision-making. Always ensure that the visual aids used resonate with your trading style and strategy for the best results.
8. Backtesting
Backtesting is a fundamental process in strategy development, enabling traders to evaluate the efficacy of their strategy using historical data. It provides a snapshot of how the strategy would have performed in past market conditions, offering insights into its potential strengths and vulnerabilities. In this section, we'll explore the intricacies of setting up and analyzing backtest results and the caveats one must be aware of.
Setting Up Backtest Period:
1. Duration: Determine the timeframe for the backtest. It should be long enough to capture various market conditions (bullish, bearish, sideways). For instance, if you're testing a daily strategy, consider a period of several years.
2. Data Quality: Ensure the data source is reliable, offering high-resolution and clean data. This is vital to get accurate backtest results.
3. Segmentation: Instead of a continuous period, sometimes it's helpful to backtest over distinct market phases, like a particular bear or bull market, to see how the strategy holds up in different environments.
Analyzing Backtest Results:
1. Performance Metrics: Examine metrics like the total return, annualized return, maximum drawdown, Sharpe ratio, and others to gauge the strategy's efficiency.
2. Win Rate: It's the ratio of winning trades to total trades. A high win rate doesn't always signify a good strategy; it should be evaluated in conjunction with other metrics.
3. Risk/Reward: Understand the average profit versus the average loss per trade. A strategy might have a low win rate but still be profitable if the average gain far exceeds the average loss.
4. Drawdown Analysis: Review the periods of losses the strategy could incur and how long it takes, on average, to recover.
9. Tips and Best Practices
Successful trading requires more than just knowing how a strategy works. It necessitates an understanding of when to apply it, how to adjust it to varying market conditions, and the wisdom to recognize and avoid common pitfalls. This section offers insightful tips and best practices to enhance the application of the Supertrend Advance Strategy.
When to Use the Strategy:
1. Market Conditions: Ideally, employ the Supertrend Advance Strategy during trending market conditions. This strategy thrives when there are clear upward or downward trends. It might be less effective during consolidative or sideways markets.
2. News Events: Be cautious around significant news events, as they can cause extreme volatility. It might be wise to avoid trading immediately before and after high-impact news.
3. Liquidity: Ensure you are trading in assets/markets with sufficient liquidity. High liquidity ensures that the price movements are more reflective of genuine market sentiment and not due to thin volume.
Adjusting Settings for Different Markets/Timeframes:
1. Markets: Each market (stocks, forex, commodities) has its own characteristics. It's essential to adjust the strategy's parameters to align with the market's volatility and liquidity.
2. Timeframes: Shorter timeframes (like 1-minute or 5-minute charts) tend to have more noise. You might need to adjust the settings to filter out false signals. Conversely, for longer timeframes (like daily or weekly charts), you might need to be more responsive to genuine trend changes.
3. Customization: Regularly review and tweak the strategy's settings. Periodic adjustments can ensure the strategy remains optimized for the current market conditions.
10. Frequently Asked Questions (FAQs)
Given the complexities and nuances of the Supertrend Advance Strategy, it's only natural for traders, both new and seasoned, to have questions. This section addresses some of the most commonly asked questions regarding the strategy.
1. What exactly is the Supertrend Advance Strategy?
The Supertrend Advance Strategy is an evolved version of the traditional Supertrend indicator. It's designed to provide clearer buy and sell signals by incorporating additional indicators like EMA, RSI, MACD, CCI, etc. The strategy aims to capitalize on market trends while minimizing false signals.
2. Can I use the Supertrend Advance Strategy for all asset types?
Yes, the strategy can be applied to various asset types like stocks, forex, commodities, and cryptocurrencies. However, it's crucial to adjust the settings accordingly to suit the specific characteristics and volatility of each asset type.
3. Is this strategy suitable for day trading?
Absolutely! The Supertrend Advance Strategy can be adjusted to suit various timeframes, making it versatile for both day trading and long-term trading. Remember to fine-tune the settings to align with the timeframe you're trading on.
4. How do I deal with false signals?
No strategy is immune to false signals. However, by combining the Supertrend with other indicators and adhering to strict risk management protocols, you can minimize the impact of false signals. Always use stop-loss orders and consider filtering trades with additional confirmation signals.
5. Do I need any prior trading experience to use this strategy?
While the Supertrend Advance Strategy is designed to be user-friendly, having a foundational understanding of trading and market analysis can greatly enhance your ability to employ the strategy effectively. If you're a beginner, consider pairing the strategy with further education and practice on demo accounts.
6. How often should I review and adjust the strategy settings?
There's no one-size-fits-all answer. Some traders adjust settings weekly, while others might do it monthly. The key is to remain responsive to changing market conditions. Regular backtesting can give insights into potential required adjustments.
7. Can the Supertrend Advance Strategy be automated?
Yes, many traders use algorithmic trading platforms to automate their strategies, including the Supertrend Advance Strategy. However, always monitor automated systems regularly to ensure they're operating as intended.
8. Are there any markets or conditions where the strategy shouldn't be used?
The strategy might generate more false signals in markets that are consolidative or range-bound. During significant news events or times of unexpected high volatility, it's advisable to tread with caution or stay out of the market.
9. How important is backtesting with this strategy?
Backtesting is crucial as it allows traders to understand how the strategy would have performed in the past, offering insights into potential profitability and areas of improvement. Always backtest any new setting or tweak before applying it to live trades.
10. What if the strategy isn't working for me?
No strategy guarantees consistent profits. If it's not working for you, consider reviewing your settings, seeking expert advice, or complementing the Supertrend Advance Strategy with other analysis methods. Remember, continuous learning and adaptation are the keys to trading success.
Other comments
Value of combining several indicators in this script and how they work together
Diversification of Signals: Just as diversifying an investment portfolio can reduce risk, using multiple indicators can offer varied perspectives on potential price movements. Each indicator can capture a different facet of the market, ensuring that traders are not overly reliant on a single data point.
Confirmation & Reduced False Signals: A common challenge with many indicators is the potential for false signals. By requiring confirmation from multiple indicators before acting, the chances of acting on a false signal can be significantly reduced.
Flexibility Across Market Conditions: Different indicators might perform better under different market conditions. For example, while moving averages might excel in trending markets, oscillators like RSI might be more useful during sideways or range-bound conditions. A mashup strategy can potentially adapt better to varying market scenarios.
Comprehensive Analysis: With multiple indicators, traders can gauge trend strength, momentum, volatility, and potential market reversals all at once, providing a holistic view of the market.
How do the different indicators in the Supertrend Advance Strategy work together?
Supertrend: This is primarily a trend-following indicator. It provides traders with buy and sell signals based on the volatility of the price. When combined with other indicators, it can filter out noise and give more weight to strong, confirmed trends.
EMA (Exponential Moving Average): EMA gives more weight to recent price data. It can be used to identify the direction and strength of a trend. When the price is above the EMA, it's generally considered bullish, and vice versa.
RSI (Relative Strength Index): An oscillator that measures the magnitude of recent price changes to evaluate overbought or oversold conditions. By cross-referencing with other indicators like EMA or MACD, traders can spot potential reversals or confirmations of a trend.
MACD (Moving Average Convergence Divergence): This indicator identifies changes in the strength, direction, momentum, and duration of a trend in a stock's price. When the MACD line crosses above the signal line, it can be a bullish sign, and when it crosses below, it can be bearish. Pairing MACD with Supertrend can provide dual confirmation of a trend.
CCI (Commodity Channel Index): Initially developed for commodities, CCI can indicate overbought or oversold conditions. It can be used in conjunction with other indicators to determine entry and exit points.
In essence, the synergy of these indicators provides a balanced, comprehensive approach to trading. Each indicator offers its unique lens into market conditions, and when they align, it can be a powerful indication of a trading opportunity. This combination not only reduces the potential drawbacks of each individual indicator but leverages their strengths, aiming for more consistent and informed trading decisions.
Backtesting and Default Settings
• This indicator has been optimized to be applied for 1 hour-charts. However, the underlying principles of this strategy are supply and demand in the financial markets and the strategy can be applied to all timeframes. Daytraders can use the 1min- or 5min charts, swing-traders can use the daily charts.
• This strategy has been designed to identify the most promising, highest probability entries and trades for each stock or other financial security.
• The combination of the qualifiers results in a highly selective strategy which only considers the most promising swing-trading entries. As a result, you will normally only find a low number of trades for each stock or other financial security per year in case you apply this strategy for the daily charts. Shorter timeframes will result in a higher number of trades / year.
• Consequently, traders need to apply this strategy for a full watchlist rather than just one financial security.
• Default properties: RSI on (length 14, RSI buy level 50, sell level 50), EMA, RSI, MACD on, type of strategy pullback, SL/TP type: ATR (length 10, factor 3), trade direction both, quantity 5, take profit swing hl 5.1, highest / lowest lookback 2, enable ATR trail (ATR length 10, SL ATR multiplier 1.4, TP multiplier 2.1, lookback = 4, trade direction = both).

[Spinn] Average True RangeThe "Average True Range" indicator is a popular tool that measures price volatility. In this modified indicator, I present two methods of calculating ATR: the outdated classical one based on RMA (EMA, SMA, WMA), and the modernized one using the Super Smoother filter.
Why has exponential smoothing become outdated?
Exponential smoothing (EMA) has drawbacks, especially when it comes to identifying cyclical components in the data (and RMA is a variant of EMA). EMA creates phase shifts and distortions, making it less predictable and accurate in tracking real price movements. Modern filters, such as Super Smoother, offer a higher degree of adaptability and precision while ensuring significantly less lag, better smoothness, and superior cycle detection.
Why use more contemporary filters like Super Smoother?
The Super Smoother filter combines exponential smoothing and trigonometric functions for more accurate and smooth tracking of price movements. This filter enhances cycle tracking and reduces the lag often found when using EMA. As a result, signals based on Super Smoother are often more precise and representative of real price movements.
Drawbacks of other smoothing filters commonly used with ATR:
SMA. The lag is (N-1)/2, where N = period. This is terrible.
WMA. According to John F. Ehlers, "It appears that the WMA was invented by a trader who did not have a firm grasp of filter theory in hopes of reducing lag". It has been proven that WMA has worse suppression than the equivalent SMA, and WMA has more delay in the passband than the equivalent EMA. In short, WMA has drawbacks but no advantages compared to other popular moving averages.
It is also a good idea to use the median to average the results.
Test, experiment, use!

Crossover EMMMCrossover EMMM is an indicator that displays the Madrid Moving Averages (EMMM) and detects crossovers (upward crossings) and crossunders (downward crossings) between two moving averages. It uses two input parameters to define the fast and slow EMMM lengths. The script calculates the EMMM values, their changes, and assigns colors based on the change direction. The fast EMMM is plotted in green or red, and the slow EMMM is plotted in blue or red, depending on the change direction. The script also displays triangle shapes below or above the bars to indicate crossovers and crossunders.
The "Madrid Moving Average" (EMMMM) is a type of moving average used in technical analysis to smooth price fluctuations of financial assets, such as stocks or currency pairs. Unlike the Simple Moving Average (SMA), which treats all data equally, the EMMM gives more weight to recent data. This results in the EMMM responding more swiftly to price changes, making it well-suited for identifying short-term trends.