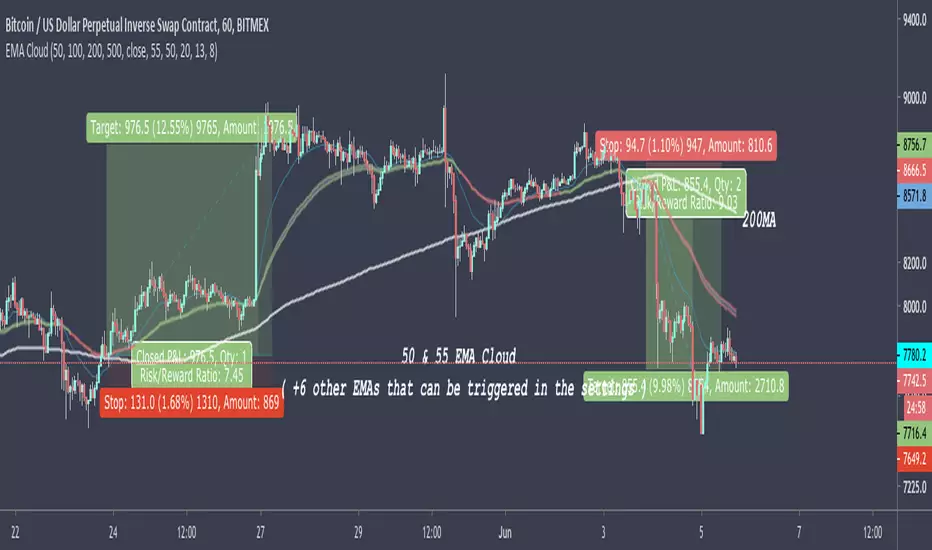
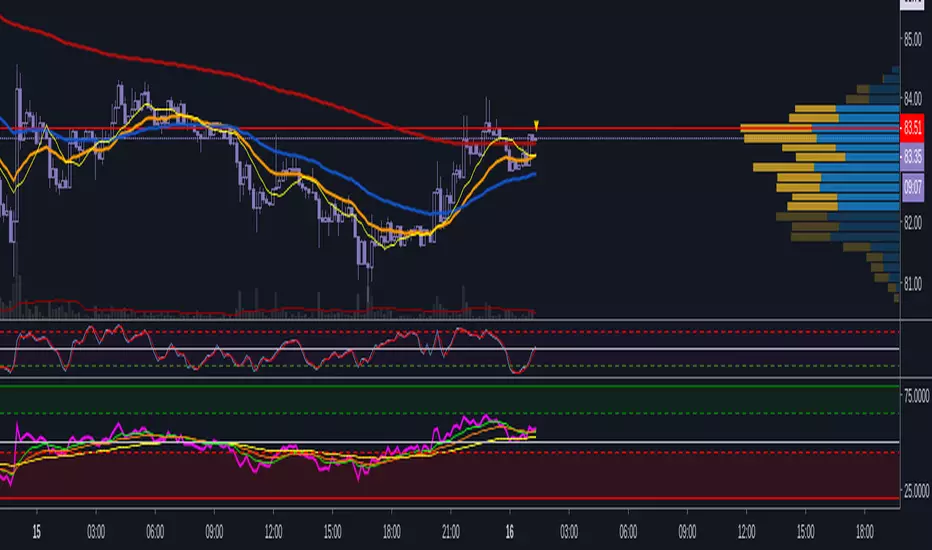
50 & 55 EMA CloudAfter testing thousands of indicators over the years, this simple EMA cloud indicator that I built is still my main weapon. It's always the first one I add to a blank charts and that is not going to change anytime soon.
I find EMAs and MAs are such underrated tools, By observing the price action surrounding these, I can see straight away if it's a good time to get into a trade or not.
As seen here, I also use the 200MA along with the 50/55EMA cloud to find extra strong support and resistances. If price starts to reject both the cloud and the 200MA at the same time/level, then it's a very good indication the price is going to make a big move in that direction as seen here in this chart.
在腳本中搜尋"Exponential"
EMA's 5/20/50/200For those who want to use multiple EMA's in a single indicator.
You can also change ema by just editing in pine editor.
For example:
open pine editor and then just alter => "short = ema(close, 5)" to "short = ema(close, 6)"
By doing this your short ema will be changed at your desire.
Just like this you can increase more ema in your script.
For any help you can pm me :)

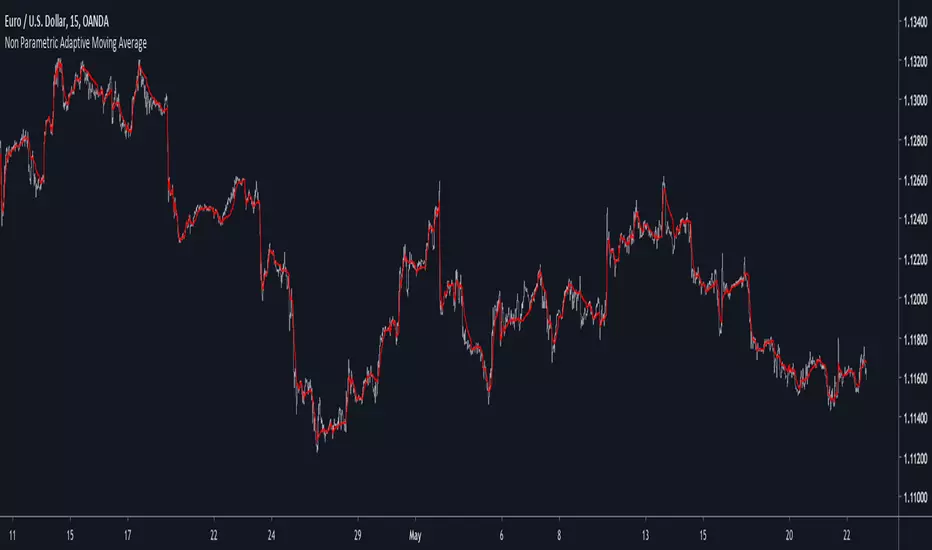
Non Parametric Adaptive Moving AverageIntroduction
Not be confused with non-parametric statistics, i define a "non-parametric" indicator as an indicator who does not have any parameter input. Such indicators can be useful since they don't need to go through parameter optimization. I present here a non parametric adaptive moving average based on exponential averaging using a modified ratio of open-close to high-low range indicator as smoothing variable.
The Indicator
The ratio of open-close to high-low range is a measurement involving calculating the ratio between the absolute close/open price difference and the range (high - low) , now the relationship between high/low and open/close price has been studied in econometrics for some time but there are no reason that the ohlc range ratio may be an indicator of volatility, however we can make the hypothesis that trending markets contain less indecision than ranging market and that indecision is measured by the high/low movements, this is an idea that i've heard various time.
Since the range is always greater than the absolute close/open difference we have a scaled smoothing variable in a range of 0/1, this allow to perform exponential averaging. The ratio of open-close to high-low range is calculated using the vwap of the close/high/low/open price in order to increase the smoothing effect. The vwap tend to smooth more with low time frames than higher ones, since the indicator use vwap for the calculation of its smoothing variable, smoothing may differ depending on the time frame you are in.
1 minute tf
1 hour tf
Conclusion
Making non parametric indicators is quite efficient, but they wont necessarily outperform classical parametric indicators. I also presented a modified version of the ratio of open-close to high-low range who can provide a smoothing variable for exponential averaging. I hope the indicator can help you in any way.
Thanks for reading !
7/20 EMAs 50/100/200 SMAs as One Script.This is one of the scripts I use daily as a full time daytrader. It works well for me to predict MA resistance and support levels and has been very reliable.
QEMA - 9 EMAs (10, 20, 50 - 400) / CryptoprospaBy adding this one indicator to your chart, you save time and effort for the EMAs you want.
You can add this and then modify which ones you want visible in the settings.
It covers the 10, 20, 50, 100, 150, 200, 250, 300, 400 EMAs
Enjoy.
Cryptoprospa.

Multi SMA EMA WMA HMA BB (5x8 MAs Bollinger Bands) MAX MTF - RRBMulti SMA EMA WMA HMA 4x7 Moving Averages with Bollinger Bands MAX MTF by RagingRocketBull 2019
Version 1.0
All available MAX MTF versions are listed below (They are very similar and I don't want to publish them as separate indicators):
ver 1.0: 4x7 = 28 MTF MAs + 28 Levels + 3 BB = 59 < 64
ver 2.0: 5x6 = 30 MTF MAs + 30 Levels + 3 BB = 63 < 64
ver 3.0: 3x10 = 30 MTF MAs + 30 Levels + 3 BB = 63 < 64
ver 4.0: 5(4+1)x8 = 8 CurTF MAs + 32 MTF MAs + 20 Levels + 3 BB = 63 < 64
ver 5.0: 6(5+1)x6 = 6 CurTF MAs + 30 MTF MAs + 24 Levels + 3 BB = 63 < 64
ver 6.0: 4(3+1)x10 = 10 CurTF MAs + 30 MTF MAs + 20 Levels + 3 BB = 63 < 64
Fib numbers: 8, 13, 21, 34, 55, 89, 144, 233, 377
This indicator shows multiple MAs of any type SMA EMA WMA HMA etc with BB and MTF support, can show MAs as dynamically moving levels.
There are 4 MA groups + 1 BB group, a total of 4 TFs * 7 MAs = 28 MAs. You can assign any type/timeframe combo to a group, for example:
- EMAs 9,12,26,50,100,200,400 x H1, H4, D1, W1 (4 TFs x 7 MAs x 1 type)
- EMAs 8,13,21,30,34,50,55,89,100,144,200,233,377,400 x M15, H1 (2 TFs x 14 MAs x 1 type)
- D1 EMAs and SMAs 8,13,21,30,34,50,55,89,100,144,200,233,377,400 (1 TF x 14 MAs x 2 types)
- H1 WMAs 13,21,34,55,89,144,233; H4 HMAs 9,12,26,50,100,200,400; D1 EMAs 12,26,89,144,169,233,377; W1 SMAs 9,12,26,50,100,200,400 (4 TFs x 7 MAs x 4 types)
- +1 extra MA type/timeframe for BB
There are several versions: Simple, MTF, Pro MTF, Advanced MTF, MAX MTF and Ultimate MTF. This is the MAX MTF version. The Differences are listed below. All versions have BB
- Simple: you have 2 groups of MAs that can be assigned any type (5+5)
- MTF: +2 custom Timeframes for each group (2x5 MTF) +1 TF for BB, TF XY smoothing
- Pro MTF: 4 custom Timeframes for each group (4x3 MTF), 1 TF for BB, MA levels and show max bars back options
- Advanced MTF: +4 extra MAs/group (4x7 MTF), custom Ticker/Symbols, Timeframe <>= filter, Remove Duplicates Option
- MAX MTF: +2 subtypes/group, packed to the limit with max possible MAs/TFs: 4x7, 5x6, 3x10, 4(3+1)x10, 5(4+1)x8, 6(5+1)x6
- Ultimate MTF: +individual settings for each MA, custom Ticker/Symbols
MAX MTF version tests the limits of Pinescript trying to squeeze as many MAs/TFs as possible into a single indicator.
It's basically a maxed out Advanced version with subtypes allowing for mixed types within a group (i.e. both emas and smas in a single group/TF)
Pinescript has the following limits:
- max 40 security calls (6 calls are reserved for dupe checks and smoothing, 2 are used for BB, so only 32 calls are available)
- max 64 plot outputs (BB uses 3 outputs, so only 61 plot outputs are available)
- max 50000 (50kb) size of the compiled code
Based on those limits, you can only have the following MAs/TFs combos in a single script:
1. 4x7, 5x6, 3x10 - total number of MTF MAs must always be <= 32, and you can still have BB and Num Levels = total MAs, without any compromises
2. 5(4+1)x8, 6(5+1)x6, 4(3+1)x10 - you can use the Current Symbol/Timeframe as an extra (+1) fixed TF with the same number of MTF MAs
- you don't need to call security to display MAs on the Current Symbol/Timeframe, so the total number of MTF MAs remains the same and is still <= 32
- to fit that many MAs into the max 64 plot outputs limit you need to reduce the number of levels (not every MA Group will have corresponding levels)
Features:
- 4x7 = 28 MAs of any type
- 4x MTF groups with XY step line smoothing
- +1 extra TF/type for BB MAs
- 2 MA subtypes within each group/TF
- 4x7 = 28 MA levels with adjustable group offsets, indents and shift
- supports any existing type of MA: SMA, EMA, WMA, Hull Moving Average (HMA)
- custom tickers/symbols for each group
- show max bars back option
- show/hide both groups of MAs/levels/BB and individual MAs
- timeframe filter: show only MAs/Levels with TFs <>= Current TF
- hide MAs/Levels with duplicate TFs
- support for custom TFs that are not available in free accounts: 2D, 3D etc
- support for timeframes in H: H, 2H, 4H etc
Notes:
- Uses timeframe textbox instead of input resolution dropdown to allow for 240 120 and other custom TFs
- Uses symbol textbox instead of input symbol to avoid establishing multiple dummy security connections to the current ticker - otherwise empty symbols will prevent script from running
- Possible reasons for missing MAs on a chart:
- there may not be enough bars in history to start plotting it. For example, W1 EMA200 needs at least 200 bars on a weekly chart.
- for charts with low/fractional prices i.e. 0.00002 << 0.001 (default Y smoothing step) decrease Y smoothing as needed (set Y = 0.0000001) or disable it completely (set X,Y to 0,0)
- for charts with high price values i.e. 20000 >> 0.001 increase Y smoothing as needed (set Y = 10-20). Higher values exceeding MAs point density will cause it to disappear as there will be no points to plot. Different TFs may require diff adjustments
- TradingView Replay Mode UI and Pinescript security calls are limited to TFs >= D (D,2D,W,MN...) for free accounts
- attempting to plot any TF < D1 in Replay Mode will only result in straight lines, but all TFs will work properly in history and real-time modes. This is not a bug.
- Max Bars Back (num_bars) is limited to 5000 for free accounts (10000 for paid), will show error when exceeded. To plot on all available history set to 0 (default)
- Slow load/redraw times. This indicator becomes slower, its UI less responsive when:
- Pinescript Node.js graphics library is too slow and inefficient at plotting bars/objects in a browser window. Code optimization doesn't help much - the graphics engine is the main reason for general slowness.
- the chart has a long history (10000+ bars) in a browser's cache (you have scrolled back a couple of screens in a max zoom mode).
- Reload the page/Load a fresh chart and then apply the indicator or
- Switch to another Timeframe (old TF history will still remain in cache and that TF will be slow)
- in max possible zoom mode around 4500 bars can fit on 1 screen - this also slows down responsiveness. Reset Zoom level
- initial load and redraw times after a param change in UI also depend on TF. For example: D1/W1 - 2 sec, H1/H4 - 5-6 sec, M30 - 10 sec, M15/M5 - 4 sec, M1 - 5 sec. M30 usually has the longest history (up to 16000 bars) and W1 - the shortest (1000 bars).
- when indicator uses more MAs (plots) and timeframes it will redraw slower. Seems that up to 5 Timeframes is acceptable, but 6+ Timeframes can become very slow.
- show_last=last_bars plot limit doesn't affect load/redraw times, so it was removed from MA plot
- Max Bars Back (num_bars) default/custom set UI value doesn't seem to affect load/redraw times
- In max zoom mode all dynamic levels disappear (they behave like text)
- Dupe check includes symbol: symbol, tf, both subtypes - all must match for a duplicate group
- For the dupe check to work correctly a custom symbol must always include an exchange prefix. BB is not checked for dupes
Good Luck! Feel free to learn from/reuse the code to build your own indicators.


Multi SMA EMA WMA HMA BB (4x5 MAs Bollinger Bands) Adv MTF - RRBMulti SMA EMA WMA HMA 4x5 Moving Averages with Bollinger Bands Advanced MTF by RagingRocketBull 2019
Version 1.0
This indicator shows multiple MAs of any type SMA EMA WMA HMA etc with BB and MTF support, can show MAs as dynamically moving levels.
There are 4 MA groups + 1 BB group, a total of 4 TFs * 5 MAs = 20 MAs. You can assign any type/timeframe combo to a group, for example:
- EMAs 12,26,50,100,200 x H1, H4, D1, W1 (4 TFs x 5 MAs x 1 type)
- EMAs 8,10,13,21,30,50,55,100,200,400 x M15, H1 (2 TFs x 10 MAs x 1 type)
- D1 EMAs and SMAs 8,10,12,26,30,50,55,100,200,400 (1 TF x 10 MAs x 2 types)
- H1 WMAs 7,77,89,167,231; H4 HMAs 12,26,50,100,200; D1 EMAs 89,144,169,233,377; W1 SMAs 12,26,50,100,200 (4 TFs x 5 MAs x 4 types)
- +1 extra MA type/timeframe for BB
There are several versions: Simple, MTF, Pro MTF, Advanced MTF and Ultimate MTF. This is the Advanced MTF version. The Differences are listed below. All versions have BB
- Simple: you have 2 groups of MAs that can be assigned any type (5+5)
- MTF: +2 custom Timeframes for each group (2x5 MTF) +1 TF for BB, TF XY smoothing
- Pro MTF: 4 custom Timeframes for each group (4x3 MTF), 1 TF for BB, MA levels and show max bars back options
- Advanced MTF: +2 extra MAs/group (4x5 MTF), custom Ticker/Symbols, Timeframe <>= filter, Remove Duplicates Option
- Ultimate MTF: +individual settings for each MA, custom Ticker/Symbols
Features:
- 4x5 = 20 MAs of any type
- 4x MTF groups with XY step line smoothing
- +1 extra TF/type for BB MAs
- 4x5 = 20 MA levels with adjustable group offsets, indents and shift
- supports any existing type of MA: SMA, EMA, WMA, Hull Moving Average (HMA)
- custom tickers/symbols for each group - you can compare MAs of the same symbol across exchanges
- show max bars back option
- show/hide both groups of MAs/levels/BB and individual MAs
- timeframe filter: show only MAs/Levels with TFs <>= Current TF
- hide MAs/Levels with duplicate TFs
- support for custom TFs that are not available in free accounts: 2D, 3D etc
- support for timeframes in H: H, 2H, 4H etc
Notes:
- Uses timeframe textbox instead of input resolution dropdown to allow for 240 120 and other custom TFs
- Uses symbol textbox instead of input symbol to avoid establishing multiple dummy security connections to the current ticker - otherwise empty symbols will prevent script from running
- Possible reasons for missing MAs on a chart:
- there may not be enough bars in history to start plotting it. For example, W1 EMA200 needs at least 200 bars on a weekly chart.
- price << default Y smoothing step 5. For charts with low/fractional prices (i.e. 0.00002 << 5) adjust X Y smoothing as needed (set Y = 0.0000001) or disable it completely (set X,Y to 0,0)
- TradingView Replay Mode UI and Pinescript security calls are limited to TFs >= D (D,2D,W,MN...) for free accounts
- attempting to plot any TF < D1 in Replay Mode will only result in straight lines, but all TFs will work properly in history and real-time modes. This is not a bug.
- Max Bars Back (num_bars) is limited to 5000 for free accounts (10000 for paid), will show error when exceeded. To plot on all available history set to 0 (default)
- Slow load/redraw times. This indicator becomes slower, its UI less responsive when:
- Pinescript Node.js graphics library is too slow and inefficient at plotting bars/objects in a browser window. Code optimization doesn't help much - the graphics engine is the main reason for general slowness.
- the chart has a long history (10000+ bars) in a browser's cache (you have scrolled back a couple of screens in a max zoom mode).
- Reload the page/Load a fresh chart and then apply the indicator or
- Switch to another Timeframe (old TF history will still remain in cache and that TF will be slow)
- in max possible zoom mode around 4500 bars can fit on 1 screen - this also slows down responsiveness. Reset Zoom level
- initial load and redraw times after a param change in UI also depend on TF. For example:
D1/W1 - 2 sec, H1/H4 - 5-6 sec, M30 - 10 sec, M15/M5 - 4 sec, M1 - 5 sec.
M30 usually has the longest history (up to 16000 bars) and W1 - the shortest (1000 bars).
- when indicator uses more MAs (plots) and timeframes it will redraw slower. Seems that up to 5 Timeframes is acceptable, but 6+ Timeframes can become very slow.
- show_last=last_bars plot limit doesn't affect load/redraw times, so it was removed from MA plot
- Max Bars Back (num_bars) default/custom set UI value doesn't seem to affect load/redraw times
- In max zoom mode all dynamic levels disappear (they behave like text)
1. based on 3EmaBB, uses plot*, barssince and security functions
2. you can't set certain constants from input due to Pinescript limitations - change the code as needed, recompile and use as a private version
3. Levels = trackprice implementation
4. Show Max Bars Back = show_last implementation
5. swma has a fixed length = 4, alma and linreg have additional offset and smoothing params
6. Smoothing is applied by default for visual aesthetics on MTF. To use exact ma mtf values (lines with stair stepping) - disable it
Good Luck! You can explore, modify/reuse the code to build your own indicators.

Multiple EMA/SMACreate and customize up to 6 EMAs and 6 SMAs. Useful for both long-term and short-term trading. Comes configured with the moving averages I use for trading.

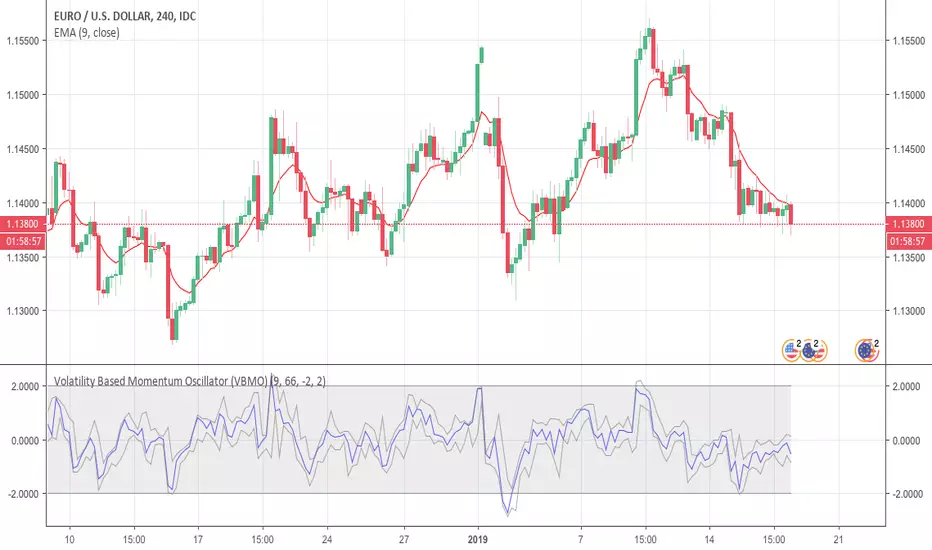
Volatility Based Momentum Oscillator (VBMO)There is a frequent and definitive pattern in price movement, whereby price will steadily drift lower, then accelerate before bottoming out. Similarly, price will often steadily rise, then accelerate into a climax top.
The Volatility Based Momentum Oscillator (VBMO) is designed to delineate between steady versus more accelerated and climactic price movements.
VBMO is calculated using a short-term moving average, the distance of price from this moving average, and the trading instrument’s historical volatility. Even though VBMO’s calculation is relatively simple, the resulting values can help traders identify, analyze and act upon many scenarios, such as climax tops, reversals, and capitulation. Moreover, since the units and scale for VBMO are always the same, the indicator can be used in a consistent manner across multiple timeframes and instruments.
For more details, there is an article further describing VBMO and its applicability.
Fibonacci Trendlines 8-200In my opinion best EMA Trendlines there is, simple yet very reliable on any time frame, i found the version that had 8-13-21-55, so i decided to add 100 and 200 for higher time frames enjoy please share and like

WillSpread IndexDescription Source: www.instaforex.com
The technical indicator Will-Spread was developed by Larry Williams and described in his book Long-Term Secrets to Short-Term Trading. Will-Spread is one of the strongest financial indicators, which measures the flow of price between the primary market and a secondary market. The purpose of this comparison is to highlight signals for opening/closing positions of a financial asset through market signals that have influence on this particular asset. Once the Will Spread turns positive, look for the next bar to be above bar when Will spread turned positive to get long.
Indicator Use
Trading use The main method of using Will-Spread is watching the way it crossing the zero line. If the indicator crosses the zero line upward, rising trend is likely to continue. When the indicator falls below the zero line, there is an obvious downtrend. The author offered to use the indicator in trading from the standpoint of a filter: when Will-Spread crosses the zero line, a trader should wait for the formation of the bar that follows after the signal. In case the new bar generates a high/low above/below the previous one, a trader should open position. It is not recommended to open position if the bar does not form a new high/low.
The spread (A/B *100) takes two underlyings, get the exponential average creating exponential period (5) and subtract from another exponential period (20). The example he gives is that bonds move stocks, so we take the S&P and bonds. Get a will spread of SPY & TLT.

Relative Strength Index of Moving Average MTF alertsAll credit to this study is for chris jhoncic , this is MTF version with alert of his study
basic idea is hybrid of RSI and different MA
You can choose which MA from the following list:
Tillson Moving Average (T3)
Double Exponential Moving Average ( DEMA )
Arnaud Legoux Moving Average ( ALMA )
Least Squares Moving Average ( LSMA )
Simple Moving Average ( SMA )
Exponential Moving Average ( EMA )
Weighted Moving Average ( WMA )
Smoothed Moving Average ( SMMA )
Triple Exponential Moving Average ( TEMA )
Hull Moving Average ( HMA )
Adaptive moving average (AMA)
Fractal Adaptive Moving Average (FAMA)
Variable Index Dynamic Average ( VIDYA )
Triangular Moving Average (TRIMA)
to change the time frame change int2 to what you desire
RSI_EMAx3_SushiThis indicator is mostly the same as other RSI+EMA indicators, the relevant difference is that it uses three EMAs instead of one.
The additional two EMAs can act as support/resistance and tell how strong a move is (eg. 'Williams Alligator'). It provides the same utility any MA does.
MA CrossA simple configurable MA Cross (3 MAs) script. You can choose between SMA and EMA , you will get arrows up or down when MAs cross each others. The arrows have different transparency and length parameters so you can easily identify them:
- small arrow and the most transparent for fast and medium MA crosses
- medium arrow for fast and slow MA crosses
- long arrow with no transparency for medium and slow MA crosses
Default values that can be changed:
- MA type = EMA
- Source for all MAs = close
- Fast MA length = 20
- Medium MA length = 50
- Slow MA length = 200
I plan on adding feartures overtime.

RSI & EMAx3_SushiThis indicator is mostly the same as other RSI+EMA indicators, the relevant difference is that it uses three EMAs instead of one.
The additional two EMAs can act as support/resistance and tell how strong a move is (eg. 'Williams Alligator'). It provides the same utility any MA does.
Pivot Boss 4 EMA + Bollinger Bands + Parabolic SARA combination of some of my favorite indicators.
All credit to original authors.
EMA TEMA crossoverHello,
as usual recently the chart is bugged if I dare post a log one so I deleted and reposted...
here is a simple ema/team script that could allow you to catch trends.
You can play with parameters to get alerted of strong trends, or to detect trends early on.
I want to adapt this to an inside bar strategy, I am going to release that in a while, it is not my priority thought I am a countertrend trader, so I cannot say why, but what I have seen is inside bar breaks in very strong trends work very well.
There is a condition for this inidcator to work: you have to use it on a Heikin Ashi chart (the candle type, selectable in the area right of the timeframe).
Works sometimes. I advice backtesting any strategy before using. Idk maybe this could work decently, seems to have given big winners on bch recently. That huge one from 600 to 1800 lol. *3
* No one should pay for things this simple by the way...

5 Moving Averages (SMA, EMA)5 moving averages in 1 indicator. Choose between SMA and EMA for each moving average.
Philosof fib maI like Fibonacci and I think multiple MAs are best for identifying the trend. This one is based on someone else's script. I just need to share it with a friend =)