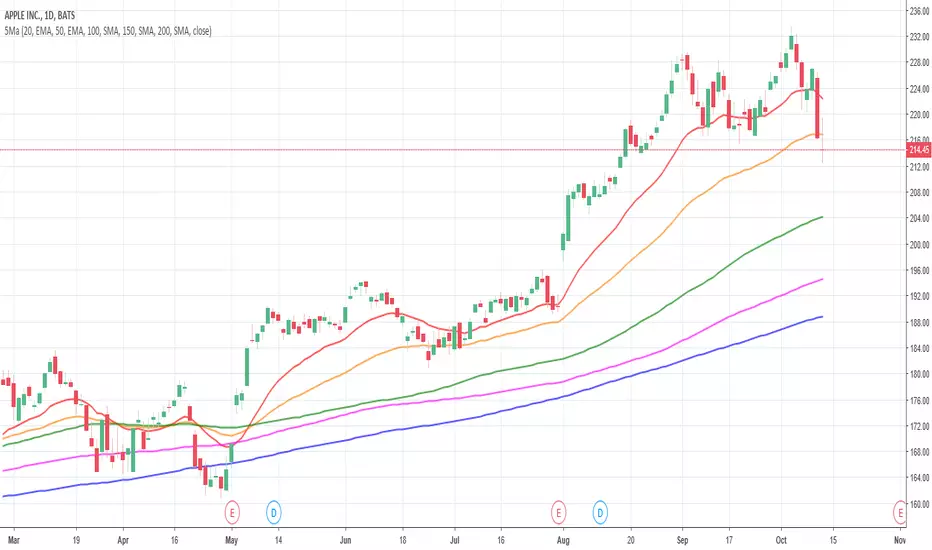
Multiple EMA/SMACreate and customize up to 6 EMAs and 6 SMAs. Useful for both long-term and short-term trading. Comes configured with the moving averages I use for trading.
在腳本中搜尋"Exponential"

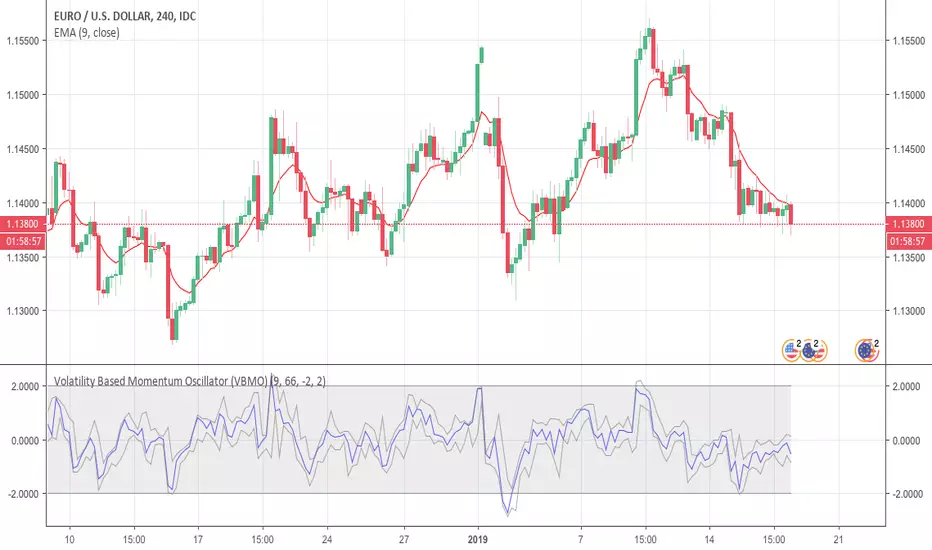
Volatility Based Momentum Oscillator (VBMO)There is a frequent and definitive pattern in price movement, whereby price will steadily drift lower, then accelerate before bottoming out. Similarly, price will often steadily rise, then accelerate into a climax top.
The Volatility Based Momentum Oscillator (VBMO) is designed to delineate between steady versus more accelerated and climactic price movements.
VBMO is calculated using a short-term moving average, the distance of price from this moving average, and the trading instrument’s historical volatility. Even though VBMO’s calculation is relatively simple, the resulting values can help traders identify, analyze and act upon many scenarios, such as climax tops, reversals, and capitulation. Moreover, since the units and scale for VBMO are always the same, the indicator can be used in a consistent manner across multiple timeframes and instruments.
For more details, there is an article further describing VBMO and its applicability.
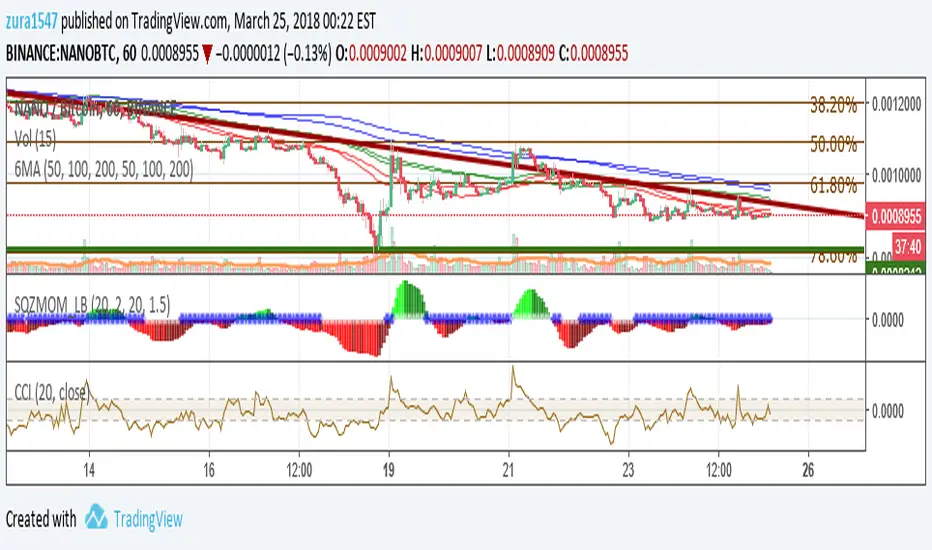
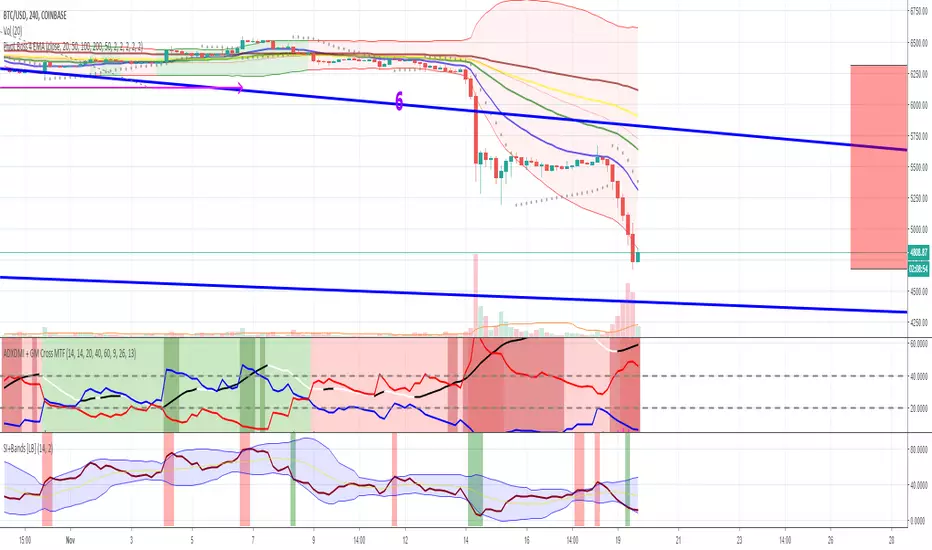
Fibonacci Trendlines 8-200In my opinion best EMA Trendlines there is, simple yet very reliable on any time frame, i found the version that had 8-13-21-55, so i decided to add 100 and 200 for higher time frames enjoy please share and like

WillSpread IndexDescription Source: www.instaforex.com
The technical indicator Will-Spread was developed by Larry Williams and described in his book Long-Term Secrets to Short-Term Trading. Will-Spread is one of the strongest financial indicators, which measures the flow of price between the primary market and a secondary market. The purpose of this comparison is to highlight signals for opening/closing positions of a financial asset through market signals that have influence on this particular asset. Once the Will Spread turns positive, look for the next bar to be above bar when Will spread turned positive to get long.
Indicator Use
Trading use The main method of using Will-Spread is watching the way it crossing the zero line. If the indicator crosses the zero line upward, rising trend is likely to continue. When the indicator falls below the zero line, there is an obvious downtrend. The author offered to use the indicator in trading from the standpoint of a filter: when Will-Spread crosses the zero line, a trader should wait for the formation of the bar that follows after the signal. In case the new bar generates a high/low above/below the previous one, a trader should open position. It is not recommended to open position if the bar does not form a new high/low.
The spread (A/B *100) takes two underlyings, get the exponential average creating exponential period (5) and subtract from another exponential period (20). The example he gives is that bonds move stocks, so we take the S&P and bonds. Get a will spread of SPY & TLT.

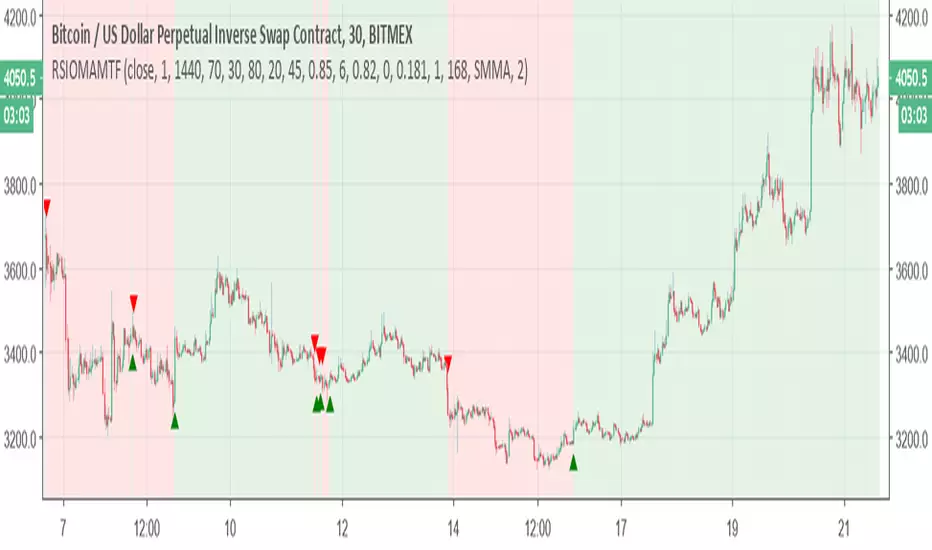
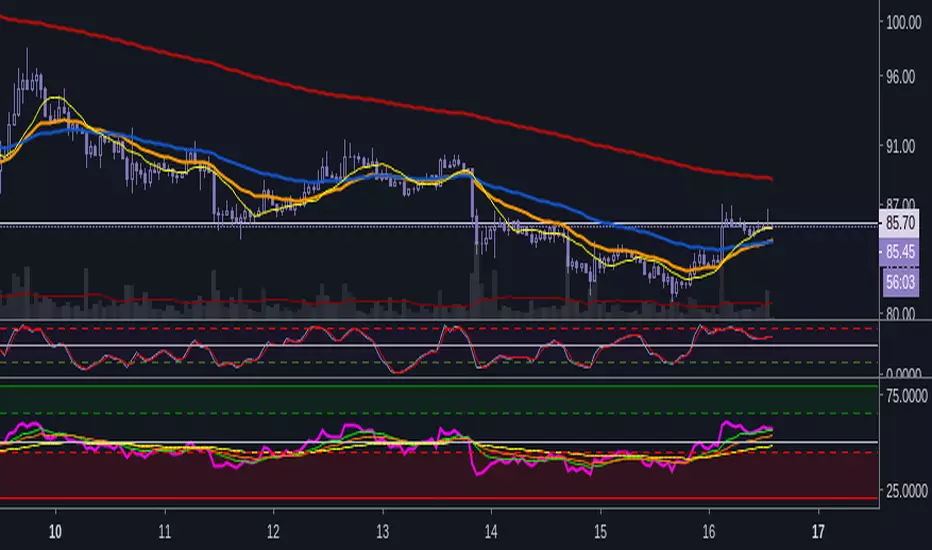
Relative Strength Index of Moving Average MTF alertsAll credit to this study is for chris jhoncic , this is MTF version with alert of his study
basic idea is hybrid of RSI and different MA
You can choose which MA from the following list:
Tillson Moving Average (T3)
Double Exponential Moving Average ( DEMA )
Arnaud Legoux Moving Average ( ALMA )
Least Squares Moving Average ( LSMA )
Simple Moving Average ( SMA )
Exponential Moving Average ( EMA )
Weighted Moving Average ( WMA )
Smoothed Moving Average ( SMMA )
Triple Exponential Moving Average ( TEMA )
Hull Moving Average ( HMA )
Adaptive moving average (AMA)
Fractal Adaptive Moving Average (FAMA)
Variable Index Dynamic Average ( VIDYA )
Triangular Moving Average (TRIMA)
to change the time frame change int2 to what you desire
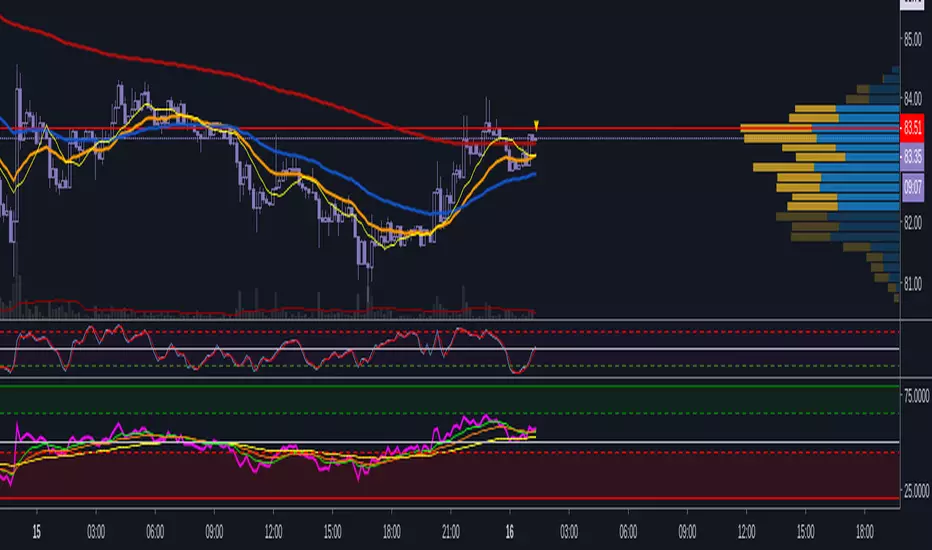
RSI_EMAx3_SushiThis indicator is mostly the same as other RSI+EMA indicators, the relevant difference is that it uses three EMAs instead of one.
The additional two EMAs can act as support/resistance and tell how strong a move is (eg. 'Williams Alligator'). It provides the same utility any MA does.
MA CrossA simple configurable MA Cross (3 MAs) script. You can choose between SMA and EMA , you will get arrows up or down when MAs cross each others. The arrows have different transparency and length parameters so you can easily identify them:
- small arrow and the most transparent for fast and medium MA crosses
- medium arrow for fast and slow MA crosses
- long arrow with no transparency for medium and slow MA crosses
Default values that can be changed:
- MA type = EMA
- Source for all MAs = close
- Fast MA length = 20
- Medium MA length = 50
- Slow MA length = 200
I plan on adding feartures overtime.

RSI & EMAx3_SushiThis indicator is mostly the same as other RSI+EMA indicators, the relevant difference is that it uses three EMAs instead of one.
The additional two EMAs can act as support/resistance and tell how strong a move is (eg. 'Williams Alligator'). It provides the same utility any MA does.
Pivot Boss 4 EMA + Bollinger Bands + Parabolic SARA combination of some of my favorite indicators.
All credit to original authors.
EMA TEMA crossoverHello,
as usual recently the chart is bugged if I dare post a log one so I deleted and reposted...
here is a simple ema/team script that could allow you to catch trends.
You can play with parameters to get alerted of strong trends, or to detect trends early on.
I want to adapt this to an inside bar strategy, I am going to release that in a while, it is not my priority thought I am a countertrend trader, so I cannot say why, but what I have seen is inside bar breaks in very strong trends work very well.
There is a condition for this inidcator to work: you have to use it on a Heikin Ashi chart (the candle type, selectable in the area right of the timeframe).
Works sometimes. I advice backtesting any strategy before using. Idk maybe this could work decently, seems to have given big winners on bch recently. That huge one from 600 to 1800 lol. *3
* No one should pay for things this simple by the way...

5 Moving Averages (SMA, EMA)5 moving averages in 1 indicator. Choose between SMA and EMA for each moving average.
Philosof fib maI like Fibonacci and I think multiple MAs are best for identifying the trend. This one is based on someone else's script. I just need to share it with a friend =)

Relative Strength Index of Moving AveragePine script version 3
Author CryptoJoncis
RSIOMA is the abbreviation for Relative Strength index (RSI) of moving averages (MA). This custom built indicator is based on calculating the relative strength of two moving averages and the smoothes out the RSI using a moving average. Combined, the RSIOMA oscillator depicts trend changes in prices relative to the time frame. The RSIOMA can be used as a signal generator by itself. (www.ProfitF.com)
There are some minor things which you can use to modify this version of RSIOMA:
Choose 2 levels of Over Sold and Over Bought for RSI
Set the middle level to easier visualize the trend
Set x% wider MA line to avoid too many fake signals and gain higher precision
You can choose which MA would you like to use from the following list:
Tillson Moving Average (T3)
Double Exponential Moving Average ( DEMA )
Arnaud Legoux Moving Average ( ALMA )
Least Squares Moving Average ( LSMA )
Simple Moving Average ( SMA )
Exponential Moving Average ( EMA )
Weighted Moving Average ( WMA )
Smoothed Moving Average ( SMMA )
Triple Exponential Moving Average ( TEMA )
Hull Moving Average ( HMA )
Adaptive moving average (AMA)
Fractal Adaptive Moving Average (FAMA)
Variable Index Dynamic Average ( VIDYA )
Triangular Moving Average (TRIMA)
Any questions/suggestions/errors or spelling mistakes? Please leave a comment and let me know.
You can use,publish,modify this code in any way as you wish, but only if you reference me after.
You are not allowed to sell it as it is.
If this code is useful to you, then consider to buy me a coffee 2.17% (or better a pint of beer) by donating Bitcoin 0.64% or Etherium to:
BTC: 3FiBnveHo3YW6DSiPEmoCFCyCnsrWS3JBR
ETH: 0xac290B4A721f5ef75b0971F1102e01E1942A4578
References:
www.profitf.com

DPD INDICATOR (DEMA PRICE DİFFERENCE PERCENTAGE )I use DEMA and Price difference in many strategies and and trade.
Finally , ı wanted to build an indicator for relation between them.
It calculates the percentage of difference between price and dema and estimates deviation from the main trend.
Formula = (price-dema)/price*100
There is some parameters;
DEMA Length is length of dema , ı think 50 is good enough,
there is upper and lower band for DPD Score .
You can change it based on volatilities of your pairs to find an optima.
and use it to be sure about your entry point.
I will developed and combine DPD with some other indicators and build strategies with it.
You can be part of that , I am waiting for your feedback.
Stay in Touch :)

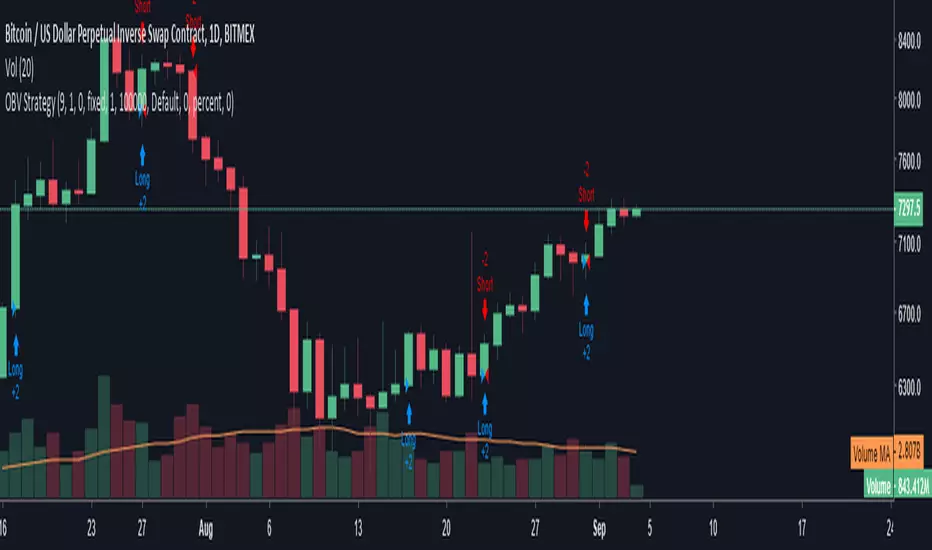
OBV StrategyA simple strategy to give buy/sell signals based on OBV and EMA crossover/crossunder.
When OBV crossunder the EMA it gives a sell signal. When OBV crossover EMA it gives a buy signal.
You can adjust the length of the EMA . By default it is set to 9
Uncle Mo's Ultimate Ichimoku V1Main features:
2 x Ichimoku Cloud
5 x EMA
2 x MA
1 x HullMA
Williams Fractals
Study is based around trader @br0qn 's Ichimoku script.
Credits also go to:
@RicardoSantos for the Bill Williams Fractals
@EmilianoMesa for the EMAs/MAs
@mohamed982 for the HullMA
The script is open source so please feel free to change it around. I'd greatly appreciate it if you could suggest ways to improve it.
Happy trading!

2xIchimoku Cloud + 4xMA + Williams FractalUpdated version of the previously published multi-indicator which includes
4x Moving Averages
2x Ichimoku Clouds
Bill Williams Fractals
Changes:
-Toggle switches for each indicator on input tab for easy on/off
-MA Type Selector (EMA/SMA/WMA/VWMA)
-Various default style change
Many thanks to both redwraith and jedireza for helping me work out the MA section
www.tradingview.com
www.tradingview.com
Next improvements: Ichimoku settings

All Moving averagesI have added an option to turn on or off any Moving average by choice and if needed, Heikin-ashi used as source (instead of close)
List of Moving Averages which you can use
T3 - Tillson Moving Average
DEMA - Double Exponential Moving Average
ALMA - Arnaud Legoux moving average
LSMA - Least Squares Moving Average
MA - Simple Moving Average
EMA - Exponential Moving Average
WMA - Weighted Moving Average
SMMA -The Smoothed Moving Average
TEMA - triple exponential moving average
HMA - The Hull Moving Average
AMA - Adaptive Moving Average
FAMA - Fractal Adaptive Moving Average
VIDYA - Variable Index Dynamic Average
TRIMA - Triangular Moving Average
Consider a tip in ETH to
0xac290B4A721f5ef75b0971F1102e01E1942A4578
Thank you and have a nice day
CryptoJoncis
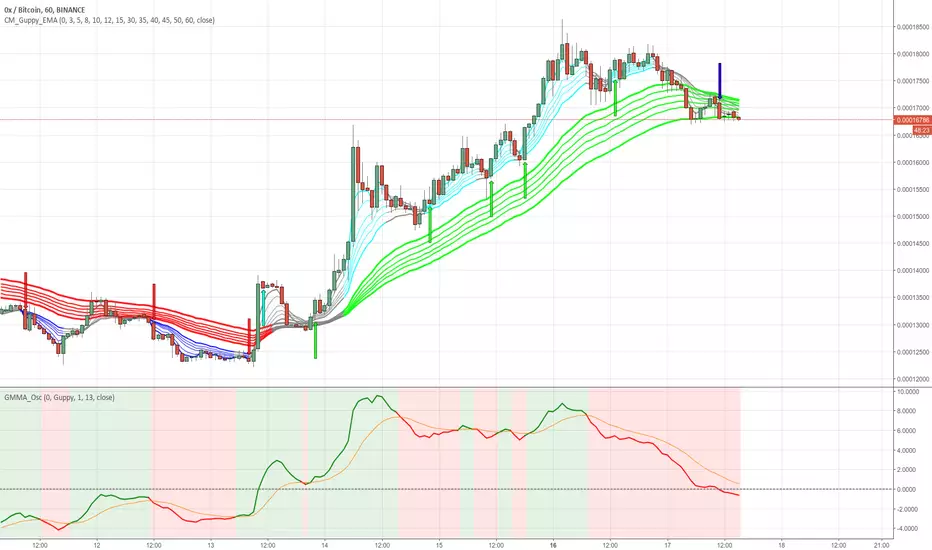
GMMA Oscillator v1 by JustUncleLOn request, here is my version of the Guppy GMMA Oscillator (and SuperGuppy Oscillator) to match with my Guppy and Super Guppy indicators.
Description:
The Guppy Multiple Moving Average (GMMA) is a technical indicator that displays two sets of moving averages. The first set contains six exponential moving averages that use faster periods to monitor the trading activity of short-term traders. The second set contains six exponential moving averages that use slower periods to monitor the trading activity of long-term investors.
The GMMA Oscillator is a technical indicator developed by Leon Wilson. The oscillator line, which percentage difference between the Fast and Slow GMMA sets. The second line is the signal line and it is simply the exponential moving average of the oscillator line.
As with many trend following indicators, a bullish signal occurs when the oscillator line crosses above the signal line and a bearish signal when the oscillator line crosses below the signal line.
Options:
Select between Guppy MMA or SuperGuppy MMA calculated Oscillator.
Option to apply smoothing to the Oscillator line (recommendation 3)
Option to change Signal line period length
Option to use Anchor Time frame to match the Guppy or SuperGuppy chart
Option to show coloured Bullish/Bearish trading Zones
Crossover alerts are also generated to be picked up by the TradingView's Alarm Sub-system.
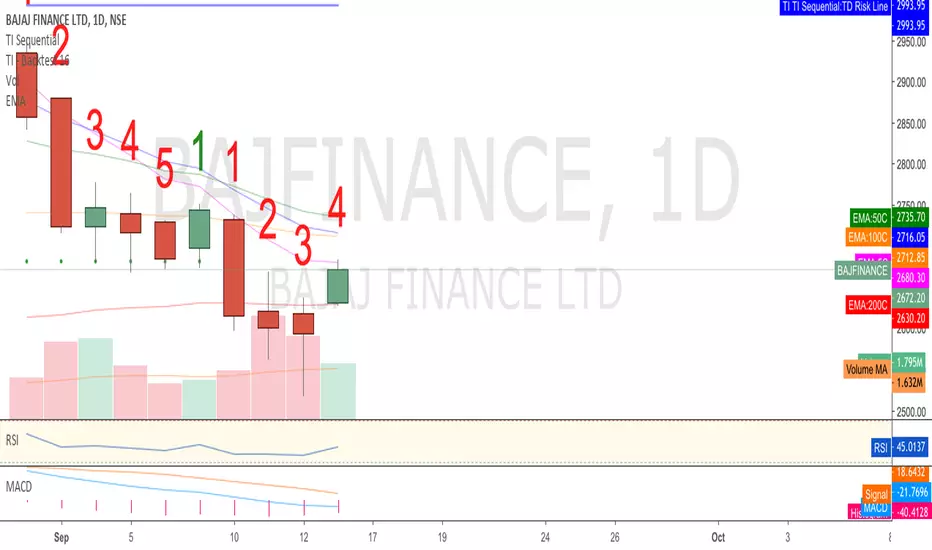
Advanced Larry Williams 9.2- By EduHit rate greater than Setup 9.1
However, the stop of this setup becomes more expensive in certain situations.
PURCHASE SIGN
1 - Paper comes in a bullish trend in the operational term to be operated.
2 - Exponential moving average of 9 upward periods.
3 - Wait for a candle to make the largest closing (candle reference).
4 - If the next candle CLOSES below the minimum of the candle reference the setup is armed.
5 - Mark the candle maxim that closed below the reference. It's the trigger!
6 - If the next candle exceeds this maximum by 1 cent the trade is triggered. Put the stop loss at the low of the candle that closed below (0.01 to 0.10 below)
7 - If the next candle does not fire, let's lower the trigger to the lower maximums, SINCE the mm9exp does not turn down.
8 - It exceeded the maximum we will have the entrance.
9 - Original stop-loss in the minimum of the candle we set the maximum activated.
SIGN OF SALE
1 - Paper comes in a downtrend in the operating period to be operated.
2 - Exponential moving average of 9 periods descending.
3 - Wait for a candle that makes the lowest closing (candle reference).
4 - If the next candle CLOSE above the maximum of the reference candle the setup is armed.
5 - Bookmark the candle that closed above the reference. It's the trigger!
6 - If the next candle breaks this minimum, the trade is triggered.
7 - Place the stop-loss at the maximum of the candle that closed up.
8 - If the next candle does not trigger, we will raise the trigger to the highest minimums SINCE the exponential moving average of 9 periods does not turn upwards.
9 - It broke the minimum we will have the entrance.
10 - Stop-loss original in the maximum of the candle that we set the minimum activated.
*********************************************************************************************************************************************************
Índice de acerto Superior ao Setup 9.1
Porém o stop deste setup acaba se tornando mais caro em determinadas situações.
SINAL DE COMPRA
1 - Papel vem em tendência de alta no prazo operacional a ser operado.
2 - Média móvel exponencial de 9 períodos ascendente.
3 - Aguardar um candle que faça o maior fechamento (candle referência).
4 - Se o próximo candle FECHAR abaixo da mínima do candle referência o setup está armado.
5 - Marcar a máxima do candle que fechou abaixo do referência. É o gatilho!
6 - Se o próximo candle superar essa máxima em 1 centavo o trade é acionado. Colocar o stop-loss na mínima do candle que fechou abaixo (0,01 a 0,10 abaixo)
7 - Se o próximo candle não acionar, vamos abaixando o gatilho para as máximas menores DESDE QUE a mm9exp não vire para baixo.
8 - Superou a máxima teremos a entrada.
9 - Stop-loss original na mínima do candle que marcamos a máxima ativada.
SINAL DE VENDA
1 - Papel vem em tendência de baixa no prazo operacional a ser operado.
2 - Média móvel exponencial de 9 períodos descendente.
3 - Aguardar um candle que faça o menor fechamento (candle referência).
4 - Se o próximo candle FECHAR acima da máxima do candle referência o setup está armado.
5 - Marcar a mínima do candle que fechou acima do referência. É o gatilho!
6 - Se o próximo candle romper essa mínima o trade é acionado.
7 - Colocar o stop-loss na máxima do candle que fechou acima.
8 - Se o próximo candle não acionar, vamos levantando o gatilho para as mínimas maiores DESDE QUE a média móvel exponencial de 9 períodos não vire para cima.
9 - Rompeu a mínima teremos a entrada.
10 - Stop-loss original na máxima do candle que marcamos a mínima ativada.