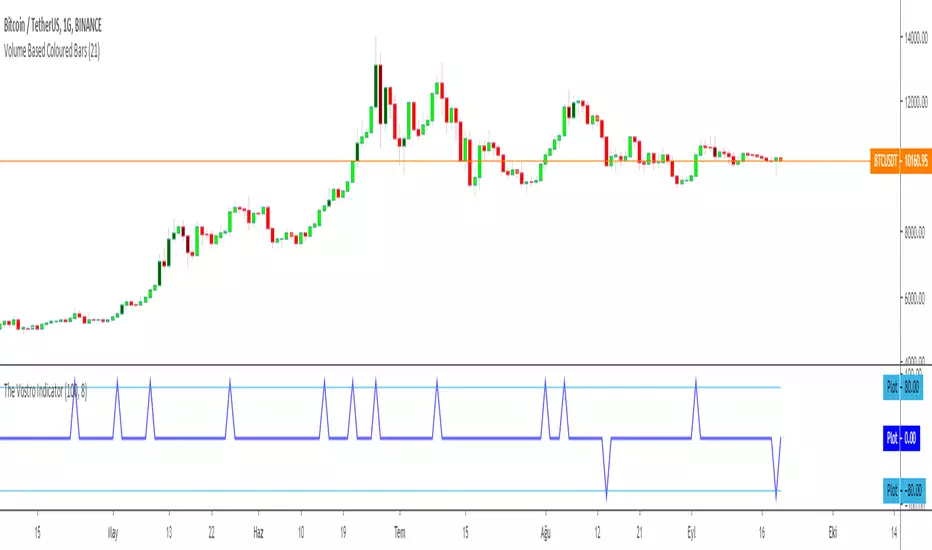
The Vostro Indicator by KIVANÇ fr3762The VOSTRO indicator is a trend indicator that automatically provides buying and selling signals. The indicator marks in a window the potential turning points. The indicator is recommended for scalping.
The Vostro indicator determines the overbought zones (value greater than +80) and the oversold zones (less than the -80 level)
BUY signal: The Vostro curve moves below the -80 level and forms a trough – Turnaround of the upward trend
SELL signal: The Vostro curve moves above the +80 level and forms a peak – Downward trend
further info:
www.prorealcode.com
Here's the link to a complete list of all my indicators:
t.co
Yazar: KıvanÇ @fr3762 twitter
Şimdiye kadar paylaştığım indikatörlerin tam listesi için: t.co
在腳本中搜尋"FR3762"
Moving Average Percent Difference by KIVANC fr3762Percent Difference between varios moving averages like sma , ema , wma , vwma and Hull MA and price to measure volatility and indicate crosses better.
1=SMA, 2=EMA, 3=WMA, 4=VWMA, 5=HullMA
Moving average type can be selected from the settings of the indicator.
the default value for the length of the moving averages taken as 50.
Author: KıvanÇ @fr3762 on twitter (tweets are only in TURKISH)
MAPD Fiyat ve çeşitli hareketli ortalamalar arası yüzde değeri hesaplamakta kullanılır.
indikatörle fiyatın kesişimlerini daha yi görmek ve bir çeşit volatilite ölçümü için de kullanılır.
Hareketli ortalamalar için varsayılan değer 50 bar olarak seçilmiştir/değiştirilebilir.
1=SMA, 2=EMA, 3=WMA, 4=VWMA, 5=HullMA olarak seçilebilir
İndikatörü geliştiren: Tim Tillson

Heikin Ashi Smoothed (yasinipek) by KIVANC fr3762Heikin Ashi Smoothed Strategy
A trend trading forex system composed of the Smoothed Heiken Ashi candlestick indicator and moving averages. It works best on the 1 hour charts and higher time frames.
buy when blue line crosses above red
conversely sell when red line crosses above blue
Author: Yasin İpek @yasinipek83 on twitter / www.yasinipek.com & KıvanÇ @fr3762 on twitter (tweets are only in TURKISH)

Squeeze Momentum Indicator [LazyBear] Version2 by KıvanÇ fr3762Modified version of Squeeze Momentum Indicator including line graph of the main indicator instead of using a Histogram and a second Signal line (5 bars SMA of the original line) to provide visual BUY/SELL signals
BUY when Blue crosses ABOVE the RED signal line
SELL when Blue crosses BELOW the RED signal line
author: LazyBear
modified by: KıvanÇ @fr3762 on twitter (tweets are only in TURKISH)
TURKISH EXPLANATION:
Orijinal indikatördeki histogram yerine çizgi grafiği alınarak bu grafiğin 5 barlık basit hareketli ortalaması sinyal çizgisi olarak eklendi.
Al Koşulu: Mavi çizginin Kırmızıyı yukarı kesmesi
Sat koşulu: Kırmızı çizginin Maviyi yukarı kesmesi

Super Smoothed MACD for STOCKS by KIVANÇ fr3762THIS INDICATOR IS DESIGNED USING EHLERS' SUPER SMOOTHER FILTER
DESIGNED FOR STOCKS
(another version available for CRYPTO TRADE: Super Smoothed MACD for CRYPTO by KIVANÇ fr3762)
Instead of EXPONENTIAL MOVING AVERAGES in traditional MACD calculation, Super Smoothed prices are used.
The default values of BAND EDGE's (periods) of these Super Smoothed Prices are 13,8, and 3 (Fibonacci numbers) which pretty work well for daily trade
users can change these values 13,8,5 or 21,13,5 or 21,13,8 and so on to have optimum trade productivity

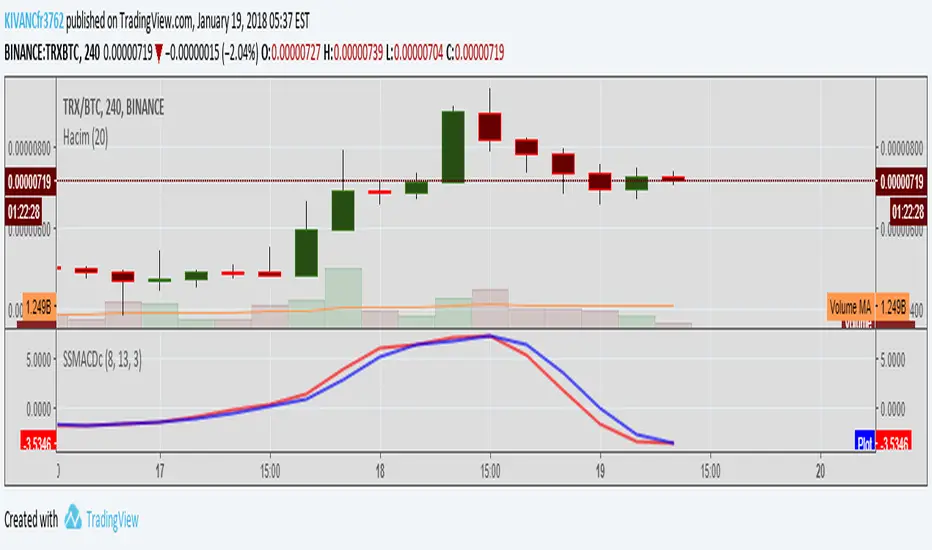
Super Smoothed MACD for CRYPTO by KIVANÇ fr3762THIS INDICATOR IS DESIGNED USING EHLERS' SUPER SMOOTHER FILTER
DESIGNED FOR CRYPTO TRADE
(another version available for stocks also: Super Smoothed MACD for STOCKS by KIVANÇ fr3762)
Instead of EXPONENTIAL MOVING AVERAGES in traditional MACD calculation, Super Smoothed prices are used.
The default values of BAND EDGE's (periods) of these Super Smoothed Prices are 13,8, and 5 (Fibonacci numbers) which pretty work well for daily trade
users can change these values 13,8,3 or 21,13,5 or 21,13,8 and so on to have optimum trade productivity
Double HULL Moving AverageTHIS IS A COMBINATION OF TWO HULL MOVING AVERAGE LINES
-ONE WITH LONGER PERIOD
-OTHER WITH SHORTER PERIOD TO INDICATE BUY/SELL SIGNALS
AS THE KNOWN GENERAL RULE;
IT WOULD BE A BUY SIGNAL WHEN SHORTER(BLUE LINE) HULL CROSSES ABOVE LONGER (RED LINE) ONE
AND CONVERSELY A SELL SIGNAL WHEN LONGER HULL CROSSES ABOVE SHORTER ONE
THIS STUFF IS USEFUL FOR USERS COMPLAINING ABOUTREACHING THE MAXIMUM NUMBER OF INDICATORS :)
KıvanÇ
@fr3762 on twitter (only tweeting in TURKISH)
fr3762 on youtube for indicator explanations in TURKISH)
TURKISH EXPLANATION:
2 HULL hareketli ortalaması aynı grafikte:
Kısa periyotlu (mavi) olan uzunu yukarı kestiğinde AL
Uzun periyotlu (kırmızı) olan kısayı yukarı kestiğinde SAT sinyalleri üretir
Varsayılan periyotlar, birer Fibonacci sayıları olan 8 ve 21 olarak belirlenmiştir, değiştirilebilir.
İndikatör sayısı sınırlamasının önüne geçmek amacıyla geliştirilmiştir.

MACD ReLoaded STRATEGYSTRATEGY version of MACD ReLOADED Indicator:
A different approach to Gerald Appel's classical Moving Average Convergence Divergence.
Appel originaly set MACD with exponential moving averages.
In this version users can apply 11 different types of moving averages which they can benefit from their smoothness and vice versa sharpnesses...
Built in Moving Average type defaultly set as VAR but users can choose from 11 different Moving Average types like:
SMA : Simple Moving Average
EMA : Exponential Moving Average
WMA : Weighted Moving Average
DEMA : Double Exponential Moving Average
TMA : Triangular Moving Average
VAR : Variable Index Dynamic Moving Average a.k.a. VIDYA
WWMA : Welles Wilder's Moving Average
ZLEMA : Zero Lag Exponential Moving Average
TSF : True Strength Force
HULL : Hull Moving Average
TILL : Tillson T3 Moving Average
In shorter time frames backtest results shows us TILL, WWMA, VIDYA (VAR) could be used to overcome whipsaws because they have less numbers of signals.
In longer time frames like daily charts WMA, Volume Weighted MACD V2, and MACDAS and SMA are more accurate according to backtest results.
My interpretation of Buff Dormeier's Volume Weighted MACD V2:
Thomas Aspray's MACD: (MACDAS)

MACD ReLoadedA different approach to Gerald Appel's classical Moving Average Convergence Divergence.
Appel originaly set MACD with exponential moving averages.
In this version users can apply 11 different types of moving averages which they can benefit from their smoothness and vice versa sharpnesses...
Built in Moving Average type defaultly set as VAR but users can choose from 11 different Moving Average types like:
SMA : Simple Moving Average
EMA : Exponential Moving Average
WMA : Weighted Moving Average
DEMA : Double Exponential Moving Average
TMA : Triangular Moving Average
VAR : Variable Index Dynamic Moving Average a.k.a. VIDYA
WWMA : Welles Wilder's Moving Average
ZLEMA : Zero Lag Exponential Moving Average
TSF : True Strength Force
HULL : Hull Moving Average
TILL : Tillson T3 Moving Average
In shorter time frames backtest results shows us TILL, WWMA, VIDYA (VAR) could be used to overcome whipsaws because they have less numbers of signals.
In longer time frames like daily charts WMA, Volume Weighted MACD V2, and MACDAS and SMA are more accurate according to backtest results.
My interpretation of Buff Dormeier's Volume Weighted MACD V2:
Thomas Aspray's MACD: (MACDAS)

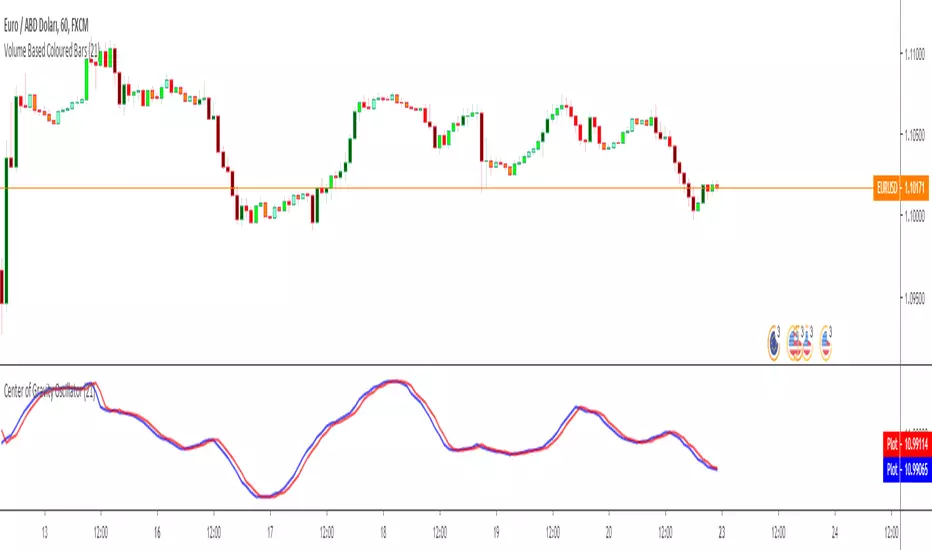
Center of Gravity Oscillator - Ehlers by KIVANC fr3762Center of Gravity OSCILLATOR by JOHN EHLERS
Converted the original code from his book "Cybernetic Analysis for Stocks and Futures"
This article describes a new oscillator that is unique because it is both smoothed
and has essentially zero lag. The smoothing enables clear identification of turning
points and the zero lag aspect enables action to be taken early in the move. This
oscillator is the serendipitous result of my research into adaptive filters. While the filters
have not yet produced the result I seek, this oscillator has substantial advantages over
conventional oscillators used in technical analysis . The “CG” in the name of the
oscillator stands for the Center of Gravity of the prices over the window of observation.
The Center of Gravity ( CG ) of a physical object is its balance point. For example,
if you balance a 12 inch ruler on your finger, the CG will be at its 6 inch point. If you
change the weight distribution of the ruler by putting a paper clip on one end, then the
balance point (e.g. the CG ) shifts toward the paper clip. Moving from the physical world
to the trading world, we can substitute the prices over our window of observation for the
units of weight along the ruler. With this analogy, we see that the CG of the window
moves to the right when prices increase sharply. Correspondingly, the CG of the
window moves to the left when prices decrease.
For further information:
www.mesasoftware.com
Here's the link to a complete list of all my indicators:
t.co
Şimdiye kadar paylaştığım indikatörlerin tam listesi için: t.co
MavilimW Ortalamaları by KIVANÇ fr3762Modified version of MavilimW Indicator by @mavilim0732
MavilimW is originally a support and resistance indicator based on fibonacci injected weighted moving averages
Developed by @mavilim0732 on twitter
İndikatörü geliştiren: @mavilim0732

Trend Score by KIVANÇ fr3762Trend Score compares close prices between last close with previous closes by a certain period of time.
It's like momentum but gives a score +1 when close price is equal to or above (defaultly) 10 bars ago and gives a score of -1 when below.
calculation continues from default length to the 2 times of length.
Defaultly (for 10 bars length)
If Trend Score converges to 10; that means there's a strong uptrend
conversely if Trend Score converges to -10; that means a strong downtrend market is on.

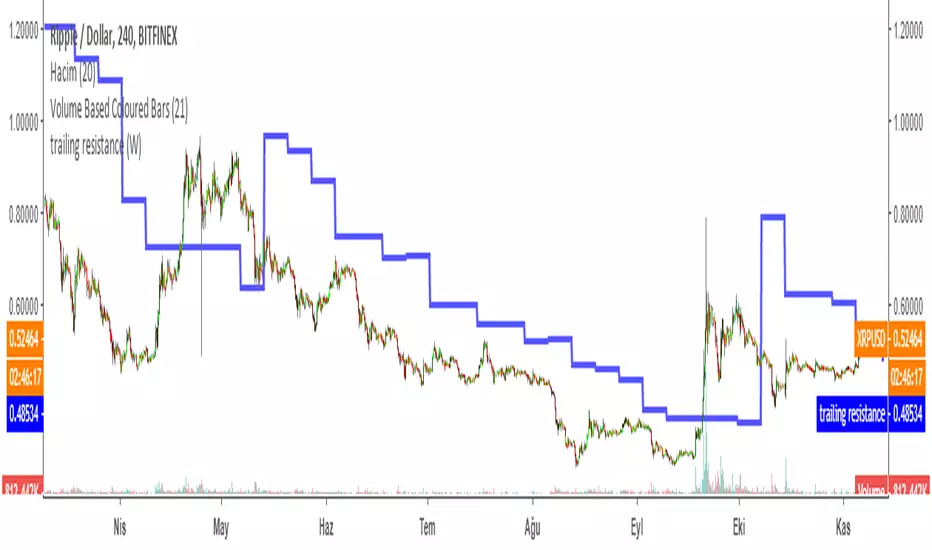
Trailing Resistance MTFTRAILING RESISTANCE INDICATOR is a helpful tool for traders to help one of the common problems that they face: where to buy/sell?
by using trailing resistance you can easily decide and see possible upward movements and understand if you are in a safe zone.
Using Trailing Resistance is just simple:
Go long/ Buy when price crosses above the indicator,
Stay on short position if prices are below the indicator.
The indicator is calculated from previous Lows and doesn't the value won't change until prices makes higher lows.
Multiple Time Frame Version of Trailing Stop Loss Indicator
Trailing Stop Loss Indicator by KıvanÇ fr3762
TRAILING STOP LOSS INDICATOR is a helpful tool for traders to help one of the greatest problems that they face: where to sell?
by using trailing stop loss you can easily decide and see possible downward movements and understand if you are in a safe zone.
Using Trailing Stop Loss is just simple:
Go short/ Sell when price crosses down the indicator,
Stay on long position if prices are above the indicator.
The indicator is calculated from previous Lows and doesn't the value won't change until prices makes higher lows.
Average Directional Movement Index Rating ADXR by KIVANÇ fr3762Average Directional Movement Rating quantifies momentum change in the ADX . It is calculated by adding two values of ADX (the current value and a value n periods back), then dividing by two. This additional smoothing makes the ADXR slightly less responsive than ADX . The interpretation is the same as the ADX ; the higher the value, the stronger the trend.
The ADXR , being a smoothed version of ADX , and can be used similarly to the ADX in the three rule system discussed on the ADX section..
The ADXR is a measure of the spread between the Directional Indicators ( +DI and -DI ). When the ADXR is declining, it's not advised to use a trend following system. However, a rising ADXR signals that the dominant trend is likely to continue. A rising ADXR , with both the ADXR and DI+ above the D- indicates a strengthening bullish market. The scan syntax needed to represent this condition would be...
ADXR > DIMINUS AND DIPLUS > DIMINUS AND ADXR > ADXR .1
A rising ADXR , with both the ADXR and DI- above DI+ indicates a strengthening bearish trend . The scan syntax needed to represent this condition would be...
ADXR > DIPLUS AND DIMINUS > DIPLUS AND ADXR > ADXR .1
If the ADXR has been below both DI+ and DI- but has begun to rise a new market trend is emerging. The scan syntax needed to represent this condition would be...
ADXR < DIPLUS AND ADXR < DIMINUS AND ADXR > ADXR .1
IMPORTANT NOTICE: USERS CAN ADD ADX DI+ and DI- indicators by checking the box in the settings of the indicator.
Developed by J.Welles Wilder
ÖNEMLİ BİLGİ: KULLANICILAR ADX , DI- ve DI+ indikatörlerini de ayarlar bölümündeki kutucukları işaretleyerek sayfaya ekleyebilirler.

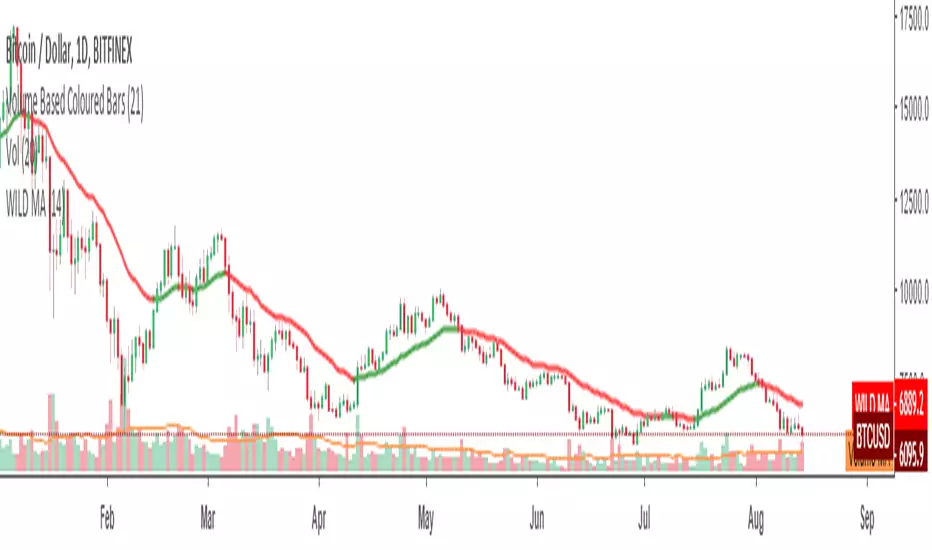
WILDER'S Moving Average by fr3762 KIVANCThe Wilder’s Moving Average indicator (Wilder’s Smoothed Moving Average ) was developed by Welles Wilder and introduced in his 1978 book, “New Concepts in Technical Trading Systems.” Mr. Wilder did not use the standard EMA formula; instead, the following formula is used: EMA = Input * K + EMA * (1-K), where K = 2 / (N+1). Then to find the Wilder’s Moving Average, the following calculation is performed: Input * K + EMA * (1-K), where K =1/N.
Type to use
Moving averages are commonly used to identify trends and reversals as well as identifying support and resistance levels. Moving averages such the WMA and EMA , which are more sensitive to recent prices (experience less lag with price) will turn before an SMA . They are therefore more suitable for dynamic trades, which are reactive to short term price movements. Moving averages such as the SMA move more slowly providing valuable information on the long dominant trend. They can however be prone to giving late signals causing the trader to miss significant parts of the price movement.
Trade Signals
Moving Average Crossovers: Moving average crossovers is a term applied when more than one moving average is used to generate a trade signal where traders will act when the shorter term moving average crosses the longer term moving average. A bullish crossover occurs when the shorter term moving average crosses above the longer term moving average (golden cross). A bearish crossover occurs where the shorter term moving average crosses below the longer term moving average (dead cross).
Price crossovers: A Price crossover is a term applied when a signal is generated where the price crosses a moving average. Bullish signals are given when the price moves above the moving average, bearish signals are given when the price moves below the moving average. Crossover trades are more likely to enjoy success when the moving average slopes are in the direction of the trade.
Support and Resistance: Moving averages can also act as a support level in an uptrend and resistance levels in a downtrend. If the average is widely followed orders in favour of the trend often cluster around the average. As markets are often driven by emotion and many players trade counter to the trend expect overshoots, to this extent the average should be used to identify support and resistance zones rather than exact levels.
from: mahifx.com
Developed by WELLES WILDER
ICHIMOKU Kinko Hyo by KIVANC fr3762Created in 1940's by Goichi Hosoda withe the help of University students in Japan.
Ichimoku is one of the best trend following indicators that works nearly perfect in all markets and time frames.
Ichimoku is originally an built in indicator in Tradingview but there are some problems like:
the indicator hast 5 lines but you can change only 4 parameters in the settings menu of Tradingview Charts which you could only control 3 of the lines effectively. A second problem is that Tradingview preferred to use English titles for the ICHIMOKU lines instead of giving them the most common original Japanese ones. (So I rewrite the indicator)
Kijun Sen (blue line): Also called standard line or base line, this is calculated by averaging the highest high and the lowest low for the past 26 periods.
Tenkan Sen (red line): This is also known as the turning line and is derived by averaging the highest high and the lowest low for the past nine periods.
Chikou Span (Plum line): This is called the lagging line. It is today’s closing price plotted 26 periods behind.
Senkou SpanA (green line): The first Senkou line is calculated by averaging the Tenkan Sen and the Kijun Sen and plotted 26 periods ahead.
Senkou SpanB (purple line):
The second Senkou line is determined by averaging the highest high and the lowest low for the past 52 periods and plotted 26 periods ahead.
PERSONALLY I ADVISE YOU TO USE ICHIMOKU WITH DEAFULT LENGTHS (9,26,26,52,26) IN ORDER FOR STOCK MARKETS AND FOREX MARKETS
FOR CRYPTO YOU'D BETTER USE:
10,30,30,60,30 OR 20,60,60,120,60
THE TRICKY THING IS THAT KEEPING THE 1-3-3-6-3 RATIO CONSTANT IS NECESSARY
Here's a link of my Youtube video explaining ICHIMOKU but unfortunately only in TURKISH:
www.youtube.com
Developed by: Goichi Hosoda

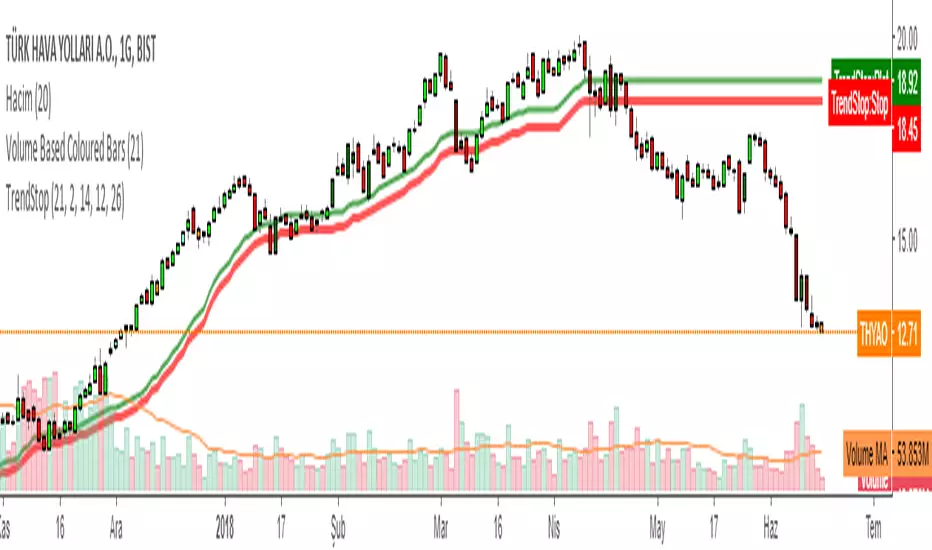
TrendStop by mavilim0732 and KIVANC fr3762TREND STOP is a trend following and Stop Loss indicator.
Prices are on trend after Green line suddenly crossing below prices, conversely bearish after crossing above...
The absolute Stop Level is the red line.
Macd and also Directional indicator signals considered as buy signals in calculating the Trend Stop indicator.
ALSO users can change the 21 Period calculation of the indicator between EMA and the default option of VWAP .
creator: @mavilim0732 on twitter
DARVAS BOX by KIVANÇ fr3762What Is the Darvas Box?
The Darvas Box strategy was developed by Nicholas Darvas. Aside from being a well known dancer, he began trading stock in the 1950s. Based on his success in trading, he was approached to write a book on his strategy. The book, “How I Made $2,000,000 in the Stock Market,” outlines his rather simple approach … simple once you understand the basic concepts and rationale of the strategy.
Darvas Box is an indicator that simply draws lines along highs and lows, and then adjusts them as new highs and lows form. The indicator is available on many trading platforms, such as Thinkorswim. Traders may wish to draw their own boxes though, based on recent highs and lows; Darvas was able to do so (based on telegram quotes) more than half a century ago.
Darvas Box Rules
I shall not follow advisory services.
I shall be cautious of broker advice.
I shall ignore Wall Street sayings or truisms, no matter how ancient or revered.
I shall only trade stocks on major exchanges with adequate volume .
I shall not listen to (or trade off of) rumors or tips, no matter how well researched they may sound.
I will use a sound strategy instead of gamble…I must study this strategy (originally this approach was fundamental analysis , which didn’t work for him, so he developed his Darvas Box trading method).
I will hold one position for longer, as opposed to juggling a bunch of positions for a short period of time.
Darvas looked for increasing volume when selecting stocks to trade; this alerted him to stocks that were being accumulated and were likely to see strong trends.
Darvas believed in buying stocks that presented an upper box limit breakout, but also had an upward Earnings trend. This was especially the case when the major indexes had experienced a decline.
When an upper box limit is broken, buy. From his book, the entry price was usually about 1 to 2% above the upper box limit.
If you enter a trade and the price proceeds to drop out of the new box, and back into the old box, exit the trade.
Entry and stop loss orders should be set in advance, so trades aren’t missed and risk is controlled.
Place, and trail the stop loss order to below the low of the most recent box. This initial stop loss was pretty tight, because Darvas assumed when a price broke out of an old box, it was entering a new box. Therefore, the stop was placed just below the high of old box which was just broken (low of new box).
Record trades, including reasons why you entered and exited.
General conditions of the market must favor buying. Don’t buy stocks when the major indexes are in a bear market, or when volume is flat or declining.
If you are stopped out, but the price moves back into the higher box again providing another buy signal, buy again, using the same stop loss location.
Since the stop is being trailed up, more funds can be added on each consecutive breakout.
The Bottom Line
Nicholas Darvas was a dancer, but committed a great deal of time to developing and then mastering his stock trading method. It’s a trend following method based on breakouts to higher boxes. Risk is controlled by placing a stop below new higher boxes as they form. During choppy conditions the strategy won’t be profitable. This is why Darvas also attempted to only trade stocks with increasing volume and rising Earnings . Trading his method requires a lot of discipline, but can produce big profits when strong trends develop.
source: traderhq.com
Creator: Nicholas DARVAS

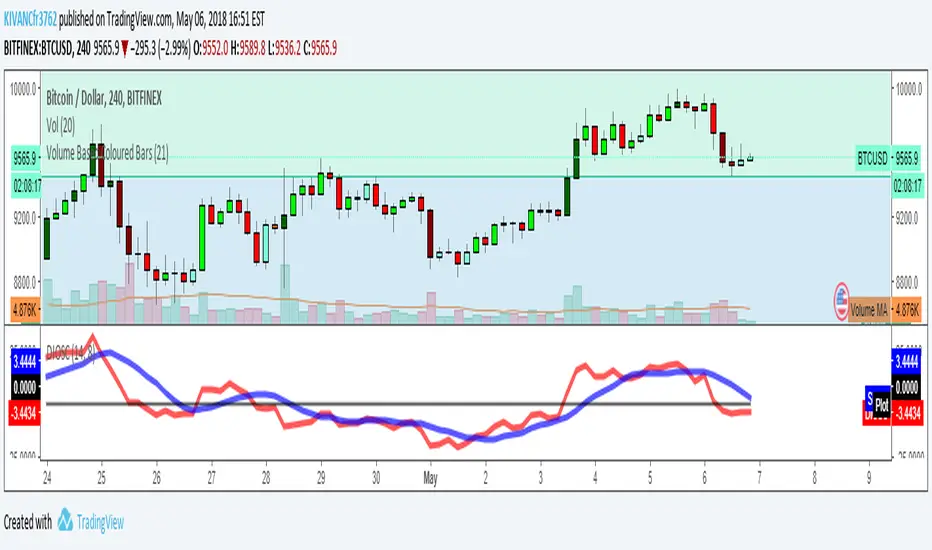
Directional Movement Oscillator by KIVANÇ fr3762Directional Movement Oscillator is simply the difference of Di+ and Di- which helps traders to see the crosses of BUY/SELL signals more effectively.
Di+ crosses above Di- when indicator crosses above 0 which can be considered as a BUY signal.
and conversely Di+ crosses below Di- when indicator crosses below 0 which can be considered as a SELL signal.
Additionally I put a second (OPTIONAL) line (Signal line) which is a 8 bar SMA ( Simple Moving Average ) of DMOSC to confirm signals for further assistance.
Users can add the second optional line (Signal Line) by checking the box : Show SMA line? on the INPUTS section of the indicator SETTINGS menu.
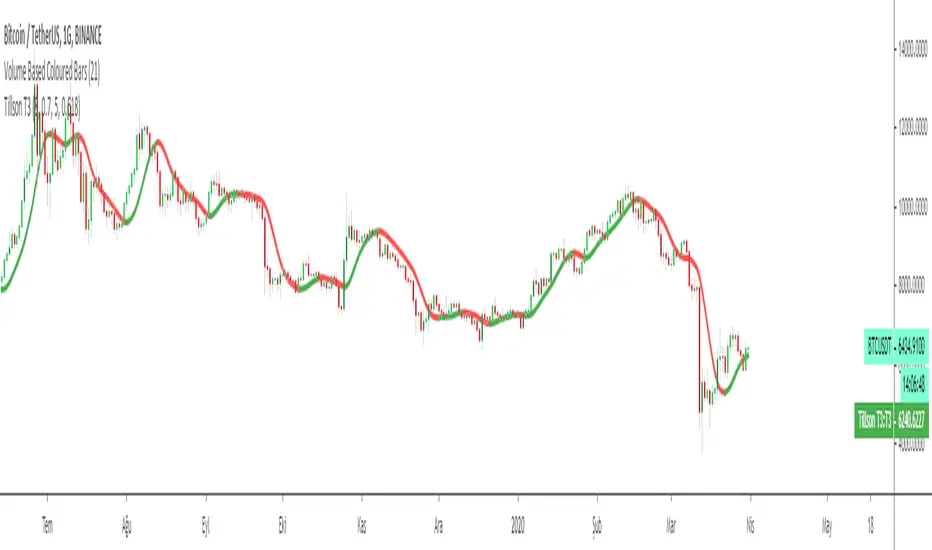
Tillson T3 Moving Average by KIVANÇ fr3762Developed by Tim Tillson, the T3 Moving Average is considered superior to traditional moving averages as it is smoother, more responsive and thus performs better in ranging market conditions as well. However, it bears the disadvantage of overshooting the price as it attempts to realign itself to current market conditions.
It incorporates a smoothing technique which allows it to plot curves more gradual than ordinary moving averages and with a smaller lag. Its smoothness is derived from the fact that it is a weighted sum of a single EMA , double EMA , triple EMA and so on. When a trend is formed, the price action will stay above or below the trend during most of its progression and will hardly be touched by any swings. Thus, a confirmed penetration of the T3 MA and the lack of a following reversal often indicates the end of a trend.
The T3 Moving Average generally produces entry signals similar to other moving averages and thus is traded largely in the same manner. Here are several assumptions:
If the price action is above the T3 Moving Average and the indicator is headed upward, then we have a bullish trend and should only enter long trades (advisable for novice/intermediate traders). If the price is below the T3 Moving Average and it is edging lower, then we have a bearish trend and should limit entries to short. Below you can see it visualized in a trading platform.
Although the T3 MA is considered as one of the best swing following indicators that can be used on all time frames and in any market, it is still not advisable for novice/intermediate traders to increase their risk level and enter the market during trading ranges (especially tight ones). Thus, for the purposes of this article we will limit our entry signals only to such in trending conditions.
Once the market is displaying trending behavior, we can place with-trend entry orders as soon as the price pulls back to the moving average (undershooting or overshooting it will also work). As we know, moving averages are strong resistance/support levels, thus the price is more likely to rebound from them and resume its with-trend direction instead of penetrating it and reversing the trend.
And so, in a bull trend, if the market pulls back to the moving average, we can fairly safely assume that it will bounce off the T3 MA and resume upward momentum, thus we can go long. The same logic is in force during a bearish trend .
And last but not least, the T3 Moving Average can be used to generate entry signals upon crossing with another T3 MA with a longer trackback period (just like any other moving average crossover). When the fast T3 crosses the slower one from below and edges higher, this is called a Golden Cross and produces a bullish entry signal. When the faster T3 crosses the slower one from above and declines further, the scenario is called a Death Cross and signifies bearish conditions.
I Personally added a second T3 line with a volume factor of 0.618 (Fibonacci Ratio) and length of 3 (fibonacci number) which can be added by selecting the box in the input section. traders can combine the two lines to have Buy/Sell signals from the crosses.
Developed by Tim Tillson
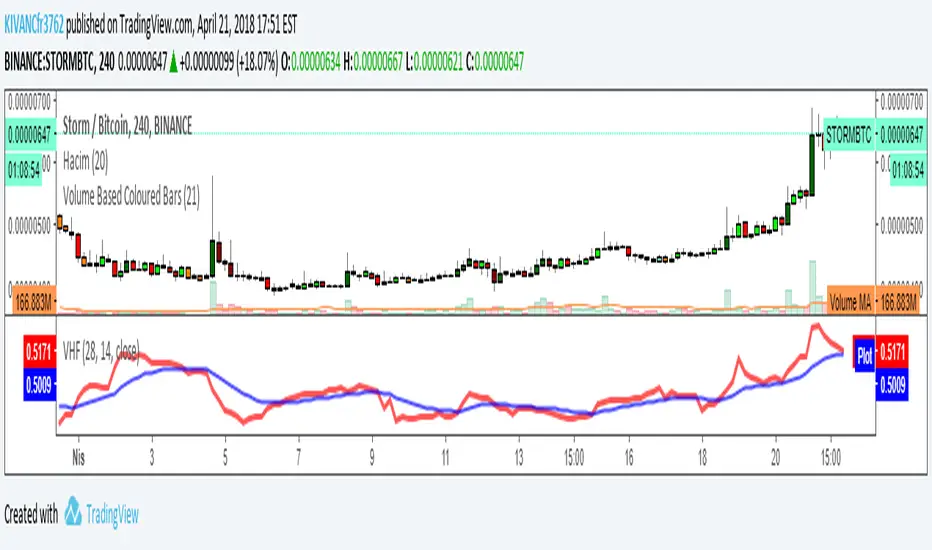
Vertical Horizontal Filter VHF by KIVANÇ fr3762Vertical Horizontal Filter
Vertical Horizontal Filter (VHF) was created by Adam White to identify trending and ranging markets. VHF measures the level of trend activity, similar to ADX in the Directional Movement System. Trend indicators can then be employed in trending markets and momentum indicators in ranging markets.
Vary the number of periods in the Vertical Horizontal Filter to suit different time frames. White originally recommended 28 days but now prefers an 18-day window smoothed with a 6-day moving average.
Trading Signals
Vertical Horizontal Filter does not, itself, generate trading signals, but determines whether signals are taken from trend or momentum indicators.
Rising values indicate a trend.
Falling values indicate a ranging market.
High values precede the end of a trend.
Low values precede a trend start.
I have added an option to plot a deafult value of 14 bar EMA too, to clarify the signals.
Formula
To calculate the Vertical Horizontal Filter:
Select the number of periods (n) to include in the indicator. This should be based on the length of the cycle that you are analyzing. The most popular is 28 days (for intermediate cycles).
Determine the highest closing price ( HCP ) in n periods.
Determine the lowest closing price (LCP) in n periods.
Calculate the range of closing prices in n periods:
HCP - LCP
Next, calculate the movement in closing price for each period:
Closing price - Closing price
Add up all price movements for n periods, disregarding whether they are up or down:
Sum of absolute values of ( Close - Close ) for n periods
Divide Step 4 by Step 6:
VHF = ( HCP - LCP) / (Sum of absolute values for n periods)
created by Adam White
VOLUME WEIGHTED MACD V2 VWMACDV2 BY KIVANÇ fr3762Second version of Buff Dormeier's Volume Weighted MACD indicator....
Here in this version; Exponential Moving Averages used and Weighted by Volume instead of using only vwma ( Volume Weighted Moving Averages).
I personally asked Mr Dormeier, the developer of this indicator, and he confirmed this second version could be used.
I personally think that this one is more effective when comparing with the vwma version...
Volume Weighted MACD
Volume Weighted MACD (VW-MACD) was created by Buff Dormeier and described in his book Investing With Volume Analysis. It represents the convergence and divergence of volume-weighted price trends.
The inclusion of volume allows the VW-MACD to be generally more responsive and reliable than the traditional MACD .
What is MACD (Moving Average Convergence Divergence)?
Moving Average Convergence Divergence was created by Gerald Appel in 1979. Standard MACD plots the difference between a short term exponential average and a long term exponential average. When the difference (the MACD line) is positive and rising, it suggests prices trend is up. When the MACD line is negative, it suggests prices trend is down.
A smooth exponential average of this difference is calculated to form the MACD signal line. When the MACD line is above the MACD signal line, it illustrates that the momentum of MACD is rising. Likewise, when the MACD is below the MACD signal line, the momentum of the MACD falls. This difference between the MACD line and the MACD signal line is frequently plotted as a histogram to highlight the spread between the two lines.
What is the difference between MACD and VW-MACD?
Volume Weighted MACD is substituting the two exponential moving averages to compute the MACD difference with the two corresponding Volume-Weighted Moving Average . Thus, VW-MACD contrasts a volume-weighted short term trend from the volume-weighted longer term trend.
The signal line is left as an exponential moving average because VW-MACD line is already volume weighted.
Developer: Buff Dormeier @BuffDormeierWFA on twitter

INTRADAY INTENSITY INDEX IIIX by KIVANÇ fr3762DEFINITION of 'Intraday Intensity Index'
A volume based indicator that depicts the flow of funds for a security according to where it closes in its high and low range.
This indicator was developed by Dave Bostian. Its goal is to track the activity of institutional block traders.
A technical indicator that approximates the volume of trading for a specified security in a given day. It is designed to help track the activity of institutional block traders and is calculated by subtracting the day's high and low from double the closing price, divided by the volume and multiplied by the difference between the high and the low.
John BOLLINGER advised to use this indicator as a confirmation tool with the BOLLINGER BANDS .
If price tags the lower BBand, look for IIIX has positive values to enter a trade.
Conversely; If price tags the upper BBand, look for IIIX has negative values to exit.
Developer: David Bostian
