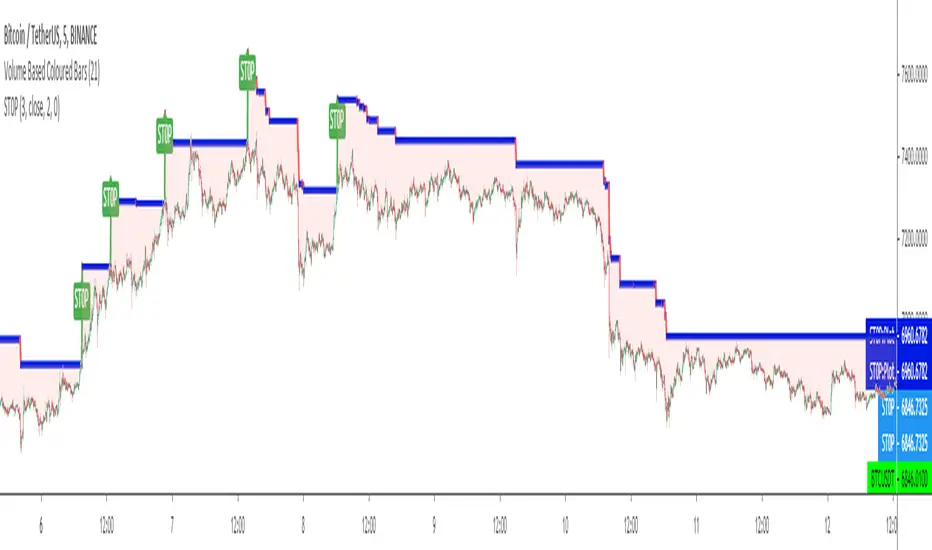
ST0PST0P is a kind of a TRAILING STOP LOSS INDICATOR in which users can set up LONG or SHORT trade versions and also can set up a STOP LOSS level by percent % or unit difference.
It tries to solve the problem of stop loss indicators' default BUY or SELL settings and non adjustable stop levels of % and difference change in price levels.
(Will try to make updates to add user defined start bars.)
Kıvanç Özbilgiç
在腳本中搜尋"FR3762"
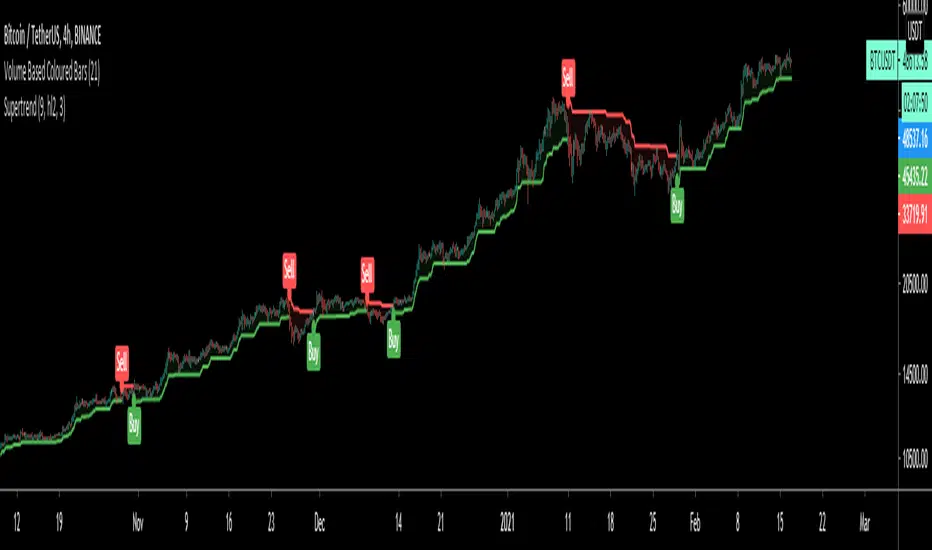
SuperTrendSuperTrend is one of the most common ATR based trailing stop indicators.
In this version you can change the ATR calculation method from the settings. Default method is RMA, when the alternative method is SMA.
The indicator is easy to use and gives an accurate reading about an ongoing trend. It is constructed with two parameters, namely period and multiplier. The default values used while constructing a superindicator are 10 for average true range or trading period and three for its multiplier.
The average true range (ATR) plays an important role in 'Supertrend' as the indicator uses ATR to calculate its value. The ATR indicator signals the degree of price volatility.
The buy and sell signals are generated when the indicator starts plotting either on top of the closing price or below the closing price. A buy signal is generated when the ‘Supertrend’ closes above the price and a sell signal is generated when it closes below the closing price.
It also suggests that the trend is shifting from descending mode to ascending mode. Contrary to this, when a ‘Supertrend’ closes above the price, it generates a sell signal as the colour of the indicator changes into red.
A ‘Supertrend’ indicator can be used on equities, futures or forex, or even crypto markets and also on daily, weekly and hourly charts as well, but generally, it fails in a sideways-moving market.
I had converted Supertrend indicator code for various platforms like Metastock in 2017, but in this TradingView version special credit goes to everget - Alex Orekhov which gave a great inspiration to look my indicators better with highlights, signals and alarms. Thank you Alex.
Laguerre RSILaguerre RSI is based on John EHLERS' Laguerre Filter to avoid the noise of RSI.
Change alpha coefficient to increase/decrease lag and smoothness.
Buy when Laguerre RSI crosses upwards above 20.
Sell when Laguerre RSI crosses down below 80.
While indicator runs flat above 80 level, it means that an uptrend is strong.
While indicator runs flat below 20 level, it means that a downtrend is strong.
Developer: John EHLERS
Author: KivancOzbilgic

Gann High LowGann High Low is a moving average based trend indicator consisting of two different simple moving averages.
The Gann High Low Activator Indicator was described by Robert Krausz in a 1998 issue of Stocks & Commodities Magazine. It is a simple moving average SMA of the previous n period's highs or lows.
The indicator tracks both curves (of the highs and the lows). The close of the bar defines which of the two gets plotted.
This version is showing the channel that needs to be broken if the trend is going to be changed, and it allows you to chose from the 4 basic averages type for calculation (by definition, Gann High Low Activator uses only simple moving average, but some other averages can give you results that are probably more acceptable for trading in some conditions).
Increasing HPeriod and decreasing LPeriod better for short trades, vice versa for long positions.

Wave Period Oscillator by KIVANC fr3762WPO – Wave Period Oscillator
A Time Cycle Oscillator – Published on IFTA Journal 2018 by Akram El Sherbini (pages 68-77)
(http:www.ftaa.org.hk/Files/2018130101754DGQ1JB2OUG. pdf )
Bullish signals are generated when WPO crosses over 0
Bearish signals are generated when WPO crosses under 0
OverBought level is 2
OverSold level is -2
ExtremeOB level is 2.7
ExtremeOS level is -2.7
As with most oscillators, divergences can be taken advantage of.
via PROREALCODE
Here's the link to a complete list of all my indicators:
tr.tradingview.com
Şimdiye kadar Tradingview'a eklediğim tüm indikatörlerin tam listesi için:
tr.tradingview.com

Double HULL Moving Average Strategy// Credit Indicator from KIVANC
// author and idea: KIVANC @fr3762 on twitter
// creator: Alan HULL
// Strategy edited by teejk1986

Turtle Trade Channels by KıvanÇ fr3762his trend following system was designed by Dennis Gartman and Bill Eckhart, and relies on breakouts of historical highs and lows to take and close trades: it is the complete opposite to the "buy low and sell high" approach. This trend following system was taught to a group of average and normal individuals, and almost everyone turned into a profitable trader.
The main rule is "Trade an N-day breakout and take profits when an M-day high or low is breached (N must me above M)". Examples:
Buy a 10-day breakout and close the trade when price action reaches a 5-day low.
Go short a 20-day breakout and close the trade when price action reaches a 10-day high.
In this indicator, the red line is the trading line, and the dotted blue line is the exit line. Original system is:
Go long when the trading line crosses below close price
Go short when the trading line rosses above close price
Exit long positions when the price touches the exit line
Exit short positions when the price touches the exit line
Recommended initial stop-loss is ATR * 2 from the opening price. Default system parameters were 20,10 and 55,20.
Original Turtle Rules:
To trade exactly like the turtles did, you need to set up two indicators representing the main and the failsafe system.
Set up the main indicator with TradePeriod = 20 and StopPeriod = 10 (A.k.a S1)
Set up the failsafe indicator with TradePeriod = 55 and StopPeriod = 20 using a different color. (A.k.a S2)
The entry strategy using S1 is as follows
Buy 20-day breakouts using S1 only if last signaled trade was a loss.
Sell 20-day breakouts using S1 only if last signaled trade was a loss.
If last signaled trade by S1 was a win, you shouldn't trade -Irregardless of the direction or if you traded last signal it or not-
The entry strategy using S2 is as follows:
Buy 55-day breakouts only if you ignored last S1 signal and the market is rallying without you
Sell 55-day breakouts only if you ignored last S1 signal and the market is pluging without you
The turtles had a progressive position sizing approach that boosted their winnings. Once a trading decision has been made you should...
Developers: Dennis Gartman and Bill Eckhart
İndikatörü geliştiren: Dennis Gartman and Bill Eckhart

Chandelier Exit V2 by fr3762 KIVANÇChandelier Exit Version 2 with two lines Long Stop and Short Stop
There is a Chandelier exit for long positions and one for short positions. The Chandelier Exit (long) hangs three ATR values below the 22-period high. This means it rises and falls as the period high and the ATR value changes. The Chandelier Exit for short positions is placed three ATR values above the 22-period low. The spreadsheet examples show sample calculations for both.
According to the theory, traders should exit long positions at either the highest high since entry minus 3 ATRs .
Similarly traders should exit short positions at either the lowest low since entry plus 3 ATRs .
Developed by Charles Le Beau and featured in Alexander Elder's books, the Chandelier Exit sets a trailing stop-loss based on the Average True Range (ATR). The indicator is designed to keep traders in a trend and prevent an early exit as long as the trend extends. Typically, the Chandelier Exit will be above prices during a downtrend and below prices during an uptrend.
The author, Chuck LeBeau explains: It lets "... profits run in the direction of a trend while still offering some protection against any reversal in trend."
The exit stop is placed at a multiple of average true ranges from the highest high or highest close since the entry of the trade.
Chandelier Exit will rise instantly whenever new highs are reached. As the highs get higher the stop moves up but it never moves downward.
The Chandelier Exit is mostly used to set a trailing stop-loss during a trend. Trends sometimes extend further than we anticipate and the Chandelier Exit can help traders ride the trend a little longer. Even though it is mostly used for stop-losses, the Chandelier Exit can also be used as a trend tool. A break above the Chandelier Exit (long) signals strength, while a break below the Chandelier Exit (short) signals weakness. Once a new trend begins, chartists can then use the corresponding Chandelier Exit to help define this trend.
Developer: Charles Le Beau
Here's the link to a complete list of all my indicators:
tr.tradingview.com
Şimdiye kadar paylaştığım indikatörlerin tam listesi için: tr.tradingview.com

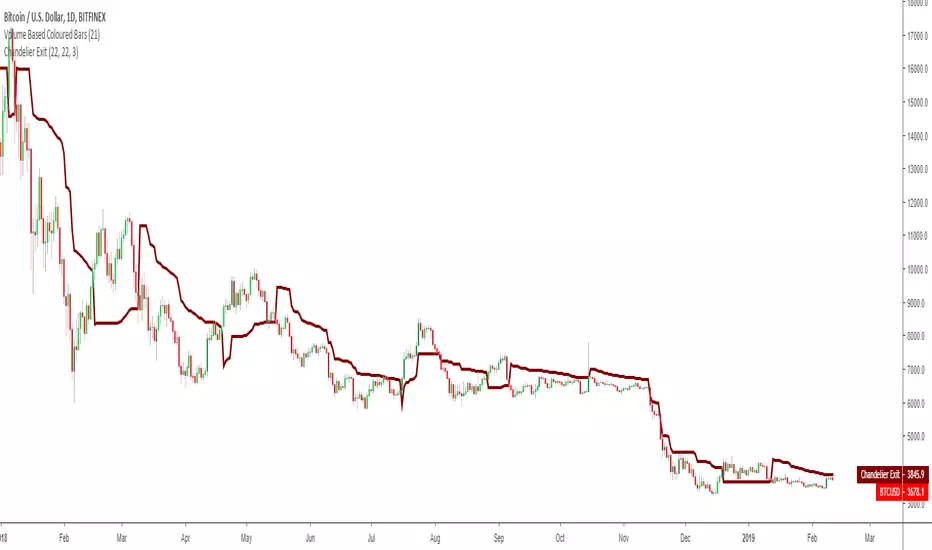
Chandelier Exit by fr3762 KIVANÇChandelier Exit
Developed by Charles Le Beau and featured in Alexander Elder's books, the Chandelier Exit sets a trailing stop-loss based on the Average True Range (ATR). The indicator is designed to keep traders in a trend and prevent an early exit as long as the trend extends. Typically, the Chandelier Exit will be above prices during a downtrend and below prices during an uptrend.
The author, Chuck LeBeau explains: It lets "... profits run in the direction of a trend while still offering some protection against any reversal in trend."
According to the theory, traders should exit long positions at either the highest high since entry minus 3 ATRs .
Similarly traders should exit short positions at either the lowest low since entry plus 3 ATRs .
The exit stop is placed at a multiple of average true ranges from the highest high or highest close since the entry of the trade.
Chandelier Exit will rise instantly whenever new highs are reached. As the highs get higher the stop moves up but it never moves downward.
The Chandelier Exit is mostly used to set a trailing stop-loss during a trend. Trends sometimes extend further than we anticipate and the Chandelier Exit can help traders ride the trend a little longer. Even though it is mostly used for stop-losses, the Chandelier Exit can also be used as a trend tool. A break above the Chandelier Exit (long) signals strength, while a break below the Chandelier Exit (short) signals weakness. Once a new trend begins, chartists can then use the corresponding Chandelier Exit to help define this trend.
Developer: Charles Le Beau
MAMA by EHLERSMESA Adaptive Moving Average aka: Mother of Adaptive Moving Averages:
The MESA Adaptive Moving Average ( MAMA ) adapts to price movement in an
entirely new and unique way. The adapation is based on the rate change of phase as
measured by the Hilbert Transform Discriminator I have previously described.1
The advantage of this method of adaptation is that it features a fast attack average and a
slow decay average so that composite average rapidly ratchets behind price changes
and holds the average value until the next ratchet occurs. The action of MAMA is
shown in Figure 1. Since the average fallback is slow I can build trading systems that
are virtually free of whipsaw trades.
For detailed information of MAMA: (creators' PDF document)
www.mesasoftware.com
Long condition: when MAMA Crosses over FAMA (Following Adaptive Moving Average )
Short condition: when FAMA Crosses over MAMA
(Personally modified LazyBear's version which was originally calculated in degrees instead of radian by applying explanations in the MESA pdf document.http://www.mesasoftware.com/papers/MAMA.pdf)
Creator: John EHLERS

Quad Moving Avarage-Ichimoku Cloud-ALMA-Bollinger BandsAll-in-One
Ingradients:
* Ichimoku Cloud,
* 2 Simple Moving Avarage (SMA),
* 2 Exponential Moving Avarage (EMA),
* 2 Arnoud Legoux Moving Avarage (ALMA),
* Bollinger Bands and
* Volume Based Colored Bars (developed by KIVANÇ fr3762).
Compiled for limitations. Thank you.

Kıvanç HL MTFMULTIPLE TIME FRAME version of KIVANÇ HL Indicator:
Kıvanç HL indicator is a useful tool to define RESISTANCE and SUPPORT levels by analyzing previous HIGH and LOW levels od fibonacci lengths.
There are 3 lines HIGH, LOW and their exact average MID line.
Each line could be a significant support and resistance level due to the price action.
Breakouts are very important when supported by volume and new highs are expected when upward breakouts take place.
Version 2 has 4 more levels of lines calculated with Fibonacci constants between the HIGH and LOW lines.
Version 2 can be activated by cheching the box in the settings of the indicator.
Special thanks from me to MaviliM for developing such a great indicator and giving my name
creator: @mavilim0732 on twitter
Here's the link to the complete list of all my indicators:
tr.tradingview.com
İndikatörü geliştiren: @mavilim0732 on twitter

ICHIMOKU MTFMultiple Time Frame Version of Ichimoku Kinko Hyo Indicator.
Created in 1940's by Goichi Hosoda withe the help of University students in Japan.
Ichimoku is one of the best trend following indicators that works nearly perfect in all markets and time frames.
Ichimoku is originally an built in indicator in Tradingview but there are some problems like:
the indicator hast 5 lines but you can change only 4 parameters in the settings menu of Tradingview Charts which you could only control 3 of the lines effectively. A second problem is that Tradingview preferred to use English titles for the ICHIMOKU lines instead of giving them the most common original Japanese ones. (So I rewrite the indicator)
Kijun Sen (blue line): Also called standard line or base line, this is calculated by averaging the highest high and the lowest low for the past 26 periods.
Tenkan Sen (red line): This is also known as the turning line and is derived by averaging the highest high and the lowest low for the past nine periods.
Chikou Span (Plum line): This is called the lagging line. It is today’s closing price plotted 26 periods behind.
Senkou SpanA (green line): The first Senkou line is calculated by averaging the Tenkan Sen and the Kijun Sen and plotted 26 periods ahead.
Senkou SpanB (purple line):
The second Senkou line is determined by averaging the highest high and the lowest low for the past 52 periods and plotted 26 periods ahead.
PERSONALLY I ADVISE YOU TO USE ICHIMOKU WITH DEAFULT LENGTHS (9,26,26,52,26) IN ORDER FOR STOCK MARKETS AND FOREX MARKETS
FOR CRYPTO YOU'D BETTER USE:
10,30,30,60,30 OR 20,60,60,120,60
THE TRICKY THING IS THAT KEEPING THE 1-3-3-6-3 RATIO CONSTANT IS NECESSARY
Here's a link of my Youtube video explaining ICHIMOKU but unfortunately only in TURKISH:
www.youtube.com
Developed by: Goichi Hosoda
Here's the link to a complete list of all my indicators:
tr.tradingview.com
Ichimoku kullanımı anlattığım detaylı video serisini linkten izleyebilirsiniz:
www.youtube.com
İndikatörü geliştiren: Goichi Hosoda

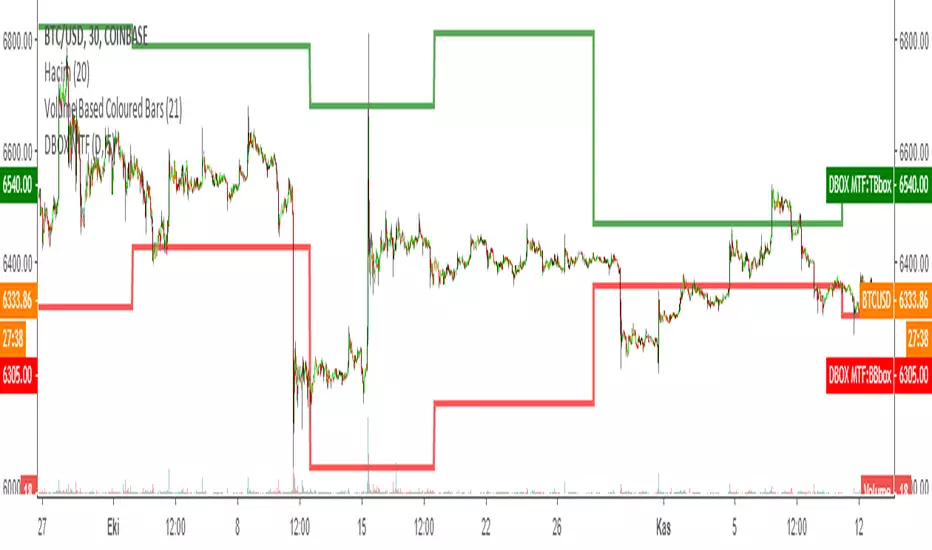
DARVAS BOX MTFMULTIPLE TIME FRAME VERSION OF DARVAS BOX:
You can view different time frame values of Darvas Box levels on any chart
What Is the Darvas Box?
The Darvas Box strategy was developed by Nicholas Darvas. Aside from being a well known dancer, he began trading stock in the 1950s. Based on his success in trading, he was approached to write a book on his strategy. The book, “How I Made $2,000,000 in the Stock Market,” outlines his rather simple approach … simple once you understand the basic concepts and rationale of the strategy.
Darvas Box is an indicator that simply draws lines along highs and lows, and then adjusts them as new highs and lows form. The indicator is available on many trading platforms, such as Thinkorswim. Traders may wish to draw their own boxes though, based on recent highs and lows; Darvas was able to do so (based on telegram quotes) more than half a century ago.
Darvas Box Rules
I shall not follow advisory services.
I shall be cautious of broker advice.
I shall ignore Wall Street sayings or truisms, no matter how ancient or revered.
I shall only trade stocks on major exchanges with adequate volume .
I shall not listen to (or trade off of) rumors or tips, no matter how well researched they may sound.
I will use a sound strategy instead of gamble…I must study this strategy (originally this approach was fundamental analysis , which didn’t work for him, so he developed his Darvas Box trading method).
I will hold one position for longer, as opposed to juggling a bunch of positions for a short period of time.
Darvas looked for increasing volume when selecting stocks to trade; this alerted him to stocks that were being accumulated and were likely to see strong trends.
Darvas believed in buying stocks that presented an upper box limit breakout, but also had an upward Earnings trend. This was especially the case when the major indexes had experienced a decline.
When an upper box limit is broken, buy. From his book, the entry price was usually about 1 to 2% above the upper box limit.
If you enter a trade and the price proceeds to drop out of the new box, and back into the old box, exit the trade.
Entry and stop loss orders should be set in advance, so trades aren’t missed and risk is controlled.
Place, and trail the stop loss order to below the low of the most recent box. This initial stop loss was pretty tight, because Darvas assumed when a price broke out of an old box, it was entering a new box. Therefore, the stop was placed just below the high of old box which was just broken (low of new box).
Record trades, including reasons why you entered and exited.
General conditions of the market must favor buying. Don’t buy stocks when the major indexes are in a bear market, or when volume is flat or declining.
If you are stopped out, but the price moves back into the higher box again providing another buy signal, buy again, using the same stop loss location.
Since the stop is being trailed up, more funds can be added on each consecutive breakout.
The Bottom Line
Nicholas Darvas was a dancer, but committed a great deal of time to developing and then mastering his stock trading method. It’s a trend following method based on breakouts to higher boxes. Risk is controlled by placing a stop below new higher boxes as they form. During choppy conditions the strategy won’t be profitable. This is why Darvas also attempted to only trade stocks with increasing volume and rising Earnings . Trading his method requires a lot of discipline, but can produce big profits when strong trends develop.
source: traderhq.com
Creator: Nicholas DARVAS
Here's the link to a complete list of all my indicators:
tr.tradingview.com
Şimdiye kadar paylaştığım indikatörlerin tam listesi için: tr.tradingview.com
Bollinger Bands MTFMultiple Time Frame version of Bollinger Bands volatility indicator.
Developed by John Bollinger @bbands on Twitter
Here's the link to a complete list of all my indicators:
tr.tradingview.com
İndikatörü geliştiren: John Bollinger @bbands

Trailing Stop Loss MTFMultiple Time Frame Version of Trailing Stop Loss Indicator
TRAILING STOP LOSS INDICATOR is a helpful tool for traders to help one of the greatest problems that they face: where to sell?
by using trailing stop loss you can easily decide and see possible downward movements and understand if you are in a safe zone.
Using Trailing Stop Loss is just simple:
Go short/ Sell when price crosses down the indicator,
Stay on long position if prices are above the indicator.
The indicator is calculated from previous Lows and doesn't the value won't change until prices makes higher lows.
TURKISH EXPLANATION:
İz Süren Stop Loss İndikatörü
Adım 1- bu günün düşük fiyatından geriye doğru, daha düşük fiyatlı bir günle karşılaşıncaya kadar yatay bir çizgi çizin
bu sizin birinci countback’ iniz olacak.
Adım 2- bu yeni düşük günün düşük fiyatından geriye doğru tekrar bir başka düşük güne gelene kadar yatay bir çizgi
çekin. Bu sizin ikinci countback’ iniz olacak.
Adım 3- bu ikinci düşük günün düşüğünden ileri bu günkü tarihe kadar yatay bir çizgi çekin bu sizin talimat
verdiğinizde stop-loss noktanız oluyor.
Kural 1- asla aşağıya doğru stop koymayın. Eğer yeni stop-loss noktanız öncekinden daha düşükse onu atıyorsunuz.
Bu kural asla bozulmamalı.
Kural 2- countback çizginiz üzerindeki aynı düşük fiyata denk gelen günleri yok sayın. İkinci contback çizginizi çekmek
için ilkinden daha düşük bir nokta bulmalısınız. Eğer aynı düşük fiyata sahip bir çubuğa denk gelirseniz daha düşüğünü
buluncaya kadar devam edin. Gerçekten hepsi bu kadar. Bu kuralları uygulayarak stop-loss noktamızı her yeni günün
datası eklendikçe uzatabiliriz.
drive.google.com

Tillson T3 Moving Average MTFMULTIPLE TIME FRAME version of Tillson T3 Moving Average Indicator
Developed by Tim Tillson, the T3 Moving Average is considered superior -1.60% to traditional moving averages as it is smoother, more responsive and thus performs better in ranging market conditions as well. However, it bears the disadvantage of overshooting the price as it attempts to realign itself to current market conditions.
It incorporates a smoothing technique which allows it to plot curves more gradual than ordinary moving averages and with a smaller lag. Its smoothness is derived from the fact that it is a weighted sum of a single EMA , double EMA , triple EMA and so on. When a trend is formed, the price action will stay above or below the trend during most of its progression and will hardly be touched by any swings. Thus, a confirmed penetration of the T3 MA and the lack of a following reversal often indicates the end of a trend.
The T3 Moving Average generally produces entry signals similar to other moving averages and thus is traded largely in the same manner. Here are several assumptions:
If the price action is above the T3 Moving Average and the indicator is headed upward, then we have a bullish trend and should only enter long trades (advisable for novice/intermediate traders). If the price is below the T3 Moving Average and it is edging lower, then we have a bearish trend and should limit entries to short. Below you can see it visualized in a trading platform.
Although the T3 MA is considered as one of the best swing following indicators that can be used on all time frames and in any market, it is still not advisable for novice/intermediate traders to increase their risk level and enter the market during trading ranges (especially tight ones). Thus, for the purposes of this article we will limit our entry signals only to such in trending conditions.
Once the market is displaying trending behavior, we can place with-trend entry orders as soon as the price pulls back to the moving average (undershooting or overshooting it will also work). As we know, moving averages are strong resistance/support levels, thus the price is more likely to rebound from them and resume its with-trend direction instead of penetrating it and reversing the trend.
And so, in a bull trend, if the market pulls back to the moving average, we can fairly safely assume that it will bounce off the T3 MA and resume upward momentum, thus we can go long. The same logic is in force during a bearish trend .
And last but not least, the T3 Moving Average can be used to generate entry signals upon crossing with another T3 MA with a longer trackback period (just like any other moving average crossover). When the fast T3 crosses the slower one from below and edges higher, this is called a Golden Cross and produces a bullish entry signal. When the faster T3 crosses the slower one from above and declines further, the scenario is called a Death Cross and signifies bearish conditions.
I Personally added a second T3 line with a volume factor of 0.618 (Fibonacci Ratio) and length of 3 (fibonacci number) which can be added by selecting the box in the input section. traders can combine the two lines to have Buy/Sell signals from the crosses.
Developed by Tim Tillson

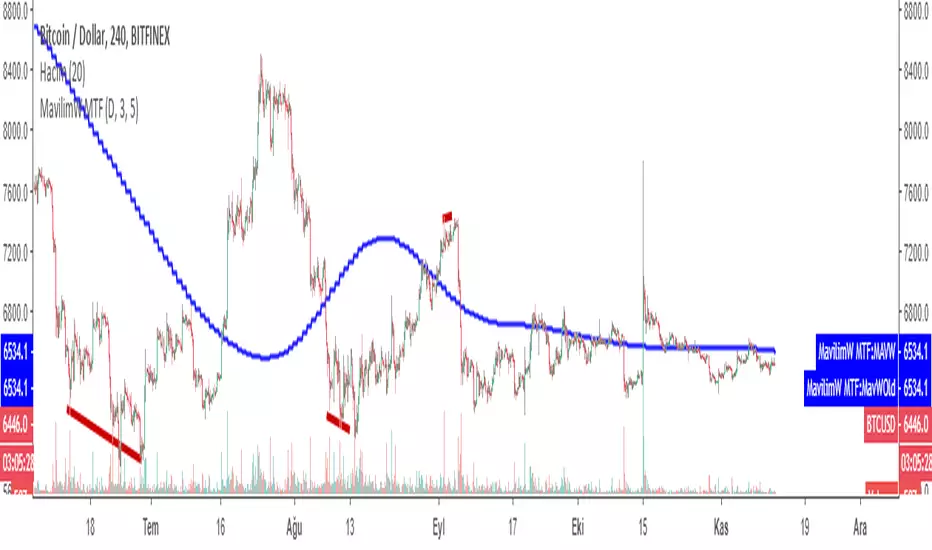
MavilimW MTFMultiple Time Frame version of MavilimW
This Indicator plots smoothed weighted moving average combinations of various Fibonacci numbers
a great support and resistance for long term trading and confirmation
1- You can change the sensitivity of the indicator by changing the first two parameters
2- In the settings you can also add the original version by checking the "Show previous version" button
3- The indicator calculates Fibonacci series automatically when you change the two parameters
HINT: first parameter must be equal or less then second
some examples: 1,1 or 1,2 or 2,3 or even 5,5 and so on...
by increasing the parameters the indicator becomes less sensitive for buy and sell signals but will have high potential of becoming support or resistance line
by decreasing the parameters you can have more sensitive buy an sell signals which changes the color of the indicator.
MAVİLİMW İNDİKATÖRÜ TÜRKÇE ANLATIM VİDEO LİNK:
MavilimW indikatörün MTF (çoklu Zaman Aralıklı) versiyonu
YENİLİKLER:
1-HASSASİYETİ ARTIRILIP AZALTILABİLİR
2-TRADİNGVİEWDA ESKİ VERSİYON DA EKLENEBİLİR KUTUCUK İŞARETLENEREK
3-BELİRLEYECEĞİNİZ 2 PARAMETREYE GÖRE DEVAM EDEN FIBONACCI SERİSİNİ KENDİSİ OTOMATİK OLUŞTURUR.
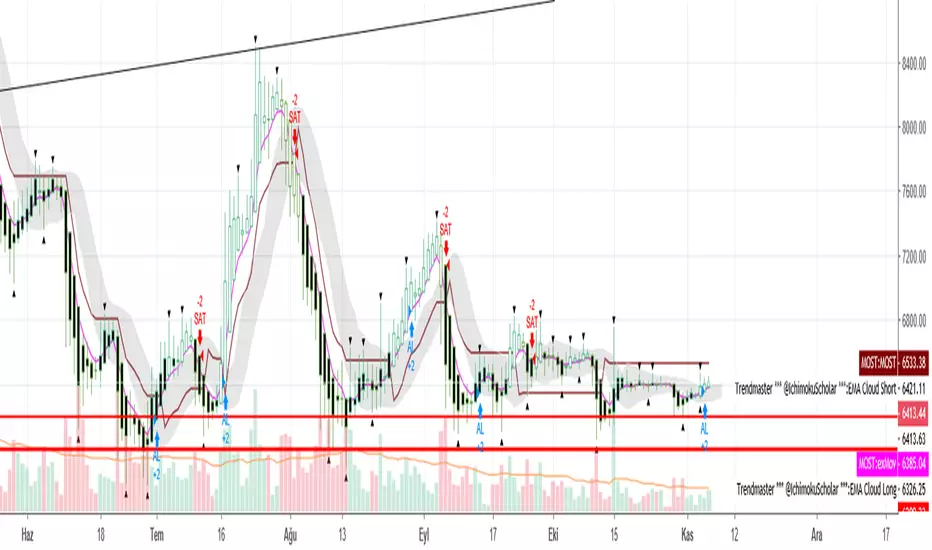
UVTrader StratejiIf you see "AL" you can buy, If you see "SAT" you can sell. You can use all charts, but 4 H and 1 D charts are very well..
Kıvanç HL by MaviliM0732Kıvanç HL indicator is a useful tool to define RESISTANCE and SUPPORT levels by analyzing previous HIGH and LOW levels od fibonacci lengths.
There are 3 lines HIGH, LOW and their exact average MID line.
Each line could be a significant support and resistance level due to the price action.
Breakouts are very important when supported by volume and new highs are expected when upward breakouts take place.
Version 2 has 4 more levels of lines calculated with Fibonacci constants between the HIGH and LOW lines.
Version 2 can be activated by cheching the box in the settings of the indicator.
Special thanks from me to MaviliM for developing such a great indicator and giving my name
creator: @mavilim0732 on twitter

Relative Estimated Price REP by KIVANÇ fr3762Relative Estimated Price (REP) Indicator shows the estimated price calculated if the tickerid made the same value changes (in %) during a certain period.
The default value of the lookback period is 50.
In the given XRPUSD chart you can see that XRPUSD has a value of 0.26480 and the RPC indicator shows the value of 0.38099.
This means that XRP would be 0.38099USD if it was fully made the same percentage moves with BTC , we can say that XRP is RELATIVELY cheap according to BTC price moves.
Conversely XRP would be RELATIVELY expensive if the last value of REP was lower then current XRP price.
users can choose the relative base price in calculation of REP between 1-5 which are:
1=BTCUSD, 2=ETHUSD, 3=EURTRY(Euro/Turkish Lira), 4=USDTRY (Dollar/Turkish Lira), 5=BIST100 (Istanbul Stock Exchange)
I personally advise you to use this indicator for daily charts in Tradingview to have more accurate estimated prices because of the website's calculation.
Developed by KIVANÇ

Squeeze Momentum Indicator mod#3 This is a corrected version of Squeeze Indicator that initially was authored by LazyBear and modified by KıvanÇ @fr3762 (twitter)
Indicator description: www.forextrading-pips.com
Interpretation:
When both the upper and lower Bollinger Bands go inside the Keltner Channel, the squeeze is on.
When the Bollinger Bands (BOTH lines) start to come out of the Keltner Channel, the squeeze has been released (off).
When one of the Bollinger Bands is out of Keltner Channel, no highlighting is done.
List of all my indicators: www.tradingview.com

