Futures Risk Manager (Futures)Risk management table for consistency trading.
Auto adjustable for MINI/MICRO based on your account.
can change RR shows SL and TP and amount to enter.
Please take note that you need to update every trade the stop tick and RR ratio.
Good luck in your trading journey.
在腳本中搜尋"Futures"

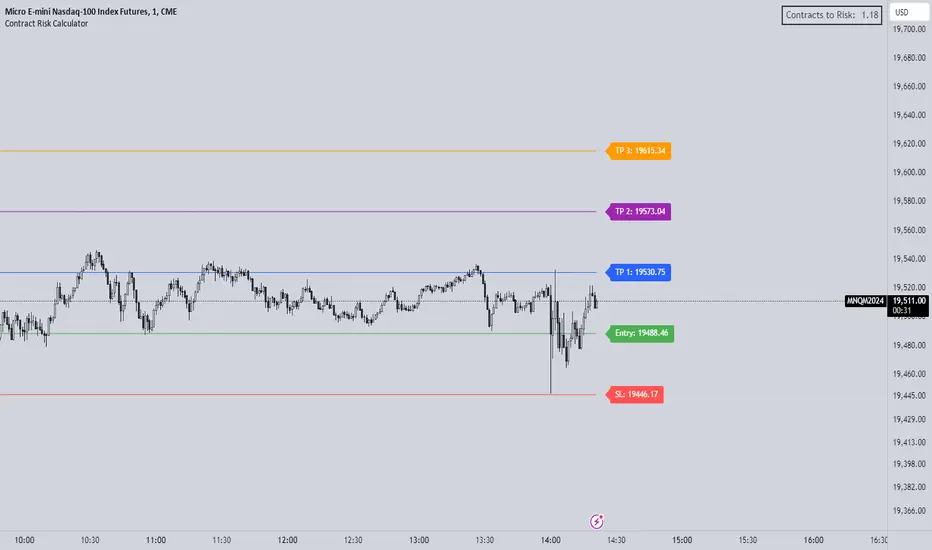
Futures Risk CalculatorThe "Futures Risk Calculator" is designed to assist traders in calculating the number of contracts to risk based on their account size, risk percentage, and stop loss level. This script provides a convenient way for traders to determine their position size in futures or other instruments where contracts are used.
The script prompts users to input their account size, risk percentage, entry price, and stop loss price. It then calculates the stop size in points, risk in dollars, and the number of contracts to risk. These calculations are based on standard risk management principles commonly used in trading.
The script plots the entry and stop loss lines on the chart for visual reference. Additionally, it displays a label in the top-right corner of the chart, showing the calculated number of contracts to risk. The label updates dynamically as the input values or market conditions change.
Originality and Usefulness:
This script is original and adds value to the TradingView community by providing traders with a practical tool for managing risk in their trading strategies. It is focusing on risk management, an essential aspect of successful trading.
By automating the calculation process, the script saves traders time and reduces the potential for manual errors. It encourages traders to adopt disciplined risk management practices, which are crucial for long-term profitability and capital preservation.
How to Use:
Input your account size, risk percentage, entry price, and stop loss price in the script settings.
Enter the pip size according to the instrument you are using (by default its's based for NASDAQ)
The script will automatically calculate the number of contracts to risk based on the provided inputs.
The entry and stop loss lines will be plotted on the chart for visual reference.
The calculated number of contracts to risk will be displayed in the top-right corner of the chart.
By following these steps, traders can effectively manage their risk exposure and make informed decisions when entering trades.
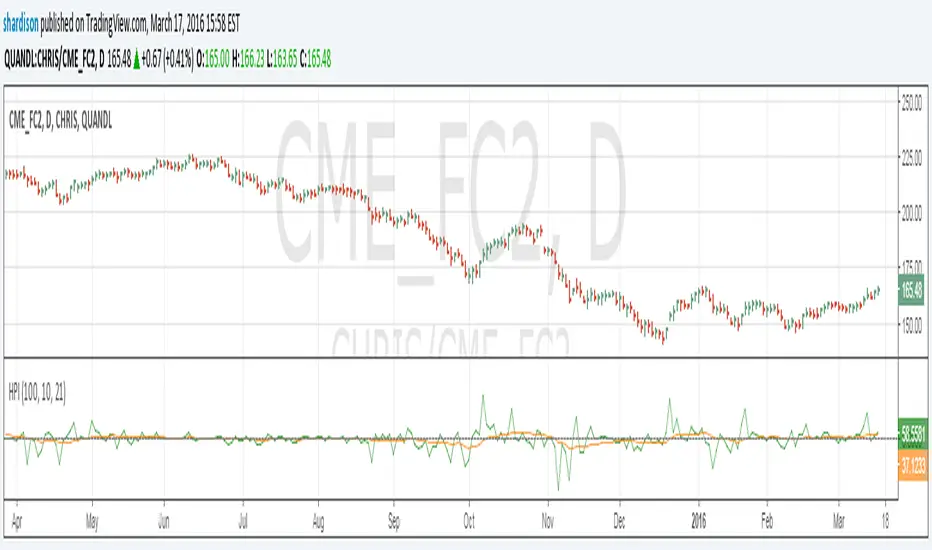
Herrick Payoff Index for Quandl DataUpdate to my previous Herrick Payoff Index script. This script pulls Quandl futures data with daily open interest. The prior version only used the weekly Commitment of Traders open interest data so could only be used on weekly bars. Note: Must use Quandl Symbol methodology in chart (i.e. enter symbol as QUANDL:CHRIS/CME_FC2, QUANDL:CME/FCX2016, ect.). Unfortunately, I haven't been able to program this to pull from the embedded futures data.
Canon's Futures Opening Prices Futures Opening Prices
Daily Open 6p.m
Midnight Open 12a.m
9:30a.m Equity Open
10a.m Open Candle

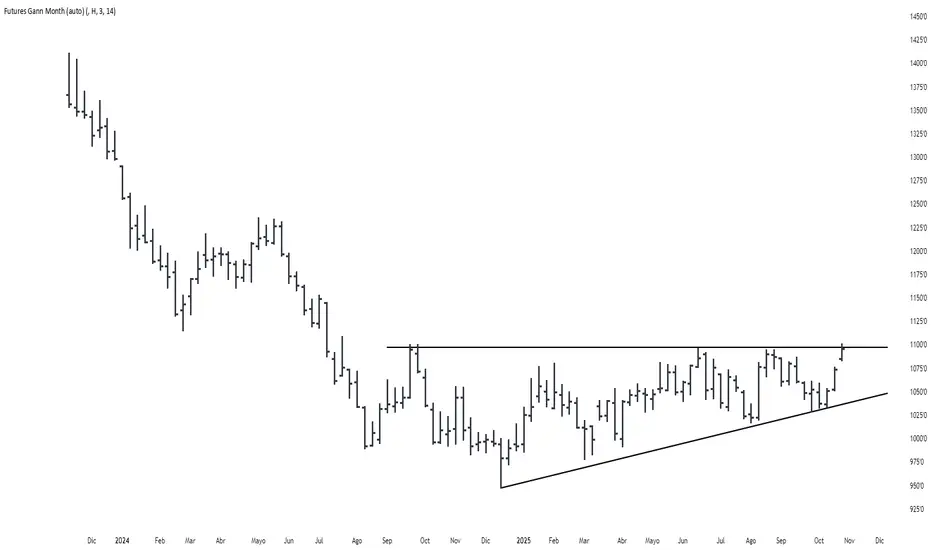
Futures Gann MonthBuilds a a continuous chart of the same month for a futures contract (e.g. ZSH2026).
This means such a chart consists of March '22, March '23, March '24, March '25, March '26...
The script goes back 20 years at most (depending on the current ticker selected in TradingView).

Futures Trade Entry Indicator (MTF)Work in Progress with the help of Claude. Not ready for active trading. Public for help improving. This will be a multi-timeframe futures trading indicator with supply/demand zones, Fair Value Gaps (FVGs), and sophisticated entry/exit logic.I've created a comprehensive Pine Script v6 indicator that matches all your specifications! Here's what the script includes:
## **Key Features Implemented:**
### **🔄 Multi-Timeframe Logic**
- **1H Chart Data**: Detects Supply Zones, Demand Zones, and Fair Value Gaps
- **Current Timeframe**: Monitors for re-entry and confirmation signals
### **📊 Zone Detection**
- **Supply Zones**: Identified using pivot highs with configurable strength
- **Demand Zones**: Identified using pivot lows with touch validation
- **Fair Value Gaps**: Both bullish and bearish FVGs detected automatically
- **Auto-Expiry**: Zones expire after 24 hours (configurable)
### **⚡ Entry Logic**
- **Dual Confirmation Required**:
- ✅ Engulfing candle pattern (bullish/bearish)
- ✅ Market structure shift (HH→LL or LL→HH)
- **Zone Re-entry**: Price must be within identified zones/FVGs
### **🎯 Probability System**
- **Smart Scoring**: Based on zone age, strength, and risk/reward ratio
- **Color-Coded**: Green (High), Yellow (Medium), Red (Low)
- **Real-time Calculation**: Updates with each potential entry
### **🎨 Visual Elements**
- **Colored Zones**: Supply (red), Demand (green), FVGs (blue/orange)
- **Entry Labels**: 🟩 LONG / 🟥 SHORT markers
- **Probability Labels**: Display confidence levels
- **Confirmation Shapes**: Triangle indicators for pattern completion
### **⚙️ Manual Controls**
All the requested toggles are available in the settings panel:
- Show/Hide Supply Zones
- Show/Hide Demand Zones
- Show/Hide FVGs
- Show/Hide Labels
- Show/Hide Probability
- Zone strength and expiry settings
- Custom colors for all elements
### **🔔 Alert System**
- Entry opportunity alerts
- Includes probability assessment
- Ticker symbol identification
## **Usage Instructions:**
1. **Apply to 15m chart** for active trading signals
2. **Configure settings** based on your preferences
3. **Set up alerts** for automated notifications
4. **Monitor probability levels** for trade quality assessment
The script automatically handles the complex multi-timeframe analysis while keeping the interface clean and user-friendly. All zones update dynamically and expire appropriately to avoid clutter.
Would you like me to adjust any specific parameters or add additional features?

Futures Daily Settlement PricesDaily settlement prices reflect the fair market value of the underlying commodity or financial instrument, as determined by buyers and sellers during the settlement period or “close”. The price quoted in the evening news for items like a bush of corn, a barrel of crude oil, or a 10-year U.S. Treasury note frequently use the settlement price for the corresponding futures product that day.
Settlement prices are used to mark traders’ positions to market daily, determining profits or losses. Daily settlement prices play a key role in facilitating price discovery, risk management, and market integrity.
This indicator plots up to 30 settlement prices as well as the date of settlement on your chart, on time frames under 1 hour.
Customizable line types, colors, and label colors.

Futures All List / Sell SignalAs of May 2023, there are more than 180 usdt perpetual coins on the binance futures exchange. These coins are included in the indicator in lists of 40. They are sorted instantly in the table from largest to smallest. The sorting style can be changed in the indicator settings. This indicator collects RSI and TSI values at desired values. The result has a maximum value of 600. A value of 600 signals that the price will decrease or remain stable for a certain period of time. Generally, a short can be expected from the closest point to 600. If 3 separate lists are selected by using 3 of these indicators, 120 coins can be analyzed at the same time. Available in all time zones. Examine it in a 3-minute timeframe. The line inside the indicator draws the instantaneous values of the relevant coin.

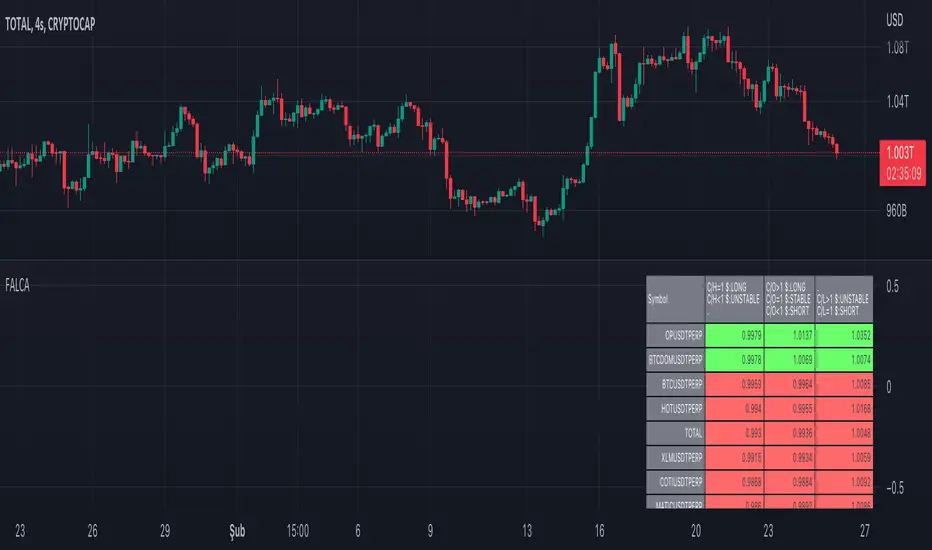
Futures All List Candle Analysis - FALCAIn this command; There is an alphabetical list of USDS-M coins with the USDT PERP extension on the Binance Futures side.
There are 13 lists in total. Each list contains 39 data. Due to data limitation, 13 lists are formed. There are 13 coins in the first 11 of the lists. The 12th list contains 3 coins. The last list (FAVORITE LIST) is CRYPTOCAP:TOTAL, BINANCE:BTCUSDTPERP, BINANCE:BTCDOMUSDTPERP as standard. You must add 10 coins to the final list.
The lists show data for the time period you selected.
Explanation of the (C/H) header: Close /High takes a maximum value of 1. As long as this value is 1, a price increase is observed.
Explanation of the (C/O) header:
Close /Open can be greater than ,1. In this case, a price increase is observed.
Close /Open can be less than 1. In this case, a price decrease is observed.
The value Close /Open can be equal to 1. In this case, price stability is observed.
Explanation of the (C/L) header: Close /Low takes a minimum value of 1. As long as this value is 1, a price decrease is observed.
Coins with a price decrease are shown in red.
Coins with a price increase will turn green.
***NOTE: For this command to work, you must first add 10 favorite coins to the "FAVORITE LIST".


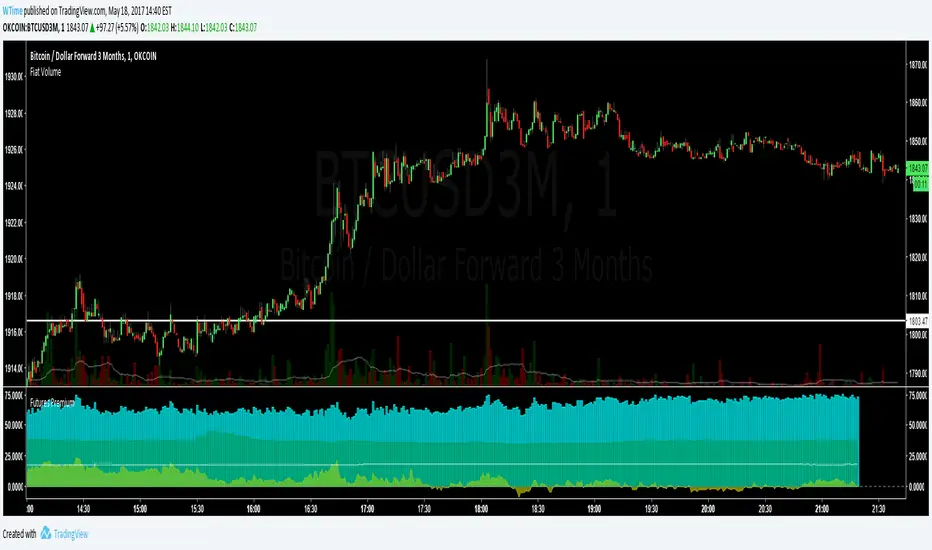
Futures & GBTC PremiumCalculates current Okcoin futures index price, and plots the current premiums for weekly and quarterly contracts. Also plots the GBTC premium divided by 10 based on the same index price. For reference, the calculated index price divided by 100 is also shown (the white line).
Note:
The index price is an estimate, and not entirely accurate because of the following limitations:
GDAX, one of the six exchanges that makes up the index, is not available on TW. Coinbase is used instead, as their prices are usually within $2 of GDAX
CNYUSD rate in the index is usually calculated every Friday, but follows some special rules that are impossible to replicate in this script. The current CNYUSD rate is used instead
,
The index price in this script has been within $2 of the actual index the past day.
GRID EXTENSIONGRID EXTENSION
Overview
The GRID EXTENSION is a simple grid-based indicator for TradingView, built with Pine Script v6. It plots horizontal price levels starting from a user-defined anchor price, with spacing set by a tick increment. Use it to identify key support, resistance, or price zones on charts for Crypto, Forex, or Futures.
Key Features
Custom Grid Levels: Plot up to 22 levels (e.g., 0, 0.25, 1.25, -2.50) with options to show/hide, set values, and choose colors.
Market-Specific Tick Increments: Select your asset type (Crypto, Forex, Futures) and choose from a range of tick increments tailored for each market:
Crypto: 1 to 5000 ticks (e.g., 100 ticks = $0.001 on ADA/USD, 5000 ticks = $50 on BTC/USD).
Forex: 5 to 5000 ticks (e.g., 100 ticks = 1 pip on EUR/USD, 5000 ticks = 50 pips).
Futures: 1 to 2500 ticks (e.g., 25 ticks = 6.25 points on E-mini S&P 500, $312.50 per contract).
Visual Options:
Extend lines to the right.
Show price and level labels (as values or percentages).
Place labels on the left or right.
Adjust background transparency for filled areas between levels.
How to Use
Set Asset Type: Choose "Crypto," "Forex," or "Futures" to match your chart.
Set Anchor Price: Enter a starting price for the grid.
Pick Tick Increment: Select a tick increment from the dropdown, following the guidance for your asset type (see Key Features).
Customize Levels: Turn levels on/off, set values, and pick colors.
Add to Chart: Apply the indicator to see the grid on your chart.
Tips
Use levels to mark support/resistance zones for entries or exits.
Extend lines to project future price zones.
Choose smaller increments (e.g., 5 ticks) for scalping, or larger ones (e.g., 1000 ticks) for swing trading.
Combine with indicators like moving averages for better signals.
Settings
Asset Type: Select "Crypto," "Forex," or "Futures" (default: "Crypto").
Anchor Price: Starting price for the grid (default: 0.0).
Tick Increment: Space between levels (options: 1, 5, 10, 25, 50, 100, 250, 500, 1000, 2500, 5000). Choose based on asset type.
Extend Right: Extend lines to the right (default: true).
Show Prices: Show price labels (default: true).
Show Levels: Show level values or percentages (default: true).
Format: Display levels as "Values" or "Percent" (default: "Values").
Labels Position: Place labels on "Left" or "Right" (default: "Left").
Background Transparency: Set transparency for filled areas (default: 100, range 0-100).
Level Options: Enable/disable levels, set values, and choose colors.
Notes
Set the anchor price to a key level (like a recent high or low) for best results.
Check the tick increment tooltip to ensure the spacing suits your market type.
Works on any chart, best for clear price trends or ranges.
Acknowledgments
Made with Pine Script v6 for TradingView. This is v1.0—feedback welcome for future updates!

LTA - Futures Contract Size CalculatorLTA - Futures Contract Size Calculator
This indicator helps futures traders calculate the potential stop-loss (SL) value for their trades with ease. Simply input your entry price, stop-loss price, and number of contracts, and the indicator will compute the ticks moved, price movement, and total SL value in USD.
Key Features:
Supports a wide range of futures contracts, including:
Index Futures: E-mini S&P 500 (ES), Micro E-mini S&P 500 (MES), E-mini Nasdaq-100 (NQ), Micro E-mini Nasdaq-100 (MNQ)
Commodity Futures: Crude Oil (CL), Gold (GC), Micro Gold (MGC), Silver (SI), Micro Silver (SIL), Platinum (PL), Micro Platinum (MPL), Natural Gas (NG), Micro Natural Gas (MNG)
Bond Futures: 30-Year T-Bond (ZB)
Currency Futures: Euro FX (6E), Japanese Yen (6J), Australian Dollar (6A), British Pound (6B), Canadian Dollar (6C), Swiss Franc (6S), New Zealand Dollar (6N)
Displays key metrics in a clean table (bottom-right corner):
Instrument, Entry Price, Stop-Loss Price, Number of Contracts, Tick Size, Ticks Moved, Price Movement, and Total SL Value.
Automatically calculates based on the selected instrument’s tick size and tick value.
User-friendly interface with a dark theme for better visibility.
How to Use:
Add the indicator to your chart.
Select your instrument from the dropdown (ensure it matches your chart’s symbol, e.g., "NG1!" for NATURAL GAS (NG)).
Input your Entry Price, Stop-Loss Price, and Number of Contracts.
View the results in the table, including the Total SL Value in USD.
Ideal For:
Futures traders looking to quickly assess stop-loss risk.
Beginners and pros trading indices, commodities, bonds, or currencies.
Note: Ensure your chart symbol matches the selected instrument for accurate calculations. For best results, test with a few contracts and price levels to confirm the output.
This description is tailored for TradingView’s audience, providing a clear overview of the indicator’s functionality, supported instruments, and usage instructions. It also includes a note to help users avoid common pitfalls (e.g., mismatched symbols). If you’d like to adjust the tone, add more details, or include specific TradingView tags (e.g., , ), let me know!

Next Candle PredictorAdvanced TradingView Indicator for Precise Buy and Sell Signals
Overview:
The Predicta Futures - Next Candle Predictor is a cutting-edge TradingView indicator designed to forecast the next candle's direction in futures and cryptocurrency markets. Leveraging a multi-indicator confluence strategy, this tool provides traders with actionable long and short prediction percentages, enhanced by dynamic ADX-based thresholds and visual projection candles. Ideal for scalping, day trading, or swing trading on platforms like MEXC or Binance futures, it combines Supertrend, MACD, RSI, Stochastic, ADX, and volume analysis to deliver high-probability buy and sell signals while minimizing false positives.
Key Features:
* Multi-Indicator Confluence Scoring: Integrates Supertrend for trend direction, EMAs (8, 21, 50) for alignment, MACD for momentum crossovers, RSI for overbought/oversold conditions, Stochastic for divergence detection, ADX for trend strength, and volume ratios for confirmation. A customizable confluence score (0-6) ensures signals meet user-defined criteria, reducing whipsaws in volatile markets.
* Dynamic Prediction Thresholds: ADX-driven adjustments lower the required prediction percentage (e.g., 60% in strong trends) for "PERFECT TIME" entries, adapting to market conditions like ranging or trending phases.
* Visual Analysis Table: A sleek, color-coded dashboard displays progress bars for each indicator, prediction percentages, and status (e.g., "PERFECT TIME" or "WAIT"). Supports long and short analyses with intuitive ASCII bars for quick scans.
* Projection Candles: Simulates potential next-candle outcomes with volatility-scaled (via Bollinger Bands width) green long and red short candles, aiding in visualizing price targets.
Buy/Sell Signals and Alerts: Generates labeled "BUY" and "SELL" arrows on EMA crossovers within confirmed trends, with separate alerts for basic signals and high-confluence "PERFECT TIME" opportunities.
* Customizable Inputs: Adjust ATR periods, Supertrend factors, minimum confluence scores, and volume ratios to tailor the indicator for stocks, forex, or crypto perpetual futures.
How It Works:
This TradingView script calculates long and short scores using weighted contributions from key indicators, normalizing them into prediction percentages. A confluence check—factoring trend, EMA alignment, MACD, Stochastic, volume, and ADX—triggers "PERFECT TIME" only when conditions align robustly. For example:
In a downtrend (Supertrend red), with bearish MACD and Stochastic, and sufficient volume, the indicator highlights short opportunities.
Dynamic thresholds ensure aggressive entries in strong trends (ADX >25) and conservative ones in weak trends.
Backtested for reliability, it excels in identifying reversals and continuations, making it a must-have for traders seeking an edge in futures trading strategies.
Usage Instructions:
1. Add the indicator to your TradingView chart.
2. Customize settings via the inputs panel (e.g., set minConfluence to 5 for stricter signals).
3. Monitor the analysis table for predictions and confluence scores.
4. Act on "BUY/SELL" labels or "PERFECT TIME" alerts, combining with your risk management.
5. Enable projection candles for visual forecasting of the next bar.
Compatible with all timeframes, from 1-minute scalping to daily swings. Note: This is not financial advice; always verify signals with additional analysis.
Rate and review if it boosts your trades!
Thank you!

True Seasonal Pattern [tradeviZion]True Seasonal Pattern: Uncover Hidden Market Cycles
Markets have rhythms and patterns that repeat with surprising regularity. The True Seasonal Pattern indicator reveals these hidden cycles across different timeframes, helping you anticipate potential market movements based on historical seasonal tendencies.
What This Indicator Does
The True Seasonal Pattern analyzes years of historical price data to identify recurring seasonal trends. It then plots these patterns on your chart, showing you both the historical pattern and future projection based on past seasonal behavior.
Automatic Timeframe Detection: Works with Monthly, Weekly, and Daily charts
Historical Pattern Analysis: Analyzes up to 100 years of data (customizable)
Future Projection: Projects the seasonal pattern ahead on your chart
Smart Smoothing: Applies appropriate smoothing based on your timeframe
How to Use This Indicator
Add the indicator to a Daily, Weekly, or Monthly chart (not designed for intraday timeframes)
The indicator automatically detects your chart's timeframe
The blue line shows the historical seasonal pattern
Watch for potential turning points in the pattern that align with other technical signals
Seasonal patterns work best as a supporting factor in your analysis, not as standalone trading signals. They are particularly effective in markets with well-established seasonal influences.
Best Applications
Futures Markets: Commodities and futures often show strong seasonal tendencies due to production cycles, weather patterns, and economic factors
Stock Indices: Many stock markets demonstrate regular seasonal patterns (like the "Sell in May" phenomenon)
Individual Stocks: Companies with seasonal business cycles often show predictable price patterns
Practical Applications
Identify potential turning points based on historical seasonal patterns
Plan entries and exits around seasonal tendencies
Add seasonal context to your existing technical analysis
Understand why certain months or periods might show consistent behavior
Pro Tip: For best results, use this tool on instruments with at least 5+ years of historical data. Longer timeframes often reveal more reliable seasonal patterns.
Important Notes
This indicator works best on Daily, Weekly, and Monthly timeframes - not intraday charts
Seasonal patterns are tendencies, not guarantees
Always combine seasonal analysis with other technical tools
Past patterns may not repeat exactly in the future
// Sample of the seasonal calculation approach
float yearHigh = array.max(currentYearHighs)
float yearLow = array.min(currentYearLows)
// Calculate seasonality for each period
for i = 0 to array.size(currentYearCloses) - 1
float periodClose = array.get(currentYearCloses, i)
if not na(periodClose) and yearHigh != yearLow
float seasonality = (periodClose - yearLow) / (yearHigh - yearLow) * 100
I developed this indicator to help traders incorporate seasonal analysis into their trading approach without the complexity of traditional seasonal tools. Whether you're analyzing agricultural commodities, energy futures, or stock indices, understanding the seasonal context can provide valuable insights for your trading decisions.
Remember: Markets don't always follow seasonal patterns, but when they do, being aware of these tendencies can give you a meaningful edge in your analysis.

Next Candle PredictorAdvanced TradingView Indicator for Precise Buy and Sell Signals
Overview:
The Predicta Futures - Next Candle Predictor is a cutting-edge TradingView indicator designed to forecast the next candle's direction in futures and cryptocurrency markets. Leveraging a multi-indicator confluence strategy, this tool provides traders with actionable long and short prediction percentages, enhanced by dynamic ADX-based thresholds and visual projection candles. Ideal for scalping, day trading, or swing trading on platforms like MEXC or Binance futures, it combines Supertrend, MACD, RSI, Stochastic, ADX, and volume analysis to deliver high-probability buy and sell signals while minimizing false positives.
Key Features:
• Multi-Indicator Confluence Scoring:
Integrates Supertrend for trend direction, EMAs (8, 21, 50) for alignment, MACD for momentum crossovers, RSI for overbought/oversold conditions, Stochastic for divergence detection, ADX for trend strength, and volume ratios for confirmation. A customizable confluence score (0-6) ensures signals meet user-defined criteria, reducing whipsaws in volatile markets.
• Dynamic Prediction Thresholds:
ADX-driven adjustments lower the required prediction percentage (e.g., 60% in strong trends) for "PERFECT TIME" entries, adapting to market conditions like ranging or trending phases.
• Visual Analysis Table:
A sleek, color-coded dashboard displays progress bars for each indicator, prediction percentages, and status (e.g., "PERFECT TIME" or "WAIT"). Supports long and short analyses with intuitive ASCII bars for quick scans.
• Projection Candles:
Simulates potential next-candle outcomes with volatility-scaled (via Bollinger Bands width) green long and red short candles, aiding in visualizing price targets.
• Buy/Sell Signals and Alerts:
Generates labeled "BUY" and "SELL" arrows on EMA crossovers within confirmed trends, with separate alerts for basic signals and high-confluence "PERFECT TIME" opportunities.
• Customizable Inputs:
Adjust ATR periods, Supertrend factors, minimum confluence scores, and volume ratios to tailor the indicator for stocks, forex, or crypto perpetual futures.
How It Works:
This TradingView script calculates long and short scores using weighted contributions from key indicators, normalizing them into prediction percentages. A confluence check—factoring trend, EMA alignment, MACD, Stochastic, volume, and ADX—triggers "PERFECT TIME" only when conditions align robustly. For example:
• In a downtrend (Supertrend red), with bearish MACD and Stochastic, and sufficient volume, the indicator highlights short opportunities.
• Dynamic thresholds ensure aggressive entries in strong trends (ADX >25) and conservative ones in weak trends.
• Backtested for reliability, it excels in identifying reversals and continuations, making it a must-have for traders seeking an edge in futures trading strategies.
Usage Instructions:
1. Add the indicator to your TradingView chart. (Search: Next Candle Predictor)
2. Customize settings via the inputs panel (e.g., set minConfluence to 5 for stricter signals).
3. Monitor the analysis table for predictions and confluence scores.
4. Act on "BUY/SELL" labels or "PERFECT TIME" alerts, combining with your risk management.
5. Enable projection candles for visual forecasting of the next bar.
Compatible with all timeframes, from 1-minute scalping to daily swings. Note: This is not financial advice; always verify signals with additional analysis.
Join thousands of traders enhancing their strategies—add it to your charts today and elevate your trading performance!
Please rate and review if it boosts your trades!
Thank you!

NQ Hourly Retracements - 12y Stats with LevelsHour Stats with Levels - TradingView Indicator Description
IMPORTANT: NQ FUTURES ONLY
This indicator is specifically designed for and calibrated to NQ (Nasdaq-100 E-mini) futures only. The statistical data is derived exclusively from 13 years of NQ price action (2013-2025). Do not use this indicator on any other asset, ticker, or market as the statistics will not be applicable and may lead to incorrect trading decisions.
Overview
"Hour Stats with Levels" is a statistical analysis indicator that provides real-time probability-based insights into hourly price behavior patterns. The indicator combines historical pattern recognition with live price action to help traders anticipate potential sweep and reversal scenarios within each trading hour.
Originality and Core Concept
This indicator is based on a comprehensive statistical analysis of 12y years of 1-minute NQ futures data, examining a specific price pattern: when an hourly candle opens inside the previous hour's range. Unlike generic support/resistance indicators, this tool provides hour-specific, context-aware probabilities based on 30,000+ historical occurrences of this pattern.
The originality lies in three key areas:
Pattern-Specific Statistics: Rather than applying generic technical analysis, the indicator only activates when the current hour opens within the previous hour's range, providing relevant statistics for this exact scenario.
Context-Aware Probabilities: Statistics are differentiated based on whether the current hour opened above or below the previous hour's open, recognizing that bullish and bearish opening contexts produce different behavioral patterns.
Comprehensive Retracement Tracking: The indicator tracks four independent retracement levels after a sweep occurs, showing the probability of price returning to: the swept level itself (90+% probability), the 50% level, the current hour's open, and the opposite extreme.
How It Works
The Core Pattern
The indicator monitors a specific price structure:
Setup Condition: The current hourly candle opens inside (between) the previous hour's high and low
Sweep Event: Price then breaks above the previous high (high sweep) or below the previous low (low sweep)
Retracement Analysis: After a sweep, the indicator tracks whether price retraces to key levels
Statistical Foundation
The underlying analysis processed 1-minute bar data from 2013-2025, identifying every instance where an hourly candle opened inside the previous hour's range. For each occurrence, the system tracked:
Whether the high, low, or both were swept during that hour
The distance of the sweep measured as a percentage of the previous hour's range
Whether price retraced to four key levels: the swept level, the 50% point, the current open, and the opposite extreme
These measurements were aggregated for all 24 hours of the trading day, with separate statistics for bullish contexts (opening above previous open) and bearish contexts (opening below previous open), creating 48 unique statistical profiles.
Sweep Distance Percentiles
The "reversal levels" are drawn based on historical sweep distance distributions:
25th Percentile: 75% of historical sweeps were larger than this distance. This represents a conservative reversal zone where smaller, contained sweeps typically reverse.
Median (50th Percentile): The midpoint of all historical sweep distances. Half of all sweeps reversed before reaching this level, half extended beyond it.
75th Percentile: Only 25% of sweeps extended beyond this distance. This represents an extended sweep zone where price has historically shown exhaustion.
For example, if the previous hour's range was 20 points and the median high sweep distance is 40% of range, the median reversal level would be placed 8 points above the previous high.
How to Use the Indicator
Sweeps were calculated using 1m data - as such, it's recommended to use the indicator on a 1min chart
Visual Components
Hour Delimiter (Gray Vertical Line)
Marks the start of each new hour
Helps identify when new statistics become active
Sweep Markers
Green "H" label: High sweep has occurred this hour
Red "L" label: Low sweep has occurred this hour
Markers appear on the exact bar where the sweep happened
Target Levels (Blue Lines)
Prev Open: Previous hour's opening price
Prev High: Previous hour's highest price (sweep target)
Prev Low: Previous hour's lowest price (sweep target)
Prev 50%: Midpoint of previous hour's range
Current Open: Current hour's opening price (key retracement target)
Reversal Levels (Purple Dashed Lines)
Positioned beyond the previous high/low based on historical sweep percentiles
Three levels above previous high (for high sweeps)
Three levels below previous low (for low sweeps)
These represent statistically-derived zones where sweeps typically exhaust
The Statistics Table
The table dynamically updates each hour and displays different statistics based on whether the current hour opened above or below the previous hour's open.
Status Row
Shows current state: waiting for sweep, or which sweep(s) have occurred
If waiting, indicates which sweep is more probable based on historical data
SWEEP PROBABILITIES Section
High Sweep: Historical probability (%) that price will sweep the previous high this hour
Low Sweep: Historical probability (%) that price will sweep the previous low this hour
Both Sweeps: Historical probability (%) that price will sweep both levels this hour
These probabilities are derived from counting how many times each pattern occurred in similar historical contexts. For example, "High Sweep: 73.18%" means that in 73.18% of historical occurrences where the hour opened in this same context (same hour of day, same position relative to previous open), price swept the previous high before the hour closed.
AFTER HIGH SWEEP → Section
These statistics activate only after a high sweep has occurred. They show the probability of price retracing to various levels:
→ Prev High: Probability that price returns to (or below) the level it just swept. This is typically 90%+ because sweeps often act as "false breakouts" or liquidity grabs before reversal.
→ 50% Level: Probability that price retraces at least halfway back into the previous hour's range. This represents a moderate retracement.
→ Current Open: Probability that price retraces all the way back to where the current hour opened. This indicates a complete reversal of the sweep move.
→ Prev Low: Probability that price retraces entirely through the previous range to touch the opposite extreme. This represents a full reversal pattern.
AFTER LOW SWEEP → Section
Mirror of the above, but for low sweeps:
→ Prev Low: Retracement to the swept low level (90%+ probability)
→ 50% Level: Retracement to middle of range
→ Current Open: Full retracement to current hour's open
→ Prev High: Complete reversal to opposite extreme
Important Note on Retracement Statistics: These percentages are tracked independently. A 90% probability of returning to the swept level doesn't mean there's only a 10% chance of deeper retracement. Price can (and often does) retrace through multiple levels sequentially. The percentages show how many times price reached at least that level, not where it stopped.
Trading Applications
Anticipating Sweeps
When an hour opens inside the previous range, check the probabilities. If "High Sweep: 70%" and "Low Sweep: 30%", you know there's a 70% historical likelihood of an upside sweep occurring this hour. This doesn't guarantee it will happen, but provides statistical context for potential setups.
Reversal Trading
The most reliable pattern in the data is the 90%+ retracement probability to swept levels. When a sweep occurs, traders can anticipate a retracement back to at least the swept level in the vast majority of cases. The reversal level percentiles help identify where sweeps may exhaust.
Position Management
The retracement probabilities help manage existing positions. For example, if you're long and a high sweep occurs, you know there's a 90%+ chance of at least some retracement to the swept level, which might inform profit-taking or stop-loss decisions.
Confluence with Current Open
The "Current Open" retracement statistics (typically 60-70%) highlight the magnetic quality of the hour's opening price. After a sweep, price frequently returns to test this level.
Customization Options
The indicator offers extensive visual customization:
Toggle on/off: hour delimiters, sweep markers, target levels, reversal levels, statistics table
Customize colors, line widths, and styles for all visual elements
Adjust label sizes and table position
Show/hide individual target levels and reversal percentiles
Limitations and Considerations
Pattern-Specific: The indicator only provides statistics when the current hour opens inside the previous hour's range. If the hour opens outside this range (gaps up or down), the statistics are not applicable.
Historical Probabilities: The percentages represent historical frequencies, not predictions. A 70% probability means it happened 70% of the time historically, not that it will definitely happen 7 out of 10 times going forward.
NQ-Specific Calibration: All statistics are derived from NQ futures data. Market behavior, volatility, and patterns differ across assets.
Hour-Specific Behavior: Different hours show dramatically different statistics. For example, the 9 AM EST hour (market open) shows much higher sweep probabilities (80%+) than the 5 PM EST hour (30-50%) due to differing liquidity and volatility conditions.
No Guarantee of Execution: While a 90% retracement probability is high, it means 10% of the time, price did NOT retrace. Always use proper risk management.
Technical Notes
The indicator uses hourly timeframe data via request.security() to determine previous hour values
Sweep detection occurs in real-time on the chart's timeframe
Statistics are hardcoded from the comprehensive backtested analysis (not calculated on-the-fly)
The indicator stores static values at the start of each hour to ensure consistency as the hour progresses
All percentage values are rounded to one decimal place for clarity
This indicator provides a statistically-grounded framework for understanding hourly price behavior in NQ futures. By combining real-time pattern detection with comprehensive historical analysis, it offers traders probabilistic insights to inform decision-making process within the specific context of each trading hour.

Bull Flag DetectionThe FuturesGod bull flag indicator aims to identify the occurrence of bull flags.
Bull flags are a popular trading pattern that allows users to gauge long entries into a given market. Flags consist of a pole that is followed by either a downward or sideways consolidation period.
This script can be used on any market but was intended for futures (NQ, ES) trading on the intraday timeframe.
The script does the following:
1. Identifies the occurrence of a flag pole. This is based on a lookback period and percentage threshold decided by the user.
2. Marks the consolidation area after the pole occurrence using swing highs and swing lows.
3. Visually the above is represented by a shaded green area.
4. When a pole is detected, it is marked by a downward off-white triangle. Note that if the percentage threshold is reached several times on the same upward climb, the script will continue to identify points where the threshold for pole detection is met.
5. Also visualized are the 20, 50 and 200 period exponential moving averages. The area between the 20 and 50 EMAs are shaded to provide traders a visual of a possible support area.

Currency Futures StatisticsThe "Currency Futures Statistics" indicator provides comprehensive insights into the performance and characteristics of various currency futures. This indicator is crucial for portfolio management as it combines multiple metrics that are instrumental in evaluating currency futures' risk and return profiles.
Metrics Included:
Historical Volatility:
Definition: Historical volatility measures the standard deviation of returns over a specified period, scaled to an annual basis.
Importance: High volatility indicates greater price fluctuations, which translates to higher risk. Investors and portfolio managers use volatility to gauge the stability of a currency future and to make informed decisions about risk management and position sizing (Hull, J. C. (2017). Options, Futures, and Other Derivatives).
Open Interest:
Definition: Open interest represents the total number of outstanding futures contracts that are held by market participants.
Importance: High open interest often signifies liquidity in the market, meaning that entering and exiting positions is less likely to impact the price significantly. It also reflects market sentiment and the degree of participation in the futures market (Black, F., & Scholes, M. (1973). The Pricing of Options and Corporate Liabilities).
Year-over-Year (YoY) Performance:
Definition: YoY performance calculates the percentage change in the futures contract's price compared to the same week from the previous year.
Importance: This metric provides insight into the long-term trend and relative performance of a currency future. Positive YoY performance suggests strengthening trends, while negative values indicate weakening trends (Fama, E. F. (1991). Efficient Capital Markets: II).
200-Day Simple Moving Average (SMA) Position:
Definition: This metric indicates whether the current price of the currency future is above or below its 200-day simple moving average.
Importance: The 200-day SMA is a widely used trend indicator. If the price is above the SMA, it suggests a bullish trend, while being below indicates a bearish trend. This information is vital for trend-following strategies and can help in making buy or sell decisions (Bollinger, J. (2001). Bollinger on Bollinger Bands).
Why These Metrics are Important for Portfolio Management:
Risk Assessment: Historical volatility and open interest provide essential information for assessing the risk associated with currency futures. Understanding the volatility helps in estimating potential price swings, which is crucial for managing risk and setting appropriate stop-loss levels.
Liquidity and Market Participation: Open interest is a critical indicator of market liquidity. Higher open interest usually means tighter bid-ask spreads and better liquidity, which facilitates smoother trading and better execution of trades.
Trend Analysis: YoY performance and the SMA position help in analyzing long-term trends. This analysis is crucial for making strategic investment decisions and adjusting the portfolio based on changing market conditions.
Informed Decision-Making: Combining these metrics allows for a holistic view of the currency futures market. This comprehensive view helps in making informed decisions, balancing risks and returns, and optimizing the portfolio to align with investment goals.
In summary, the "Currency Futures Statistics" indicator equips investors and portfolio managers with valuable data points that are essential for effective risk management, liquidity assessment, trend analysis, and overall portfolio optimization.
