MJBFX-Strategy (Futures Optimized)The MJBFX-Strategy is a complete market mapping tool designed to give traders a clear view of liquidity, session dynamics, and premium/discount levels. It loads automatically on any chart, fully optimized for futures and forex trading.
🔑 Key Features
Asian Session Range
Highlights the previous Asian session with a shaded box
Fixed until London open for precise reference
VWAP from Asian Session
Plots the VWAP of the previous Asian session
Dynamic fair value benchmark for intraday trading
Liquidity Sweeps (Optimized)
Detects sweeps of the Asian session high/low
Shown only on 30m, 1h, and 4h charts to reduce noise
Clean, minimal labels for clarity
Automatic Fibonacci Zone
Draws a shaded retracement zone (38.2%–61.8%) of the Asian range
Transparent fill makes it easy to read price action
Killzones
Highlights London (07:00–10:00) and New York (13:00–16:00) killzones
Semi-opaque shading to keep charts clean
Auto Trade Box (Risk/Reward)
On sweep confirmation, plots a 2R target box
Auto stop loss and take profit levels based on futures tick size
🎯 Why Use It?
The MJBFX-Strategy removes the need for manual drawing.It automatically maps:
Session highs and lows
Liquidity sweeps
VWAP and fib retracement zones
Key killzones
Perfect for session-based intraday trading in both futures and forex.
⚡ No manual settings required.Just load it onto your chart for an instant institutional view of the market.
在腳本中搜尋"Futures"

NQ Position Size CalculatorNQ Position Size Line Calculator is designed specifically for Nasdaq 100 futures (NQ) and micro futures (MNQ) traders who want to maintain disciplined risk management. This visual tool eliminates the guesswork from position sizing by displaying distance lines and contract calculations directly on your chart.
The indicator creates horizontal lines at 10-tick intervals from your stop loss level, showing you exactly how many contracts to trade at each distance to maintain your predetermined risk amount. Whether you're trading regular NQ contracts or micro MNQ contracts, this calculator ensures you never risk more than intended while providing instant visual feedback for optimal position sizing decisions.
How to Use the Indicator
Step 1: Configure Your Settings
Stop Loss Price: Enter your exact stop loss level (e.g., 20000.00)
Risk Amount ($): Set your maximum dollar risk per trade (e.g., $500)
Contract Type: Choose between:
NQ (Regular): $5 per tick - for larger accounts
MNQ (Micro): $0.50 per tick - for smaller accounts or conservative sizing
Display Options:
Max Lines: Number of distance lines to show (default: 30)
Show Labels: Toggle tick distance and contract count labels
Line Color: Customize the color of distance lines
Label Size: Choose tiny, small, or normal label sizes
Step 2: Read the Visual Display
Once configured, the indicator displays:
Stop Loss Line:
Thick yellow line marking your exact stop loss level
Yellow label showing the stop loss price
Distance Lines:
Dashed red lines at 10-tick intervals above and below your stop loss
Lines appear on both sides for long and short position planning
Labels (if enabled):
Green labels (right side): For long positions above your stop loss
Red labels (left side): For short positions below your stop loss
Format: "20T 5x" means 20 ticks distance, 5 contracts maximum
Step 3: Use the Information Tables
The indicator provides two helpful tables:
Position Size Table (top-right):
Shows common tick distances (10, 20, 40, 80, 160 ticks)
Displays risk per contract at each distance
Contract count for your specified risk amount
Total risk with rounded contract numbers
Settings Table (bottom-right):
Confirms your current risk amount
Shows selected contract type
Displays current settings for quick reference
Step 4: Apply to Your Trading
For Long Positions:
Look at the green labels on the right side of your chart
Find your desired entry level
Read the label to see: distance in ticks and maximum contracts
Example: "30T 8x" = 30 ticks from stop, buy 8 contracts maximum
For Short Positions:
Look at the red labels on the left side of your chart
Find your desired entry level
Read the label for tick distance and contract count
Example: "40T 6x" = 40 ticks from stop, sell 6 contracts maximum
Step 5: Trading Execution
Before Entering a Trade:
Identify your stop loss level and input it into the indicator
Choose your entry point by looking at the distance lines
Note the contract count from the corresponding label
Verify the risk amount matches your trading plan
Execute your trade with the calculated position size
Risk Management Features:
Contract rounding: All position sizes are rounded down (never up) to ensure you don't exceed your risk limit
Zero position filtering: Lines only show where position size is at least 1 contract
Dual-sided display: Plan both long and short opportunities simultaneously

Gold Futures 2M 5M Tick Move Indicator📢 Gold Futures Tick Move Indicator 🚀
Customizable Tick-Based Trading Alerts & Visualization
🔹 Overview:
The Gold Futures Tick Move Indicator is designed for traders who rely on tick-based price movements to detect significant market activity. This indicator identifies strong momentum moves, triggers customizable buy and sell signals, and provides clear trade range visualizations with take profit and stop loss levels.
🔹 Key Features:
✅ Customizable Tick Threshold – Adjust the number of ticks needed to trigger a buy/sell signal (default: 65 ticks).
✅ Take Profit & Stop Loss Levels – Automatically calculates and plots exit levels (default: 75 TP, 40 SL).
✅ Buy/Sell Alerts – Get real-time alerts when a candle moves beyond the defined tick threshold.
✅ Custom Colors for Trade Signals – Buy (teal #008080), Sell (hot pink #FF69B4).
✅ Trade Range Visualization – Background colors highlight long & short positions for better clarity.
✅ Candle Highlighting – Turns white when a tick-based signal is detected.
🔹 How It Works:
1️⃣ Set your tick movement threshold – Define how many ticks the price must move to trigger a trade signal.
2️⃣ Customize Take Profit & Stop Loss – Modify exit levels to match your strategy.
3️⃣ Wait for a Signal – If the price moves beyond the defined tick range, the indicator plots a Buy (teal) or Sell (hot pink) signal.
4️⃣ Monitor Trade Zones – Trade ranges are highlighted in teal or pink for quick visualization.
5️⃣ Receive Alerts – Set up TradingView alerts to be notified of trade opportunities.
🔹 Who is This For?
💰 Gold Futures Traders looking to capitalize on price momentum
📈 Scalpers & Day Traders seeking precise tick-based entries
🎯 Algo Traders who want automated alerts & visual cues

Aggregated Volume Spot & Futures ⚉ OVERVIEW ⚉
The indicator presents a comprehensive approach to Aggregated Volume Data . Works on almost all CRYPTO Tickers!
The script also includes several input parameters that allow the user to control which exchanges and currencies are included in the aggregated data.
This script allows the user to choose from several data display modes, including volume, spot & perp, delta, cumulative delta, and others.
The user can also choose how volume is displayed (in assets, U.S. dollars or euros) and how it is calculated (sum, average, median, or dispersion).
WARNING Indicator is for CRYPTO ONLY.
______________________
⚉ SETTINGS ⚉
‾‾‾‾‾‾‾‾‾‾‾‾‾‾‾‾‾‾‾‾‾‾
Mode — Choose Mode.
• Volume — This displays the Volume
• Volume (Colored) — Shows aggregated volume but applying different volume colors for different exchanges.
• Delta — This displays the difference between the number of sellers and buyers.
• Cumulative Delta — This displays the cumulative delta between sellers and buyers.
• Spot & Perp — Shows Spot and Futures volume at the same time.
• Delta (Spot - Perp) — Shows the difference between Spot and Futures Volume.
• Liquidations — Displays Potential Liquidations. (Calculated between the difference in volume between Futures and Spots)
• OBV — On Balance Volume.
• MFI — Money Flow Indicator.
• Data Type — Choose Single or Aggregated data.
• Single — Show only current Volume.
• Aggregated — Show Aggregated Volume.
Volume By — You can also select how the volume is displayed.
• COIN — Volume in Actives.
• USD — Volume in United Stated Dollar.
• EUR — Volume in European Union.
• RUB — Volume in Russian Ruble.
Calculate By — Choose how Aggregated Volume it is calculated.
• SUM — This displays the total volume from all sources.
• AVG — This displays the average price of the volume from all sources.
• MEDIAN — This displays the median volume from all sources.
• VARIANCE — This displays the variance of the volume from all sources.
* 🡅 Be Careful, Reacts to Every Mode.
Additional features
• Show MA — Show Movieng Average of Volume.
• MA Period — Period of MA.
• Lookback — Lookback period for 'Cumulative Delta' and for 'MFI'.
• Liquidation Filter — Filters out small or negative difference values.
• Show Table — Table shows the current volume of the last candle. Also in the Mode "Colored" shows the color of exchanges if they have volume.
________________
⚉ NOTES ⚉
‾‾‾‾‾‾‾‾‾‾‾‾‾‾‾‾
I don't pretend to be the best choice for calculating CVD , Delta and Liquidations, the calculations are chosen to be optimal from what I have seen and know.
If you have any ideas what to add to my work to add more sources or make calculations cooler, suggest in DM .

Z Score BandThis is a band based on Z Score. What is Z Score? In layman's terms it's a method of finding outliers within a sequence of numbers. It's highly effective to quantify pump and dumps in the crypto market.
The middle line is a simple Exponential Moving Average, you can configure this with whatever period you prefer. It comes default with a period of 247 to which I find suitable for my style of trading. The upper and lower bound are determined by the standard deviation you choose in the settings, it comes with a default of 1.69 although I've heard people saying 2.5 is a better number to really pinpoint outliers.
Trading with this indicator is like trading with any band based indicator. The main difference is that this indicator's sole purpose when I wrote it is to help me find shorting positions in the futures market. On the contrary though, longs are also achievable although I rarely long the futures market.
If prices hit the upper bound and get rejected, it's probably because the move was an outlier, it doesn't happen often and when it does usually it reveals crypto's nature of buying spot and hedging short in the futures market. When prices stay above the upper bound, switch to a higher timeframe until we can see that it's still have some ways upwards.
What's true about using this as a shorting tool is also true with longs. However, it might not be as effective, I'd like to be proven wrong.

Convert ETF to Futures/IndexThis indicator is used to automatically map an ETF's VWAP and 10 levels above and below the strike of your choice, to the futures or index instrument currently being viewed/traded. This works very well when using both SPY to ES/MES/SPX or QQQ to NQ/MNQ/NDX to plot the ETF strikes and can lead to some incredible trades, especially when trading level to level. Since SPY, QQQ, IWM, and DIA have the same price action as their futures iteration, there seems to be a direct correlation between their levels and VWAP . This indicator is made to easily map these key levels to the appropriate futures instrument. If you have a way to measure GEX centered around a certain level, I recommend color coding the lines to help indicate whether the level will have strong positive or negative gamma hedging associated with it.

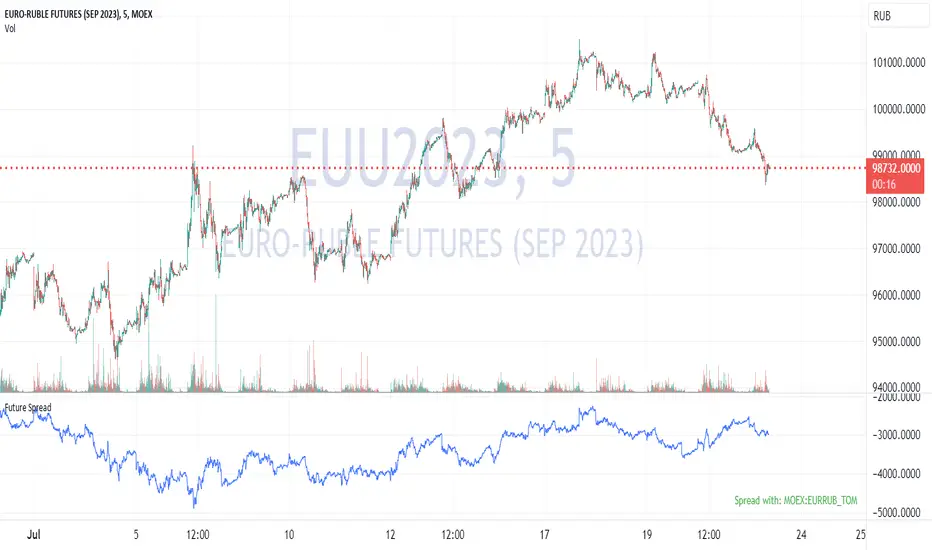
Future's spread with base contract (MOEX)English:
Indicator calculates spread between future and it's theoretical price baased on base contract, number of days to expiration and central bank key rate.
I didn't find any means of getting base contract of security on chart so I hardcoded futures and corresponding base contracts.
Hardcoded futures are MOEX (Moscow Exchange) only and key rate used in script is Russian Central Bank's key rate from 2013, but I believe you can easily adapt it to any other key rate history. I can share source code of tiny C++20 utility for easy generation of get_rate(time) function from more human-readable date format rather then UNIX timestamp used in PineScript.
Only quarterly futures are supported. Only in "SIU2022" like notation. "SI1!" like aliases are not supported.
Русский:
Индикатор отображает спред фьючерса к его теоретической цене с учётом усыхания на каждый день.
Не нашёл, как определить базовый актив фьючерса средствами TradingView - поэтому это соответствие захардкожено вручную.
Поддерживаются только квартальные фьючерсы, только MOEX, только хардкор.
Поддерживается история ключевой ставки ЦБ РФ с 2013 года.
Используйте коды фьючерсов вида "SIU2022".
Не поддерживаются альясы вроде "SI1!", "EU1!".
SPY to ES / MESSPY to ES is an indicator that converts SPY price targets to ES / MES futures price targets.
This indicator is helpful when you have price targets for SPY but trade ES or MES futures instead of SPY. It coverts the SPY price targets to ES / MES futures, and draws the SPY VWAP line on your ES / MES chart.
It supports the following lines
Bullish Above
Bearish Below
Long PT1
Long PT2
Long PT3
Short PT1
Short PT2
Short PT3
It also converts the SPY VWAP to it's current ES / MES value.
Note: The conversion do not work during pre and after market and the lines are only correct during market hours.

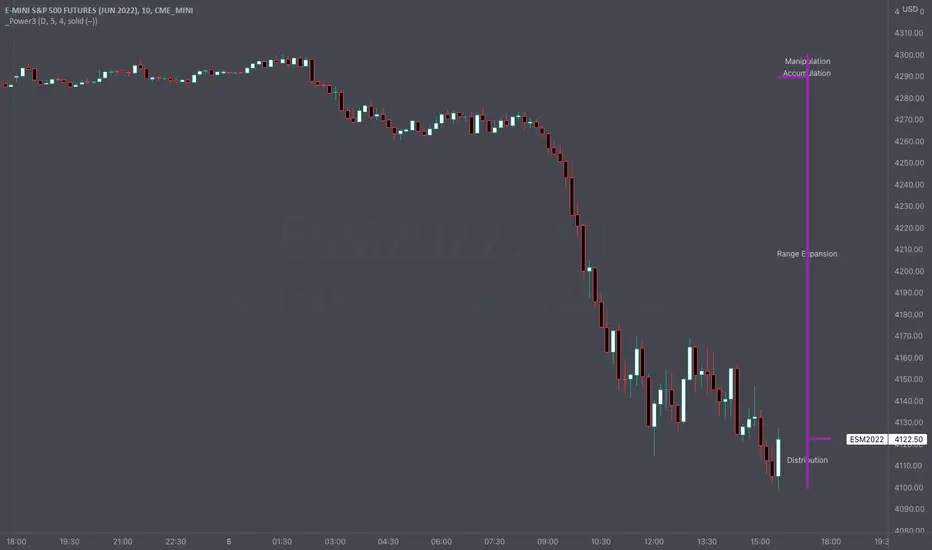
Intraday Power 3 VisualDescription
This indicator draws a dynamic "Open High Low Close" type visual on intraday charts so the trader can easily keep track of the daily/weekly movement. This indicator was inspired by the Inner Circle Trader’s (ICT) “Power 3” concept, which is Accumulation, Manipulation, and Distribution of price on a daily timeframe.
Visual
This indicator plots the chosen timeframes opening price along with a live line for the current price. This makes it very easy to identify the daily/weekly range along it’s open. And the user can combine this indicator with my other indicator “Futures Exchange Sessions” to plot the midnight EST & 8:30 AM EST lines to get a great summation of over night price action.
Inputs and Style
In the Input section the user can dynamically switch between Daily and Weekly timeframes. Built in ability to move the entire Visual to the right makes preventing indicator overlap a breeze. All of the lines can be configured: color, style, and width. Independently toggle ON/OFF the Power 3 labels (Accumulation, Manipulation, Range Extension, Distribution) and can change labels color. The labels dynamically move and switch positions based upon bear or bull daily/weekly range.
Special Notes
The Futures market is open 23/5. It is closed everyday for 1-hour at 5pm EST and closed over the weekends. Because this Intraday Power 3 Visual is drawing in the 'future' on the users TradingView chart, when the visual is close or in a time when the market is closed, the visual doesn't behave properly. This is because TradingView doesn't display times when the Market is closed, thus the drawings cannot be displayed during those times. There is nothing wrong with the script. Please wait until the Market is open and the visual will be drawn normally.
This indicator is intended for use in the Futures Market
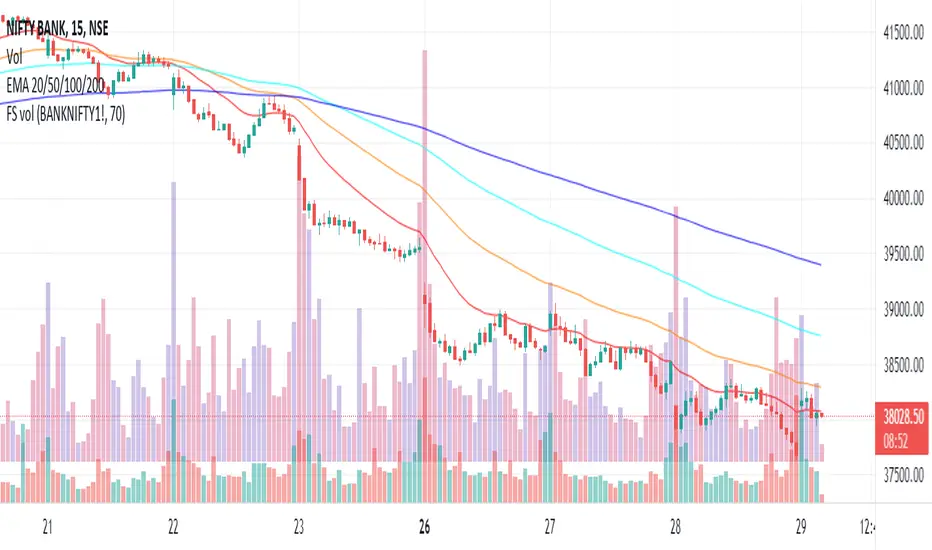
Plot futures volumes with indexMost of the times, F&O traders like to draw their own trendlines or mark other levels on the underlying instrument where volumes of the underlying is a key parameter. When such an instrument is a non-tradeable index, then one needs to switch to the futures chart for volumes. This script plots the volumes from futures on the underlying index so that traders don't need to switch charts just for futures volumes! Hope it is useful to some. Cheers!
Session Levels - Ultimate Range IndicatorSession Levels - Ultimate Range Indicator
Primarily developed for trading the E-MINI Futures Markets like NQ or ES from the CME Group,
but also more than suitable for Crypto or other instruments.
This indicator highlights the chosen session, which can be Globex, Asian, London and New York.
It plots the important levels and also renders the Opening Range as it forms (a.k.a. Initial Balance).
After the 1st hour Opening Range is finished, it can plot the Standard Deviations / Projections.
See below for a complete feature list.
All Opening Ranges on chart and for the New York session the Range Projections are turned on:
s3.tradingview.com
How to use (example):
If you are trading the Nasdaq Futures (NQ!)
Enable the Globex Overnight session. Basically in the Futures Market, the Globex session is everything outside of US trading hours of Stocks. This draws the important overnight levels, like the Low, 25%, 50%, 75% and the High.
Enable the New York Session with Levels and Opening Range. Generally, 70% of the time the 1st hour will put a Low or High of the day.
If the price is trading above the Globex Low, most likely the Low of the Day is formed and the price target for the day will be 1.5x Standard Deviation and 2x Standard Deviation.
[*} Deviation of the Initial Balance depends on the volume ad overall market structure.
** This is not financial advice or any guarantee **
Features:
Show each Session Highlighted on Intraday chart in it's own color (each session can be turned off and has customizable times and color)
Show Line Levels of each session: Low, 25%, 50%, 75% and the High (customizable color)
Show the Opening Range (Initial Balance) of the Asian, London and New York session. Note: NY has more options.
Opening Range is displayed as a box with level lines (customizable color)
Levels are drawn to the end of the NY Cash session (customizable time)
Show IB Standard Deviations 0.5 - 3.0. Calculated from the Opening Range (Initial Balance)
Option to display Higher Timeframe levels: Previous Day Open/Close and Previous Week Open/Close
All level lines and OR boxes size dynamically as the session progresses
Built in Alerts for when price hits key levels. e.g. Alert when price crosses the NY Opening Range High. Or an Alert when the first STDEV is hit.
Option to toggle display of drawings for Today's trading session only, or Show all recent session levels. This keeps the chart clean or not.
Extras:
The NY Opening Range also has a 50% level line
The NY Opening Bar can be highlighted separately
The Level Lines can have small labels turned on/off. Values are only shown on mouse over to keep a clean chart
Keep in mind:
1) This indicator works on all instruments, but on instruments with limited market hours, your chart setting
has to be set to "Extended Hours" otherwise. For example TSLA on NASDAQ.
2) The Exchange Time Zone for the CME Group is Chicago UTC-6. So the session times you configure in the settings menu are based on that timezone too.
3) Globex opens at 5pm CST and closes when the US session starts 8:30CST.
4) When enabling the Alerts in the Indicator settings, be sure to also create an alarm for this indicator using the Alarm function of Tradingview.

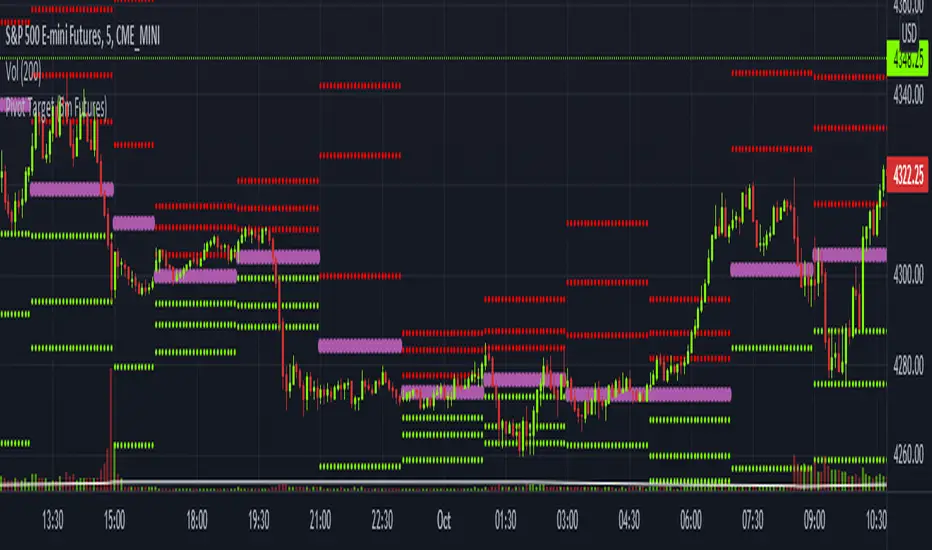
Pivot Target (5m Futures)I am new to both Futures Trading and Pivots. Looking for shorter-term profitable opportunities, I have investigated the use of pivots from a higher timeframe. All the work of this script is performed using two lines. It calculates the pivot from the previous 2-hour bar and draws this pivot line on the 5-minute timeframe. Many many times, the price will reach back to this pivot point - sometimes fairly quickly within the same horizontal pivot line and sometimes farther out (4-hours to 6-hours, or within the next few days). Price tends to reach the level around ninety percent of the time, making for plenty of short-term trading opportunities.
I get the best results when I see the price rise or fall from the pivot, along with a second indicator indicating a possible reversal (my favorite is Divergence for Many Indicators v4 by LonesomeTheBlue . Who knew divergence (both regular and hidden) was so common and useful for finding probable reversals? If I find the price above or below the pivot line with a second signal, I'll place a buy or sell within that same 2-hour window the price tends to return back to the higher timeframe pivot for a nice profit very quickly. Other times it does take a little longer to return with only a small percentage of time not returning within a reasonable amount of time, or very unusually, not at all. The image above shows a number of profitable trading opportunities using a combination of the Pivot Target and LonesomeTheBlue's Divergence for Many Indicators v4. You can further limit risk by only taking trades that are in the same direction of the overall trend, possibly confirmed on a higher timeframe.
This script will only be visible on the 5-minute timeframe the way it is written right now. I wouldn't suggest shorter or longer timeframes unless some editing is done by you. It doesn't seem to work as well with stocks, but is best on Futures due to the wave-like natures of the futures market. Trade safe, trade with the trend, use stops and limits appropriately and stay safe.
Intermarket Divergence (Futures vs Equity)Intermarket Divergence (Futures vs Equity)
This indicator detects intermarket divergence between a traded instrument (futures, CFD, or spot) and a related equity or ETF.
It highlights moments where price and its underlying market drivers disagree, often appearing before reversals or expansions.
🎯 What It Shows
Bullish divergence:
Price makes a lower low while the equity makes a higher low
Bearish divergence:
Price makes a higher high while the equity makes a lower high
Based on swing pivots, not candle noise
Designed for intraday context, not mechanical entries
✅ Recommended Use
XAUUSD (Gold) → GDX (default)
XAGUSD (Silver) → SIL
USOIL / WTI → XLE
(These guidelines are included directly in the indicator settings.)
🧭 How to Use
Apply on 15m–30m
Look for signals near key levels (PDH/PDL, Asia high/low, HTF structure)
Use price action for entries
Divergence is context, not a signal.
⚠️ Notes
Non-repainting
Signals are selective by design
Best during London & New York sessions

US Index Market Snapshot Cash, Futures & ETFsBrief Description
This study displays a real-time table of major U.S. equity indices—Dow Jones, S&P 500, Nasdaq, and Russell—across Cash, Futures, and ETF markets.
Each cell shows the current price along with the daily percentage change, with color-coded backgrounds for quick trend identification.
Designed as a compact market dashboard, it provides an at-a-glance view of cross-market alignment and relative performance.
Alternative Title Options
US Indices Dashboard (Cash • Futures • ETFs)
Index Market Matrix – Prices & Daily Change
Multi-Market US Index Table

Seasonal Strategies V1Seasonal Strategies V1 is a rule-based futures seasonality framework built around predefined calendar windows per asset.
The strategy automatically detects the current symbol and activates long or short trading phases strictly based on historically observed seasonal tendencies. All entries and exits are fully time-based — no indicators, no predictions, no discretionary input.
Key Features
Asset-specific seasonal windows (MMDD-based)
Automatic long and short activation
Fully time-based entries and exits
One position at a time (no pyramiding)
Clean chart visualization using subtle background shading
No indicators, no filters, no curve fitting
Philosophy:
This strategy is designed as a structural trading tool, not a forecasting model.
It focuses on when a market historically shows seasonal tendencies — not why or how far price might move.
Seasonal Strategies V1 intentionally keeps the chart clean and minimal, making it suitable as a baseline framework for research, portfolio-style seasonal approaches, or further extensions in later versions.
Intended Use:
Futures and commodity markets
Seasonality research and testing
Systematic, calendar-driven strategies
Educational and analytical purposes
Disclaimer
This script is provided for educational and research purposes only.
Past seasonal tendencies do not guarantee future performance.
Risk management, position sizing, and portfolio decisions are the responsibility of the user.

ETF-Futures Opening Ratio (Table)This indicator calculates the opening price ratio between an ETF and its corresponding futures contract using the 9:30 AM New York (RTH) opening price.
The ratio is locked at the official market open and remains fixed throughout the session, providing a stable reference for:
Translating ETF price levels into futures equivalents
Comparing relative value and premium/discount behavior
Maintaining consistent cross-instrument analysis during the trading day
The output is displayed in a simple on-chart table for quick reference and minimal chart clutter.

Liquidity Levels Pro Tool - thewallranka
Liquidity Levels Pro Tool is a market-structure and liquidity-mapping indicator designed to help discretionary futures and index traders identify statistically relevant price levels where reactions, continuations, or liquidity sweeps are more likely to occur.
This script is a decision-support tool, not a signal generator. It does not issue buy/sell alerts or predict future price movement. Instead, it organizes and scores liquidity information so traders can make their own contextual decisions.
What this indicator does
The script continuously detects and maintains liquidity zones derived from price pivots, then evaluates those zones using multiple structural and contextual factors:
Repeated price interaction (touches)
Freshness (time since last interaction)
Confluence with key reference levels
Reaction behavior after contact
Session relevance (RTH vs overnight)
Market regime (trend vs mean reversion)
Time-of-day effects (open, midday, power hour)
Only the most relevant zones—based on a dynamic scoring system—are displayed to reduce chart clutter and focus attention on levels that have historically mattered.
Core components
1. Liquidity Zones
Zones are built from pivot highs and lows and expanded into areas using a configurable tick-based padding. Nearby zones are merged to avoid redundancy.
Each zone is continuously evaluated and assigned a score (0–100) reflecting its relative importance.
2. Zone Scoring (No Lookahead)
Zone scores are based on:
Number of confirmed interactions
Recency of the last touch
Confluence with prior day/week levels, VWAP, and Opening Range
Reaction quality after touches (speed and follow-through)
Session alignment (zones that “work” in the current session are favored)
Penalties after liquidity sweeps
Zones are not forward-looking and do not rely on future data.
3. Context Engine
The script classifies the current environment using VWAP slope and distance:
Trend (up or down)
Mean reversion
Mixed/transition
Time-of-day context (Open, Midday, Power Hour) is also tracked internally and influences zone scoring.
This context is displayed in the HUD to support situational awareness, not automated decisions.
4. Liquidity Sweeps
Optional sweep detection highlights situations where price trades beyond a zone and closes back inside, indicating potential stop runs or failed breakouts.
Sweeps are rate-limited and applied conservatively to avoid visual noise.
5. Trade Planning Levels (Optional)
When enabled, the script highlights the nearest high-quality liquidity level above and below price based on score thresholds.
These are intended as reference targets, not trade entries or exits.
HUD (Heads-Up Display)
The on-chart HUD summarizes:
Key reference levels (prior day/week, Opening Range)
Nearest strong liquidity above/below price
Market regime and time-of-day context
Distance to levels (ticks or points)
The HUD is fully optional, positionable, and includes resizable modes (Small / Medium / Large) to fit different chart layouts.
How to use this tool
This indicator is best used as part of a discretionary trading process, for example:
Identifying areas where price is more likely to react or pause
Framing trades around higher-quality structure instead of arbitrary levels
Filtering setups based on session and regime context
Managing expectations near known liquidity rather than chasing price
It is intentionally designed not to provide trade signals.
Limitations and important notes
This script does not predict outcomes or guarantee reactions
High-scoring zones can still fail
Liquidity behavior is context-dependent and probabilistic
No performance claims or backtested results are provided
The indicator should not be used in isolation
Past behavior does not imply future results.
Chart and usage notes
The script is intended for standard time-based charts
Recommended for liquid futures and index products
Use a clean chart for clarity when publishing or sharing
No external indicators are required
Final note
Liquidity Levels Pro (Tool) — v6 is designed to organize complex market structure into a clear, readable framework, allowing traders to focus on execution and risk management rather than raw level detection.
This script reflects an analytical approach to intraday liquidity and structure, not an automated trading system.

XenoSmooth Predictive Candles - Advanced Heikin Ashi CandlesXenoSmooth Predictive Candles
Summary in one paragraph
A synthetic candle engine for crypto, FX, equities, and futures on intraday to swing timeframes. It reduces noise and flip delay so structure is easier to read. The core novelty is a predictive open with inertia plus slope lead fused with a zero lag body filter and an overshoot based wick model normalized by the real range and capped by ATR. Add it to a clean chart, hide regular candles if desired, and tune lengths. Shapes can move while the bar is open and settle on close. For conservative workflows read on bar close.
Scope and intent
• Markets. Major FX pairs, index futures, large cap equities, liquid crypto
• Timeframes. One minute to daily
• Purpose. Faster and smoother visual structure than Heikin Ashi while keeping causality and realistic wicks
Originality and usefulness
• Unique concept. Predictive open with inertia and slope lead plus selectable zero lag body filter and ATR capped wick overshoot in percent of real range
• Failure mode addressed. Late flips in chop and unreal long wicks from raw extremes
• Testability. Every control is an input. Users can toggle body method, lengths, clipping, and percent modeling
• Portable yardstick. ATR based wick cap and percent of bar range scale across symbols
Method overview in plain language
Build a robust base price from O, H, L, and extra weight on Close. Smooth it with a chosen filter to produce the synthetic close. Drive a predictive open that follows the synthetic close with tunable inertia and a small lead from the last bar slope. Model wicks as the portion of the real extremes that extends beyond the synthetic body, smooth that overshoot, normalize by the bar range if selected, then cap by ATR to avoid tail spikes. Clamp synthetic values to the real high and low if enabled.
Base measures
• Range basis. True Range for the ATR cap and High minus Low for percent normalization
• Return basis. Not used
Components
• Body Base Blend. Weighted O H L with a close bias to stabilize the base
• Zero Lag Body Filter. ZLEMA or Super Smoother or WMA to set the synthetic close
• Predictive Open. Inertial follow of the synthetic close plus a slope lead term
• Wick Overshoot Model. Smoothed extension beyond the body, optional percent of real range, ATR cap
• Clamp Option. Keeps synthetic open and close inside the real bar range
Fusion rule
• Synthetic close equals filtered base
• Synthetic open equals previous open plus inertia times distance to synthetic close plus slope lead
• Wicks equal smoothed overshoot above and below the body, optionally percent of range then converted back to price and capped by ATR
Inputs with guidance
Setup
• Signal timeframe. Uses the chart timeframe
• Invert direction. Not applicable
• Session windows. Not applicable
Logic
• Body length. Core smoothing length for the synthetic close. Typical 6 to 14. Higher gives smoother and slower. Lower gives faster flips
• Body method. ZLEMA or Super Smoother or WMA. ZLEMA is fastest. Super Smoother is calmest
• Close weight in base. 0 to 1. Higher gives stronger emphasis on close and less noise
• Open inertia. 0 to 1. Higher makes the open follow the close more tightly
• Lead gain. 0 to 1. Higher adds more phase lead. Keep modest to avoid overshoot
• Clamp body to real range. On keeps synthetic body inside high and low
• Wick smooth length. Typical 4 to 10. Higher reduces jitter
• Overshoot as percent. On stabilizes wicks across regimes
• ATR length. Typical 10 to 20 for the cap
• Max wick equals ATR times. 0 disables. 1.0 to 2.0 contains extreme tails
Filters
• Efficiency or trend filter. Not used
• Micro versus macro range relation. Not used
• Location filter. Not used
Realism and responsible publication
• No performance claims
• Intrabar motion reminder. Shapes can move while a bar forms and settle on close
• Strategies must use standard candles for signals and orders
Honest limitations and failure modes
• High impact releases and thin liquidity can distort wicks and produce gaps that any smoother cannot predict
• Very quiet regimes can reduce contrast. Consider longer body length
• Session time on the chart controls the definition of each bar

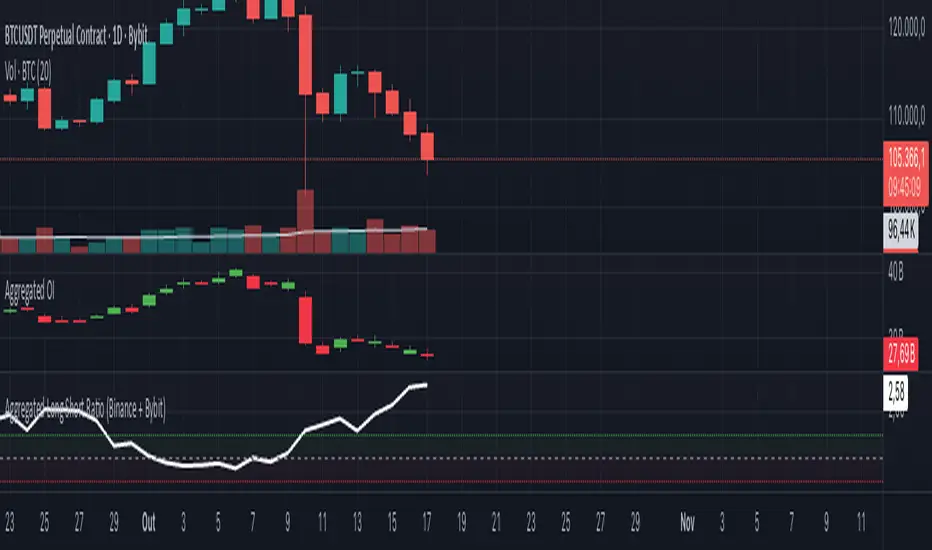
Aggregated Long Short Ratio (Binance + Bybit)This indicator displays the Long/Short Ratio (LSR) from Binance and Bybit exchanges, plus an aggregated average. LSR shows the ratio between traders holding long positions vs short positions.
Settings AvailableExchanges Group:
☑️Show Binance - Display Binance LSR line
☑️ Show Bybit - Display Bybit LSR line
☑️ Show Aggregated LSR - Display combined average
Timeframe - Choose data timeframe (leave empty for chart timeframe)
Visualization Group:
🎨 Binance Color - Default: Yellow
🎨 Bybit Color - Default: Orange
🎨 Aggregated Color - Default: White
📖 How to Read the Indicator
⚠️ CRITICAL: Always analyze LSR together with Open Interest (OI)
Key Levels:
LSR = 1.0 (gray dashed line) = Balance - Equal longs and shorts
LSR > 1.0 = More longs than shorts (bullish sentiment)
LSR < 1.0 = More shorts than longs (bearish sentiment)
Extreme Zones:
LSR > 1.5 (green zone) = Very bullish - Possible market top
LSR < 0.5 (red zone) = Very bearish - Possible market bottom
Why Open Interest Matters:
LSR alone doesn't tell the full story. You MUST check Open Interest:
Rising OI + High LSR (>1.5) = New longs opening → Strong momentum OR potential trap
Rising OI + Low LSR (<0.5) = New shorts opening → Strong momentum OR potential trap
Falling OI + Extreme LSR = Positions closing → Weak signal, avoid trading
Stable OI + Extreme LSR = No new positions → Less reliable signal
💡 Trading Interpretation
⚠️ ALWAYS combine LSR with Open Interest analysis!
Contrarian Strategy (High Leverage Zones):
High LSR (>1.5) + Rising OI → Many new longs → Potential short squeeze OR reversal down
Low LSR (<0.5) + Rising OI → Many new shorts → Potential long squeeze OR reversal up
Trend Confirmation:
Rising LSR + Rising price + Rising OI = Strong bullish trend with new positions
Falling LSR + Falling price + Rising OI = Strong bearish trend with new positions
Weak Signals (Avoid):
Extreme LSR + Falling OI = Positions closing → Low conviction
Extreme LSR + Stable OI = No new money → Wait for confirmation
Divergences:
Price higher highs but LSR falling + Rising OI = Bearish divergence (shorts accumulating)
Price lower lows but LSR rising + Rising OI = Bullish divergence (longs accumulating)
Best Setups:
Reversal: Extreme LSR (>1.5 or <0.5) + Rising OI + Price rejection
Trend: LSR trending with price + Steadily rising OI
Caution: Extreme LSR + Falling OI = Ignore signal
Built-in Alerts
The indicator includes 4 preset alerts:
LSR Crossed Above 1.0 - Market turned bullish
LSR Crossed Below 1.0 - Market turned bearish
LSR Very High - Above 1.5 (possible top)
LSR Very Low - Below 0.5 (possible bottom)
To Set Up Alerts:
Click the "..." on the indicator
Select "Add Alert"
Choose the condition you want
Configure notification method
Best Practices
MANDATORY: Always add Open Interest indicator to your chart alongside LSR
To add OI: Click Indicators → Search "Open Interest" → Add official TradingView OI
Use on perpetual futures charts (symbols ending in .P)
Works best on USDT pairs (BTCUSDT, ETHUSDT, etc.)
Combine LSR + OI + price action + support/resistance levels
Higher timeframes (4h, 1D) give more reliable signals
Don't trade LSR extremes without confirming OI direction
Golden Rule: Rising OI = Strong signal | Falling OI = Weak signal
⚠️ Important Notes
Indicator requires TradingView Premium or above (uses Request library)
Only works on crypto perpetual futures
Data availability depends on exchange API
NA values mean data is not available for that exchange/symbol
Never use LSR without Open Interest context
(SPY to ES) ETF→Futures Multi-Level (10 Levels + Select All)Converts selected ETF levels (SPY or QQQ) into equivalent futures levels (ES or NQ).
Uses live price ratio between ETF and futures for real-time level translation.
Supports 10 independent levels (A–J) with user-defined ETF price inputs.
Provides checkboxes to toggle each level’s visibility or show all at once.
Applies smoothing (ta.sma) to reduce noise from short-term price movement.
Lets user customize each line’s color, width, and style (solid, dashed, dotted).
Automatically updates lines as new bars form without user interaction.
Uses persistent line objects to keep levels stable when scrolling or zooming.
Adapts to either SPY→ES or QQQ→NQ depending on the “Convert SPY?” toggle.
Draws clean horizontal lines without legend clutter for visual precision.
SOME ONE PUBLISHED THIS FUNCTIONALITY FOR A CHARGE SO I MADE IT FREE.
-rA

SPX Ladder → Adjusted to Active Ticker (5s & 10s)This indicator allows you to a grid of SPX levels directly on the ES1! (E-mini S&P 500 Futures) chart, automatically adjusting for the spread between SPX and ES1!. This is particularly useful for traders who perform technical analysis on SPX but execute trades on ES1!.
Features:
Renders every 5 and 10 points steps of the SPX in your current chart.
The script adjusts these levels in real-time based on the current spread between SPX and ES1!
Plots updated horizontal lines that move with the spread
Supports Multiple Tickers, ES1!, SPY and SPX500USD.
Ideal for futures traders who want SPX context while trading ES1!.

Crypto Perp Calc v1Advanced Perpetual Position Calculator for TradingView
Description
A comprehensive position sizing and risk management tool designed specifically for perpetual futures trading. This indicator eliminates the confusion of calculating leveraged positions by providing real-time position metrics directly on your chart.
Key Features:
Interactive Price Selection: Click directly on chart to set entry, stop loss, and take profit levels
Accurate Lot Size Calculation: Instantly calculates the exact position size needed for your margin and leverage
Multiple Entry Support: DCA into positions with up to 3 entry points with customizable allocation
Multiple Take Profit Levels: Scale out of positions with up to 3 TP targets
Comprehensive Risk Metrics: Shows dollar P&L, account risk percentage, and liquidation price
Visual Risk/Reward: Color-coded boxes and lines display your trade setup clearly
Real-time Info Table: All critical position data in one organized panel
Perfect for traders using perpetual futures who need precise position sizing with leverage.
---------
How to Use
Quick Start (3 Clicks)
1. Add the indicator to your chart
2. Click three times when prompted:
First click: Set your entry price
Second click: Set your stop loss
Third click: Set your take profit
3. Read the TOTAL LOTS value from the info table (highlighted in yellow)
4. Use this lot size in your exchange when placing the trade
Detailed Setup
Step 1: Configure Your Account
Enter your account balance (total USDT in account)
Set your margin amount (how much USDT to risk on this trade)
Choose your leverage (1x to 125x)
Select Long or Short position
Step 2: Set Price Levels
Main levels use interactive clicking (Entry, SL, TP)
For multiple entries or TPs, use the settings panel to manually input prices and percentages
Step 3: Read the Results
The info table shows:
TOTAL LOTS - The position size to enter on your exchange
Margin Used - Your actual capital at risk
Notional - Total position value (margin × leverage)
Max Risk - Dollar amount you'll lose at stop loss
Total Profit - Dollar amount you'll gain at take profit
R:R Ratio - Risk to reward ratio
Account Risk - Percentage of account at risk
Liquidation - Price where position gets liquidated
Step 4: Advanced Features (Optional)
Multiple Entries (DCA):
Enable "Use Multiple Entries"
Set up to 3 entry prices
Allocate percentage for each (must total 100%)
See individual lot sizes for each entry
Multiple Take Profits:
Enable "Use Multiple TPs"
Set up to 3 TP levels
Allocate percentage to close at each level (must total 100%)
View profit at each target
Visual Elements
Blue lines/labels: Entry points
Red lines/labels: Stop loss
Green lines/labels: Take profit targets
Colored boxes: Visual risk (red) and reward (green) zones
Info table: Can be positioned anywhere on screen
Alerts
Set price alerts for:
Entry zones reached
Stop loss approached
Take profit levels hit
Works with TradingView's alert system
Tips for Best Results
Always verify the lot size matches your intended risk
Check the liquidation price stays far from your stop loss
Monitor the account risk percentage (recommended: keep under 2-3%)
Use the warning indicators if risk exceeds margin
For quick trades, use single entry/TP; for complex strategies, use multiple levels
Example Workflow
Find your trade setup using your analysis
Add this indicator and click to set levels
Check risk metrics in the table
Copy the TOTAL LOTS value
Enter this exact position size on your exchange
Set alerts for key levels if desired
This tool bridges the gap between TradingView charting and exchange execution, ensuring your position sizing is always accurate when trading with leverage.
Disclaimer, this was coded with help of AI, double check calculations if they are off.

FlowStateTrader FlowState Trader - Advanced Time-Filtered Strategy
## Overview
FlowState Trader is a sophisticated algorithmic trading strategy that combines precision entry signals with intelligent time-based filtering and adaptive risk management. Built for traders seeking to achieve their optimal performance state, FlowState identifies high-probability trading opportunities within user-defined time windows while employing dynamic trailing stops and partial position management.
## Core Strategy Philosophy
FlowState Trader operates on the principle that peak trading performance occurs when three elements align: **Focus** (precise entry signals), **Flow** (optimal time windows), and **State** (intelligent position management). This strategy excels at finding reversal opportunities at key support and resistance levels while filtering out suboptimal trading periods to keep traders in their optimal flow state.
## Key Features
### 🎯 Focus Entry System
**Support/Resistance Zone Trading**:
- Dynamic identification of key price levels using configurable lookback periods
- Entry signals triggered when price interacts with these critical zones
- Volume confirmation ensures genuine breakout/reversal momentum
- Trend filter alignment prevents counter-trend disasters
**Entry Conditions**:
- **Long Signals**: Price closes above support buffer, touches support level, with above-average volume
- **Short Signals**: Price closes below resistance buffer, touches resistance level, with above-average volume
- Optional trend filter using EMA or SMA for directional bias confirmation
### ⏰ FlowState Time Filtering System
**Comprehensive Time Controls**:
- **12-Hour Format Trading Windows**: User-friendly AM/PM time selection
- **Multi-Timezone Support**: UTC, EST, PST, CST with automatic conversion
- **Day-of-Week Filtering**: Trade only weekdays, weekends, or both
- **Lunch Hour Avoidance**: Automatically skips low-volume lunch periods (12-1 PM)
- **Visual Time Indicators**: Background coloring shows active/inactive trading periods
**Smart Time Features**:
- Handles overnight trading sessions seamlessly
- Prevents trades during historically poor performance periods
- Customizable trading hours for different market sessions
- Real-time trading window status in dashboard
### 🛡️ Adaptive Risk Management
**Multi-Level Take Profit System**:
- **TP1**: First profit target with optional partial position closure
- **TP2**: Final profit target for remaining position
- **Flexible Scaling**: Choose number of contracts to close at each level
**Dynamic Trailing Stop Technology**:
- **Three Operating Modes**:
- **Conservative**: Earlier activation, tighter trailing (protect profits)
- **Balanced**: Optimal risk/reward balance (recommended)
- **Aggressive**: Later activation, wider trailing (let winners run)
- **ATR-Based Calculations**: Adapts to current market volatility
- **Automatic Activation**: Engages when position reaches profitability threshold
### 📊 Intelligent Position Sizing
**Contract-Based Management**:
- Configurable entry quantity (1-1000 contracts)
- Partial close quantities for profit-taking
- Clear position tracking and P&L monitoring
- Real-time position status updates
### 🎨 Professional Visualization
**Enhanced Chart Elements**:
- **Entry Zone Highlighting**: Clear visual identification of trading opportunities
- **Dynamic Risk/Reward Lines**: Real-time TP and SL levels with price labels
- **Trailing Stop Visualization**: Live tracking of adaptive stop levels
- **Support/Resistance Lines**: Key level identification
- **Time Window Background**: Visual confirmation of active trading periods
**Dual Dashboard System**:
- **Strategy Dashboard**: Real-time position info, settings status, and current levels
- **Performance Scorecard**: Live P&L tracking, win rates, and trade statistics
- **Customizable Sizing**: Small, Medium, or Large display options
### ⚙️ Comprehensive Customization
**Core Strategy Settings**:
- **Lookback Period**: Support/resistance calculation period (5-100 bars)
- **ATR Configuration**: Period and multipliers for stops/targets
- **Reward-to-Risk Ratios**: Customizable profit target calculations
- **Trend Filter Options**: EMA/SMA selection with adjustable periods
**Time Filter Controls**:
- **Trading Hours**: Start/end times in 12-hour format
- **Timezone Selection**: Four major timezone options
- **Day Restrictions**: Weekend-only, weekday-only, or unrestricted
- **Session Management**: Lunch hour avoidance and custom periods
**Risk Management Options**:
- **Trailing Stop Modes**: Conservative/Balanced/Aggressive presets
- **Partial Close Settings**: Enable/disable with custom quantities
- **Alert System**: Comprehensive notifications for all trade events
### 📈 Performance Tracking
**Real-Time Metrics**:
- Net profit/loss calculation
- Win rate percentage
- Profit factor analysis
- Maximum drawdown tracking
- Total trade count and breakdown
- Current position P&L
**Trade Analytics**:
- Winner/loser ratio tracking
- Real-time performance scorecard
- Strategy effectiveness monitoring
- Risk-adjusted return metrics
### 🔔 Alert System
**Comprehensive Notifications**:
- Entry signal alerts with price and quantity
- Take profit level hits (TP1 and TP2)
- Stop loss activations
- Trailing stop engagements
- Position closure notifications
## Strategy Logic Deep Dive
### Entry Signal Generation
The strategy identifies high-probability reversal points by combining multiple confirmation factors:
1. **Price Action**: Looks for price interaction with key support/resistance levels
2. **Volume Confirmation**: Ensures sufficient market interest and liquidity
3. **Trend Alignment**: Optional filter prevents counter-trend positions
4. **Time Validation**: Only trades during user-defined optimal periods
5. **Zone Analysis**: Entry occurs within calculated buffer zones around key levels
### Risk Management Philosophy
FlowState Trader employs a three-tier risk management approach:
1. **Initial Protection**: ATR-based stop losses set at strategy entry
2. **Profit Preservation**: Trailing stops activate once position becomes profitable
3. **Scaled Exit**: Partial profit-taking allows for both security and potential
### Time-Based Edge
The time filtering system recognizes that not all trading hours are equal:
- Avoids low-volume, high-spread periods
- Focuses on optimal liquidity windows
- Prevents trading during news events (lunch hours)
- Allows customization for different market sessions
## Best Practices and Optimization
### Recommended Settings
**For Scalping (1-5 minute charts)**:
- Lookback Period: 10-20
- ATR Period: 14
- Trailing Stop: Conservative mode
- Time Filter: Major session hours only
**For Day Trading (15-60 minute charts)**:
- Lookback Period: 20-30
- ATR Period: 14-21
- Trailing Stop: Balanced mode
- Time Filter: Extended trading hours
**For Swing Trading (4H+ charts)**:
- Lookback Period: 30-50
- ATR Period: 21+
- Trailing Stop: Aggressive mode
- Time Filter: Disabled or very broad
### Market Compatibility
- **Forex**: Excellent for major pairs during active sessions
- **Stocks**: Ideal for liquid stocks during market hours
- **Futures**: Perfect for index and commodity futures
- **Crypto**: Effective on major cryptocurrencies (24/7 capability)
### Risk Considerations
- **Market Conditions**: Performance varies with volatility regimes
- **Timeframe Selection**: Lower timeframes require tighter risk management
- **Position Sizing**: Never risk more than 1-2% of account per trade
- **Backtesting**: Always test on historical data before live implementation
## Educational Value
FlowState serves as an excellent learning tool for:
- Understanding support/resistance trading
- Learning proper time-based filtering
- Mastering trailing stop techniques
- Developing systematic trading approaches
- Risk management best practices
## Disclaimer
This strategy is for educational and informational purposes only. Past performance does not guarantee future results. Trading involves substantial risk of loss and is not suitable for all investors. Users should thoroughly backtest the strategy and understand all risks before live trading. Always use proper position sizing and never risk more than you can afford to lose.
---
*FlowState Trader represents the evolution of systematic trading - combining classical technical analysis with modern risk management and intelligent time filtering to help traders achieve their optimal performance state through systematic, disciplined execution.*
