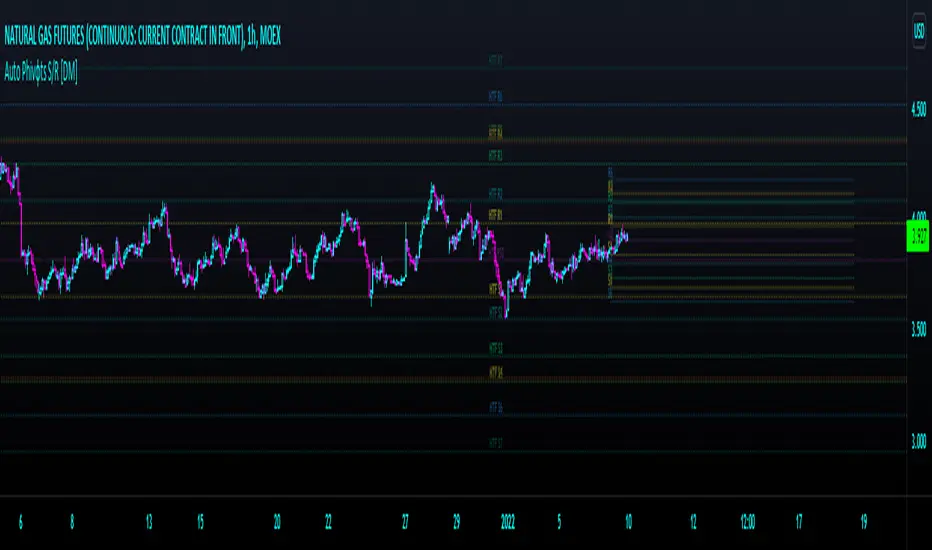
Auto Phivots PP S/R Log /Lin V2 [DM]Greetings, I cover version two since the code has had great changes.
This script has two time frames with a separate symbol from the main window.
Alerts for the two different configurable time frames.
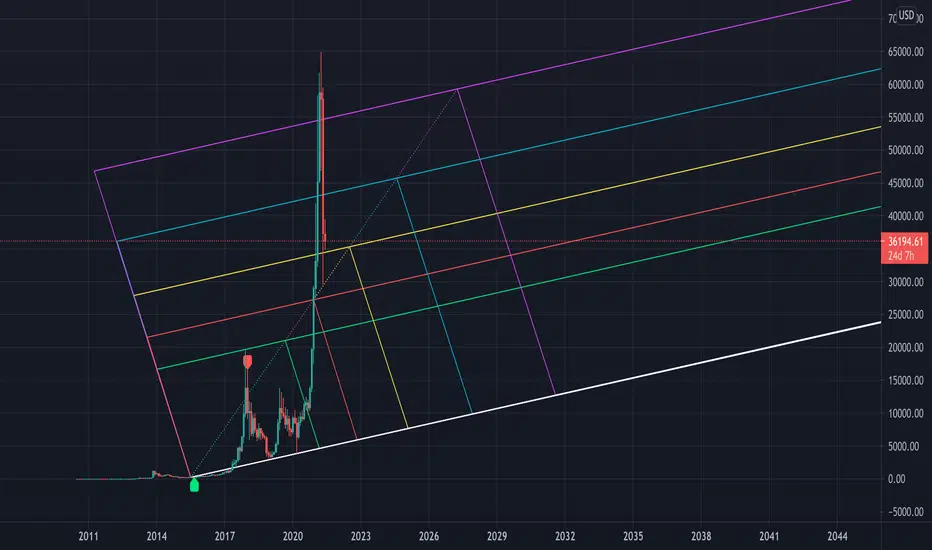
Van use for a big ranges or small and Log Scales.
The colors, extensions, thickness, style of the lines and the labels are completely configurable.
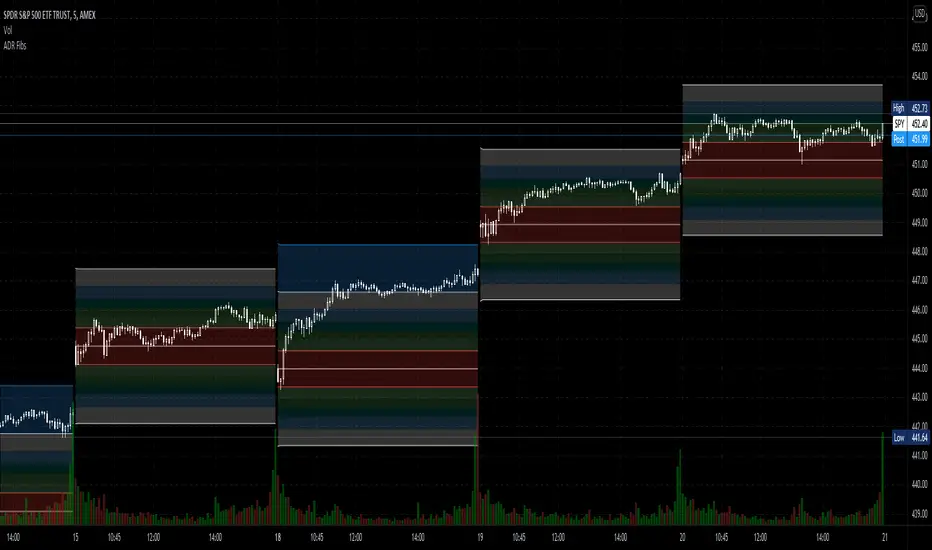
With a few small adjustments it can be used in a separate window with another symbol
Enjoy BigfOOts
Pine Script®指標