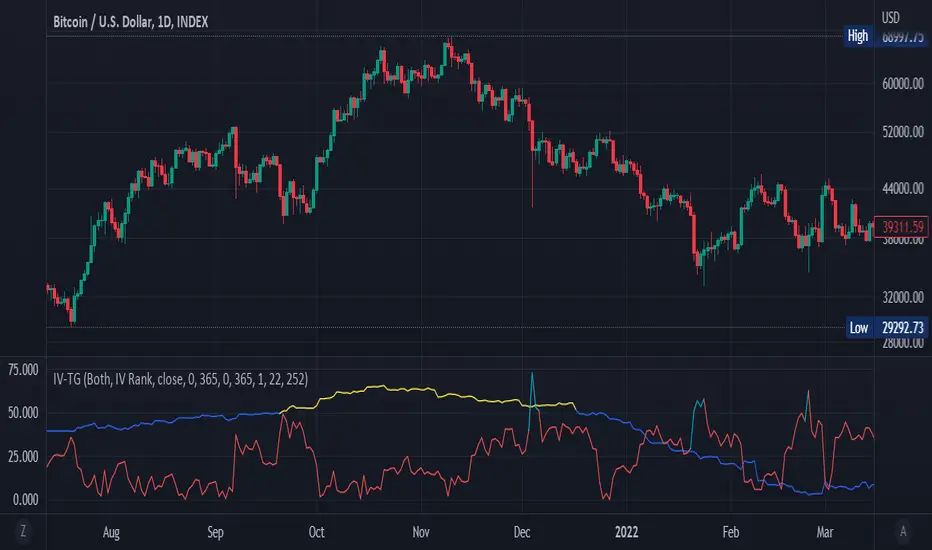
Implied Volatility Suite (TG Fork)Displays the Implied Volatility, which is usually calculated from options, but here is calculated indirectly from spot price directly, either using a model or model-free using the VIXfix.
The model-free VIXfix based approach can detect times of high volatility, which usually coincides with panic and hence lowest prices. Inversely, the model-based approach can detect times of highest greed.
Forked and updated by Tartigradia to fix some issues in the calculations, convert to pinescript v5 and reverse engineered to reproduce the "Implied Volatility Rank & Model Free IVR" indicator by the same author (but closed source) and allow to plot both model-based and model-free implied volatilities simultaneously.
If you like this indicator, please show the original author SegaRKO some love:
在腳本中搜尋"Implied volatility"
Implied Volatility Estimator using Black Scholes [Loxx]Implied Volatility Estimator using Black Scholes derives a estimation of implied volatility using the Black Scholes options pricing model. The Bisection algorithm is used for our purposes here. This includes the ability to adjust for dividends.
Implied Volatility
The implied volatility (IV) of an option contract is that value of the volatility of the underlying instrument which, when input in an option pricing model (such as Black–Scholes), will return a theoretical value equal to the current market price of that option. The VIX , in contrast, is a model-free estimate of Implied Volatility. The latter is viewed as being important because it represents a measure of risk for the underlying asset. Elevated Implied Volatility suggests that risks to underlying are also elevated. Ordinarily, to estimate implied volatility we rely upon Black-Scholes (1973). This implies that we are prepared to accept the assumptions of Black Scholes (1973).
Inputs
Spot price: select from 33 different types of price inputs
Strike Price: the strike price of the option you're wishing to model
Market Price: this is the market price of the option; choose, last, bid, or ask to see different results
Historical Volatility Period: the input period for historical volatility ; historical volatility isn't used in the Bisection algo, this is to serve as a comparison, even though historical volatility is from price movement of the underlying asset where as implied volatility is the volatility of the option
Historical Volatility Type: choose from various types of implied volatility , search my indicators for details on each of these
Option Base Currency: this is to calculate the risk-free rate, this is used if you wish to automatically calculate the risk-free rate instead of using the manual input. this uses the 10 year bold yield of the corresponding country
% Manual Risk-free Rate: here you can manually enter the risk-free rate
Use manual input for Risk-free Rate? : choose manual or automatic for risk-free rate
% Manual Yearly Dividend Yield: here you can manually enter the yearly dividend yield
Adjust for Dividends?: choose if you even want to use use dividends
Automatically Calculate Yearly Dividend Yield? choose if you want to use automatic vs manual dividend yield calculation
Time Now Type: choose how you want to calculate time right now, see the tool tip
Days in Year: choose how many days in the year, 365 for all days, 252 for trading days, etc
Hours Per Day: how many hours per day? 24, 8 working hours, or 6.5 trading hours
Expiry date settings: here you can specify the exact time the option expires
*** the algorithm inputs for low and high aren't to be changed unless you're working through the mathematics of how Bisection works.
Included
Option pricing panel
Loxx's Expanded Source Types
Related Indicators
Cox-Ross-Rubinstein Binomial Tree Options Pricing Model

Implied Volatility TestThought for 42sOverview of the "Implied Volatility Suite" Indicator
The "Implied Volatility Suite" is a custom TradingView indicator written in Pine Script (version 6) designed to estimate and visualize implied volatility (IV) for any stock or asset charted on TradingView. Unlike true implied volatility derived from options pricing (e.g., via Black-Scholes), this script provides a synthetic approximation based on historical price data. It offers flexibility by allowing users to choose between two calculation methods: "Model Implied Volatility" (a statistical projection based on log-normal assumptions) or "VixFix" (a historical volatility proxy inspired by Larry Williams' VIX Fix indicator). The output is plotted as an oscillating line, similar to the Relative Strength Index (RSI), making it easy to interpret overbought/oversold conditions or trends in volatility. Users can select what to plot: raw Implied Volatility, IV Rank, IV Percentile, or Volatility Skew Index, with color-coded visuals for quick analysis (e.g., red/green thresholds for ranks/percentiles).
This indicator is particularly useful for stocks without listed options, where real IV data isn't available, or for traders seeking a quick volatility gauge integrated into their charts.
What the Code Does
At its core, the script computes a volatility metric and transforms it into one of four plottable formats, then displays it as a line chart in a separate pane below the main price chart. Here's a breakdown:
User Inputs and Configuration:
Volatility Calculation Method: Choose "Model Implied Volatility" (default) or "VixFix".
Expiry Parameters (for Model method): Minutes, Hours, and Days until expiry (default 45 days). These are combined into Days (as a float for fractional days) and converted to years (Expiry = Days / 365).
Length Parameters: For Model IV rank/percentile (default 365), VixFix length (default 252, with recommendations like 9, 22, etc.), and VixFix rank/percentile length (default 252).
Output Choice: Select "Implied Volatility", "IV Rank", "IV Percentile" (default "IV Rank"), or "Volatility Skew Index".
The script uses spot = close as the reference price.
Core Calculations:
Model Implied Volatility:
Computes log returns: LogReturn = math.log(spot / spot ) (percentage change between prior bars).
Calculates the simple moving average (Average) and standard deviation (STDEV) of log returns over an integer-rounded Days period.
Projects a time-adjusted mean (Time_Average = Days * Average) and standard deviation (Time_STDEV = STDEV * math.sqrt(Days)), assuming a random walk scaled by time.
Derives upper and lower bounds for the price at expiry: upper = spot * math.exp(Time_Average + 1 * Time_STDEV) and lower = spot * math.exp(Time_Average - 1 * Time_STDEV), representing a 1-standard-deviation range under log-normal distribution.
Computes the width of this range (width = upper - lower), halves it to get standard_dev, and annualizes it to sigma: sigma = standard_dev / (spot * math.sqrt(Expiry)).
Applies an "optimizer": If sigma > 1, halve it (to prevent unrealistically high values).
Result: IV (a decimal, e.g., 0.25 for 25% IV).
VixFix (Synthetic VIX Proxy):
Based on Larry Williams' VIX Fix formula, which estimates fear/volatility without options data: (ta.highest(spot, VIXFixLength) - low) / ta.highest(spot, VIXFixLength) * 100.
The script extends this for "upside" and "downside" by shifting the spot and low prices by multiples of standard deviation (0 for base VixFix).
VixFix is the average of upside(0) and downside(0), which are identical, yielding the standard VIX Fix value.
Volatility Skew Index:
Measures asymmetry in volatility (e.g., higher downside vol indicating fear).
For Model: Averages "upside IV" (calculated on spot shifted up by 1,2,3 * stdev) minus "downside IV" (shifted down).
For VixFix: Similar, but using shifted VIX Fix formulas for upside/downside.
Positive skew might indicate upside bias; negative indicates downside.
Rank and Percentile:
IV Rank: Normalizes the current volatility: (Volatility - ta.lowest(Volatility, Len)) / (ta.highest(Volatility, Len) - ta.lowest(Volatility, Len)) * 100.
IV Percentile: Uses ta.percentrank(Volatility, Len) to show what percentage of past values are below the current.
Len depends on the chosen method (e.g., 365 for Model).
Plotting and Visualization:
Selects VolatilityData based on user choice (e.g., IV * 100 for percentage display).
Applies colors: Red (<50) or green (>=50) for rank/percentile; aqua for skew; yellow for raw IV.
Plots as a line: plot(VolatilityData, color=col, title="Volatility Data").
The script switches logic seamlessly via conditionals (e.g., Volatility = VolCalc == "VixFix" ? VixFix : IV), ensuring the chosen method and output are used.
How It Works (Step-by-Step Execution Flow)
Initialization: Reads user inputs and sets spot = close. Computes Days (float) and DaysInt = math.round(Days) for integer lengths in TA functions.
Log Returns and Base Stats: For Model, calculates log returns, then SMA and STDEV over DaysInt.
Projection and IV Derivation: Scales stats to expiry time, computes bounds, derives sigma/IV.
Skew Functions: Defines reusable functions Model_Upside(i) and Model_Downside(i) (or VIX equivalents) to shift prices and recompute IV/VIX on shifted series.
Aggregation: Computes skew as average difference; sets Volatility to IV or VixFix.
Rank/Percentile/Skew: Applies over user-defined lengths.
Output Logic: Determines what to plot and its color based on VolatilityChoice.
Rendering: Plots the line in TradingView's indicator pane, updating bar-by-bar.
This leverages Pine Script's built-in functions like ta.sma, ta.stdev, ta.highest/lowest, and math.exp/log for efficiency.
Pros
Accessibility: Provides IV estimates for non-optionable assets (e.g., individual stocks, ETFs without options), filling a gap in TradingView's native tools.
Customization: Multiple methods (Model for forward-looking, VixFix for historical) and outputs (raw, ranked, percentile, skew) allow tailored analysis. Expiry adjustments make it suitable for options-like thinking.
Visual Simplicity: Oscillates like RSI (0-100 for ranks/percentiles), with intuitive colors, aiding quick decisions (e.g., high IV Rank might signal options selling opportunities).
No External Data Needed: Relies solely on chart data (close, low), making it lightweight and real-time.
Educational Value: Exposes users to volatility concepts like skew and log-normal projections, potentially improving trading strategies.
Flexibility in Timeframes: Works on any chart interval, with adjustable lengths for short-term (e.g., 9-bar VixFix) or long-term (365-day ranks).
Limitations
Not True Implied Volatility: This is a historical or model-based proxy, not derived from actual options prices. It may overestimate/underestimate real market-implied vol, especially during events (e.g., earnings) where options premium spikes unpredictably.
Assumptions in Model Method: Relies on log-normal distribution and constant volatility, ignoring fat tails, jumps, or mean reversion in real markets. The "optimizer" (halving sigma >1) is arbitrary and may distort results.
VixFix Variant Limitations: While based on a proven indicator, the upside/downside shifts (by stdev of prices, not returns) could be inaccurate for skew, as stdev(prices) doesn't scale properly with returns. It's backward-looking, not predictive like true IV.
Data Requirements: Needs sufficient historical bars (e.g., 365 for ranks), failing on new listings or short charts. Rounding Days to integer may introduce minor inaccuracies for fractional expiries.
Computational Intensity: Functions like repeated ta.stdev and shifts for skew (called multiple times per bar) could slow performance on long histories or low-power devices.
No Real-Time Options Integration: Doesn't pull live options data; users must manually compare to actual IV (e.g., via CBOE VIX for indices).
Potential for Misinterpretation: Oscillating line might mislead (e.g., high IV Rank doesn't always mean "sell vol"), and skew calculation is non-standard, requiring user expertise.
Version Dependency: Built for Pine v6 (as of 2025); future TradingView updates could break it, though it's straightforward to migrate.
Overall, this script is a valuable tool for volatility-aware trading but should be used alongside other indicators (e.g., ATR, Bollinger Bands) and validated against real options data when available. For improvements, consider backtesting its signals or integrating alerts for thresholds.1.9sHow can Grok help?
Implied Volatility and Historical VolatilityThis indicator provides a visualization of two different volatility measures, aiding in understanding market perceptions and actual price movements. Remember to combine it with other technical analysis tools and risk management strategies for informed trading decisions. The two measures of volatility:
Implied Volatility: Based on the standard deviation of recent price changes, it represents the market's expectation of future volatility.
Historical Volatility: Measured by the daily high-low range as a percentage of the closing price, it reflects the actual volatility experienced recently. It is intended to be used along side the Mean and Standard Deviation Lines indicator.
Inputs:
Period (Days): Defines the number of past bars used to calculate both types of volatility.
Calculations:
Interpretation:
Comparing the lines: Divergence between the lines can indicate potential mispricing:
If the Implied Volatility is higher than the Historical Volatility, the market might be overestimating future volatility.
Conversely, if the Implied Volatility is lower, the market might be underestimating future volatility.
Monitoring trends: Track changes in both lines over time to identify potential shifts in volatility expectations or actual market behavior.
Limitations:
Assumes normality in price distribution, which may not always hold true.
Historical Volatility only reflects past behavior, not future expectations.
Consider other factors like market sentiment and news events for comprehensive volatility analysis.

Implied volatility indicator - Bouhmidi-Bands Volatility trading with the Bouhmidi-Bands
Most known indicators such as Bollinger Bands or Keltner Channel focus only on historical volatility. Bouhmidi bands follow a different approach, namely an indicator based on implied volatility.
Style tags: Implied Volatility, Volatility Trading, Trend Analysis
Asset class: Equities, Futures, Commodities
Dataset: Minutes / Hours
Description
The most famous volatility indicators such as Bollinger Bands , Keltner Channel , Donchian Channels , etc. all use the historical volatility of the underlying asset. However, volatility is determined not only by historical volatility but also by implied volatility. The additional analysis of implied volatility sharpens the view and improves trading.
The Bouhmidi Bands ® were developed by myself and are based on implied volatility. They calculate an expected daily bandwidth under the assumption of normally distributed returns. The bandwidth is based on 1σ or 2σ. This means that an underlying closes with a probability of 68% or 95% within the expected Bouhmidi bandwidth at the end of the day. Check the historical development. The track record over the past 20 years shows a strong robustness of the indicator.
Benefits using Bouhmidi bands
- The Bouhmidi bands can be used to identify and filter "invisible" resistance and support that cannot be detected with simple chart analysis.
- The Bouhmidi bands can be used for different trading approaches. For example, they are suitable for mean reversion and volatility breakouts.
- If you combine the Bouhmidi bands with e.g. Keltner channel or Bollinger bands, you have the historical and implied volatility in one view in your tradingview chart.
Which underlyings can I trade with the Bouhmidi bands?
To determine the Bouhmidi bands, we need the underlying and the corresponding implied volatility index:
- S&P 500 - VIX
- DAX - VDAX-NEW
- Dow Jones - VXD
- Nasdaq 100 - VXN
- Gold - GVZ
- WTI - OVX
- Apple - VXAPL
- Amazon - VXAZN
- Google - VXGOG
- IBM - VXIBM

Implied Volatility SuiteThis is an updated, more robust, and open source version of my 2 previous scripts : "Implied Volatility Rank & Model-Free IVR" and "IV Rank & IV Percentile".
This specific script provides you with 4 different types of volatility data: 1)Implied volatility, 2) Implied Volatility Rank, 3)Implied Volatility Percentile, 4)Skew Index.
1) Implied Volatility is the market's forecast of a likely movement, usually 1 standard deviation, in a securities price.
2) Implied Volatility Rank, ranks IV in relation to its high and low over a certain period of time. For example if over the past year IV had a high of 20% and a low of 10% and is currently 15%; the IV rank would be 50%, as 15 is 50% of the way between 10 & 20. IV Rank is mean reverting, meaning when IV Rank is high (green) it is assumed that future volatility will decrease; while if IV rank is low (red) it is assumed that future volatility will increase.
3) Implied Volatility Percentile ranks IV in relation to how many previous IV data points are less than the current value. For example if over the last 5 periods Implied volatility was 10%,12%,13%,14%,20%; and the current implied volatility is 15%, the IV percentile would be 80% as 4 out of the 5 previous IV values are below the current IV of 15%. IV Percentile is mean reverting, meaning when IV Percentile is high (green) it is assumed that future volatility will decrease; while if IV percentile is low (red) it is assumed that future volatility will increase. IV Percentile is more robust than IV Rank because, unlike IV Rank which only looks at the previous highs and lows, IV Percentile looks at all data points over the specified time period.
4)The skew index is an index I made that looks at volatility skew. Volatility Skew compares implied volatility of options with downside strikes versus upside strikes. If downside strikes have higher IV than upside strikes there is negative volatility skew. If upside strikes have higher IV than downside strikes then there is positive volatility skew. Typically, markets have a negative volatility skew, this has been the case since Black Monday in 1987. All negative skew means is that projected option contract prices tend to go down over time regardless of market conditions.
Additionally, this script provides two ways to calculate the 4 data types above: a)Model-Based and b)VixFix.
a) The Model-Based version calculates the four data types based on a model that projects future volatility. The reason that you would use this version is because it is what is most commonly used to calculate IV, IV Rank, IV Percentile, and Skew; and is closest to real world IV values. This version is what is referred to when people normally refer to IV. Additionally, the model version of IV, Rank, Percentile, and Skew are directionless.
b) The VixFix version calculates the four data types based on the VixFix calculation. The reason that you would use this version is because it is based on past price data as opposed to a model, and as such is more sensitive to price action. Additionally, because the VixFix is meant to replicate the VIX Index (except it can be applied to any asset) it, just like the real VIX, does have a directional element to it. Because of this, VixFix IV, Rank, and Percentile tend to increase as markets move down, and decrease as markets move up. VixFix skew, on the other hand, is directionless.
How to use this suite of tools:
1st. Pick the way you want your data calculated: either Model-Based or VixFix.
2nd. Input the various length parameters according to their labels:
If you're using the model-based version and are trading options input your time til expiry, including weekends and holidays. You can do so in terms of days, hours, and minutes. If you're using the model-based version but aren't trading options you can just use the default input of 365 days.
If you're using the VixFix version, input how many periods of data you want included in the calculation, this is labeled as "VixFix length". The default value used in this script is 252.
3rd. Finally, pick which data you want displayed from the dropdown menu: Implied Volatility, IV Rank, IV Percentile, or Volatility Skew Index.

Implied Volatility WallsThe Implied Volatility Walls (IVW) indicator is a powerful and advanced trading tool designed to help traders identify key market zones where price may encounter significant resistance or support based on volatility. Using implied volatility, historical volatility, and machine learning models, IVW provides traders with a comprehensive understanding of market dynamics. This indicator is especially useful for those who wish to forecast volatility-driven price movements and adjust their trading strategies accordingly.
How the Implied Volatility Walls (IVW) Works:
The Implied Volatility Walls (IVW) indicator uses a combination of historical price data and advanced machine learning algorithms to calculate key volatility levels and forecast future market conditions. It tracks cumulative volatility, identifies support and resistance zones, and detects liquidation bubbles to highlight critical price areas.
The main concept behind this tool is that price tends to move most of the time by the same amount, making it possible to average the past maximum excursion in order to obtain a validated area where traders can be able to see clearly that the price is moving more than normal.
This indicator primarily focuses on:
1. Volatility Zones: Potential support and resistance levels based on implied and historical volatility.
2. Machine Learning Volatility Forecast: A machine learning model that predicts high, medium, or low volatility for future market conditions.
3. Liquidation Detection: Highlights key areas of potential forced liquidations, where market participants may be forced out of their positions, often leading to significant price movements.
4. Backtesting and Win Rate: The indicator continuously monitors how effective its volatility-based predictions are, offering insights into the performance of its predictions.
Key Features:
1. Volatility Tracking:
- The IVW indicator calculates cumulative volatility by analyzing the range between the high and low prices over time. It also tracks volatility percentiles and separates the market conditions into high, medium, or low volatility zones, enabling traders to gauge how volatile the market is.
2. Volatility Walls (Upper and Lower Zones):
- Upper Volatility Wall (Red Zones): Represent resistance levels where the price might encounter difficulty moving higher due to excess in volatility. This zone is calculated based on the chosen percentile in the settings.
- Lower Volatility Wall (Blue Zones): Represent support levels where price may find buying support.
- These walls help traders visualize potential zones where reversals or breakouts could occur based on volatility conditions.
3. Machine Learning Forecast:
- One of the standout features of the IVW indicator is its machine learning algorithm that estimates future volatility levels. It categorizes volatility into high, medium, and low based on recent data and provides forecasts on what the next market condition is likely to be.
- This forecast helps traders anticipate market conditions and adapt their strategies accordingly. It is displayed on the chart as "Exp. Vol", providing insight into the future expected volatility.
4. VIX Adjustments:
- The indicator can be adjusted using the well-known **VIX (Volatility Index)** to further refine its volatility predictions. This enables traders to incorporate market sentiment into their analysis, improving the accuracy of the predictions for different market conditions.
5. Liquidation Bubbles:
- The Liquidation Bubbles feature highlights areas where large forced selling or buying events may occur, which are usually accompanied by spikes in volatility and volume. These bubbles appear when price deviates significantly from moving averages with substantial volume increases, alerting traders to potential volatile moves.
- Red dots indicate likely forced liquidations on the upside, and blue dots indicate forced liquidations on the downside. These bubbles can help traders spot moments of market stress and potential price swings due to liquidations.
6. Dynamic Volatility Zones:
- IVW dynamically adjusts support and resistance levels as market conditions evolve. This allows traders to always have up-to-date and relevant information based on the latest volatility patterns.
7. Cumulative Volatility Histogram:
- At the bottom of the chart, the purple histogram represents cumulative volatility over time, giving traders a visual cue of whether volatility is building up or subsiding. This can provide early signals of market transitions from low to high volatility, aiding traders in timing their entries and exits more accurately.
8. Backtesting and Win Rate:
- The IVW indicator includes a backtesting function that monitors the success of its volatility predictions over a selected period. It shows a Win Rate (WR) percentage (with 33% meaning that the machine learning algorithm does not bring any edge), representing how often the indicator's predictions were correct. This metric is crucial for assessing the reliability of the model’s forecasts.
9. Opening Range:
- At the beginning of a new session, the indicator will plot two lines indicating the high and the low of the first candle of the new time frame chosen.
Chart Breakdown:
Below is a description of what users see when using the Implied Volatility Walls (IVW) indicator on the chart:
Volatility Walls:
- Red shaded zones at the top represent upper volatility walls (resistance zones), while blue shaded zones at the bottom represent lower volatility walls (support zones). These areas show where price is likely to react due to high or low volatility conditions.
Liquidation Bubbles:
- Red and blue dots plotted above and below the price represent **liquidation bubbles**, indicating moments of market stress where volatility and volume spikes may force market participants to exit positions.
Cumulative Volatility Histogram:
- The purple histogram at the bottom of the chart reflects the buildup of cumulative volatility over time. Higher bars suggest increased volatility, signaling the potential for large price movements, while smaller bars represent calmer market conditions.
Real-Time Support and Resistance Levels:
- Solid and dashed lines represent current and historical support and resistance levels, helping traders identify price zones that have historically acted as volatility-driven turning points.
Gradient Bar Colors:
- The price bars change color based on their proximity to the volatility walls, with different colors representing how close the price is to these key levels. This color gradient provides a quick visual cue of potential market turning points.
Data Tables Explained:
Table 1: **Volatility Information Table (Top Right Corner):
- EV: Expected Volatility (based on the VIX FIX calculation from Larry Williams).
- +V and -V: Represents the adjusted volatility for upward (+V) and downward (-V) movements.
- Exp. Vol: Shows the expected volatility condition for the next period (High, Medium, or Low) based on the machine learning algorithm.
- WR: The Win Rate based on the backtesting of previous volatility predictions (three outcomes, so base Win rate is 33%, and not 50%).
Table 2: Expected Cumulative Range (Top Right Corner of the separated pane):
- Exp. CR: Expected Cumulative Range based on a machine learning algorithm that calculate the most likely outcome (cumulative range) based on the past days and metrics.
How to Use the Indicator:
1. Identify Key Support and Resistance Levels:
- Use the upper (red) and lower (blue) volatility walls to identify zones where the price is likely to face resistance or support due to volatility dynamics.
2. Forecast Future Volatility:
- Pay attention to the Expected Vol field in the table to understand whether the machine learning model predicts high, medium, or low volatility for the next trading session.
3. Monitor Liquidation Bubbles:
- Watch for red and blue bubbles as they can signal significant market events where volatility and volume spikes may lead to sudden price reversals or continuations.
4. Use the Histogram to Gauge Market Conditions:
- The cumulative volatility histogram shows whether the market is entering a high or low volatility phase, helping you adjust your risk accordingly and making you able to identify the potential of the rest of the chosen session.
5. Backtesting Confidence:
- The Win Rate (WR) provides insight into how reliable the indicator’s predictions have been over the backtested period, giving you additional confidence in its future forecasts, remember that considering the 3 scenarios possible (high volatility, medium and low volatility), the standard win rate is 33%, and not 50%!.
Final Notes:
The Implied Volatility Walls (IVW) indicator is a powerful tool for volatility-based analysis, providing traders with real-time data on potential support and resistance levels, liquidation bubbles, and future market conditions. By leveraging a machine learning model for volatility forecasting, this tool helps traders stay ahead of the market’s volatility patterns and make informed decisions.
Disclaimer: This tool is for educational purposes only and should not be solely relied upon for trading decisions. Always perform your own research and risk management when trading.

Implied Volatility LevelsOverview:
The Implied Volatility Levels Indicator is a powerful tool designed to visualize different levels of implied volatility on your trading chart. This indicator calculates various implied volatility levels based on historical price data and plots them as dynamic dotted lines, helping traders identify significant market thresholds and potential reversal points.
Features:
Multi-Level Implied Volatility: The indicator calculates and plots multiple levels of implied volatility, including the mean and both positive and negative standard deviation multiples.
Dynamic Updates: The levels update in real-time, reflecting the latest market conditions without cluttering your chart with outdated information.
Customizable Parameters: Users can adjust the lookback period and the standard deviation multiplier to tailor the indicator to their trading strategy.
Visual Clarity: Implied volatility levels are displayed using distinct colors and dotted lines, providing clear visual cues without obstructing the view of price action.
Support for Multiple Levels: Includes additional levels (up to ±5 standard deviations) for in-depth market analysis.
How It Works:
The indicator computes the standard deviation of the closing prices over a user-defined lookback period. It then calculates various implied volatility levels by adding and subtracting multiples of this standard deviation from the mean price. These levels are plotted as dotted lines on the chart, offering traders a clear view of the current market's volatility landscape.
Usage:
Identify Key Levels: Use the plotted lines to spot potential support and resistance levels based on implied volatility.
Analyze Market Volatility: Understand how volatile the market is relative to historical data.
Plan Entry and Exit Points: Make informed trading decisions by observing where the price is in relation to the implied volatility levels.
Parameters:
Lookback Period (Days): The number of days to consider for calculating historical volatility (default is 252 days).
Standard Deviation Multiplier: A multiplier to adjust the distance of the levels from the mean (default is 1.0).
This indicator is ideal for traders looking to incorporate volatility analysis into their technical strategy, providing a robust framework for anticipating market movements and potential reversals.
Implied Volatility RangeThe Implied Volatility Range is a forward-looking tool that transforms option market data into probability ranges for future prices. Based on the lognormal distribution of asset prices assumed in modern option pricing models, it converts the implied volatility curve into a volatility cone with dynamic labels that show the market’s expectations for the price distribution at a specific point in time. At the selected future date, it displays projected price levels and their percentage change from today’s close across 1, 2, and 3 standard deviation (σ) ranges:
1σ range = ~68.2% probability the price will remain within this range.
2σ range = ~95.4% probability the price will remain within this range.
3σ range = ~99.7% probability the price will remain within this range.
What makes this indicator especially useful is its ability to incorporate implied volatility skew. When only ATM IV (%) is entered, the indicator displays the standard Black–Scholes lognormal distribution. By adding High IV (%) and Low IV (%) values tied to strikes above and below the current price, the indicator interpolates between these inputs to approximate the implied volatility skew. This adjustment produces a market-implied probability distribution that indicates whether the option market is leaning bullish or bearish, based on the data entered in the menu:
ATM IV (%) = Implied volatility at the current spot price (at-the-money).
High IV (%) = Implied volatility at a strike above the current spot price.
High Strike = Strike price corresponding to the High IV input (OTM call).
Low IV (%) = Implied volatility at a strike below the current spot price.
Low Strike = Strike price corresponding to the Low IV input (OTM put).
Expiration (Day, Month, Year) = Option expiration date for the projection.
Once these inputs are entered, the indicator calculates implied probability ranges and, if both High IV and Low IV values are provided, adjusts for skew to approximate the option market’s distribution. If no implied volatility data is supplied, the indicator defaults to a lognormal distribution based on historical volatility, using past realized volatility over the same forward horizon. This keeps the tool functional even without implied volatility inputs, though in that case the output represents only an approximation of ATM IV, not the actual market view.
In summary, the Implied Volatility Range is a powerful tool that translates implied volatility inputs into a clear and practical estimate of the market’s expectations for future prices. It allows traders to visualize the probability of price ranges while also highlighting directional bias, a dimension often difficult to interpret from traditional implied volatility charts. It should be emphasized, however, that this tool reflects only the market’s expectations at a specific point in time, which may change as new information and trading activity reshape implied volatility.

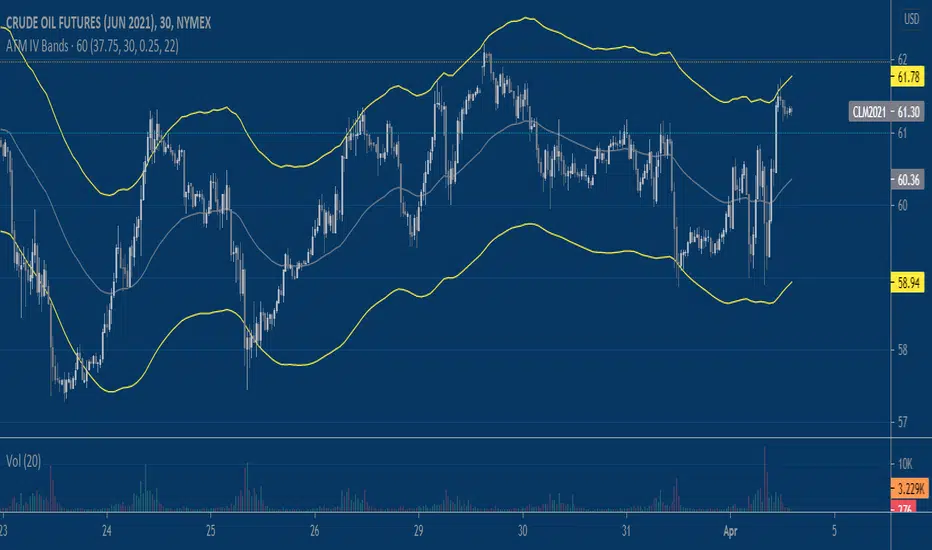
Implied Volatility BandsThis script produces price bands around an EMA based on a manually inputted Implied Volatility. The idea builds on my previous "Implied Move" script which helps visualize the distribution of prices that the market is 'pricing in' via options/implied volatility. It's up to the user to determine the implied volatility level they use, I like using the free version of QuikStrike that you can access via the CME Group website and then update the script's input daily. Another way to use the script is to input the implied volatility based on a forecast that you produce independently. Say implied volatility on June 2021 Crude Oil is 30% and you think it's rich by 2%, you can input 28% into the script to tweak the bands for a declining vol regime.
Implied Volatility PercentileThis script calculates the Implied Volatility (IV) based on the daily returns of price using a standard deviation. It then annualizes the 30 day average to create the historical Implied Volatility. This indicator is intended to measure the IV for options traders but could also provide information for equities traders to show how price is extended in the expected price range based on the historical volatility.
The IV Rank (Green line) is then calculated by looking at the high and low volatility over the number of days back specified in the input parameter, default is 252 (trading days in 1 year) and then calculating the rank of the current IV compared to the High and Low. This is not as reliable as the IV Percentile as the and extreme high or low could have a side effect on the ranking but it is included for those that want to use.
The IV Percentile is calculated by counting the number of days below the current IV, then returns this as a % of the days back in the input
You can adjust the number of days back to check the IV Rank & IV Percentile if you are not wanting to look back a whole year.
This will only work on Daily or higher timeframe charts.

Implied Volatility Percentile (IV Percentile, HVP) [Improved]Indicator showing the Implied Volatility (IV) Percentile for any coin/security.
Areas of low volatility are clearly highlighted. As volatility increases, the IV line moves upwards and the script indicates if the move is Bullish or Bearish.
This script has been designed to be:
Simple - it removes noise and provides a clear visualization of volatility at a glance
Smart - you can define the 'low volatility' threshold and the time period to measure so it can adapt to highly volatile assets in all timeframes
Useful - increased volatility tells us nothing about direction. This script also provides a visual signal indicating if increased volatility corresponds with a bullish or bearish move
How it works:
The script compares the current volatility to the volatility of the last 365 periods. The IV is range-bound between 0% and 100% and so provides a clear view of current volatility relative to previous volatility.
Volatility is typically mean-reverting so the longer a period of low volatility, the more likely it is that an increase is upcoming. This knowledge can be used to place trades in advance of big moves.
Examples of how it can assist your trading:
Using the indicator before Bitcoin's 50% drop in November 2018:
Using the indicator before Cardano's (ADA) 60% rise in early 2019:
IV vs Realised Volatility (VIX/HV Comparator)VIX / HV Comparator – Implied vs Realised Volatility
This indicator compares Implied Volatility (IV) from a volatility index (VIX, India VIX, etc.) with the Realised / Historical Volatility (HV) of the current chart symbol.
It helps you see whether options are pricing volatility as rich or cheap relative to what the underlying is actually doing.
What it does
Pulls IV from any user-selected vol index symbol (e.g. CBOE:VIX for SPX, NSEINDIA:INDIAVIX for Nifty).
Calculates realised volatility from the chart’s price data using returns over a user-defined lookback.
Annualises HV so IV and HV are displayed on the same percentage scale, on any timeframe (intraday or higher).
Optionally shows an IV/HV ratio in a separate pane to highlight when options are rich or cheap relative to realised volatility.
How to read it
Main panel:
Orange line – Implied Volatility (IV) from your chosen vol index.
Aqua line – Realised / Historical Volatility (HV) of the current chart symbol.
Fill between lines:
Green shading -> IV > HV -> options are priced richer than what the underlying is currently realising.
Red shading -> HV > IV -> realised vol is higher than the options market is implying.
Sub-panel (optional):
IV / HV ratio
- Above 1 -> IV > HV (vol rich).
- Below 1 -> IV < HV (vol cheap).
- Horizontal guides (for example 1.2 / 0.8) help frame “significantly rich/cheap” zones.
A small label on the latest bar displays the current IV, HV and their difference in vol points.
Inputs (key ones)
IV Index Symbol – choose the volatility index that corresponds to your underlying (VIX, India VIX, etc.).
Realised Vol Lookback – number of bars used to compute HV (for example 20).
Trading Days per Year and Active Hours per Day – used for annualising HV so it stays consistent across timeframes.
IV Scale Factor – adjust if your IV index is quoted in decimals (0.15) instead of points (15).
Practical uses
Context for options trades – Quickly see if current IV is high or low relative to realised volatility when deciding on strategies (premium selling vs buying, spreads, hedges).
Vol regime analysis – Track shifts where HV starts to rise above IV (real stress building) or IV spikes far above HV (fear premium / insurance bid).
Cross-timeframe checks – Use on intraday charts for short-term trading context, or on daily/weekly charts for bigger picture vol regimes.
This tool is not a stand-alone signal generator. It is meant to be a volatility dashboard you combine with your usual price action, trend, and options strategy rules to understand how the options market is pricing risk vs what the underlying is actually delivering.

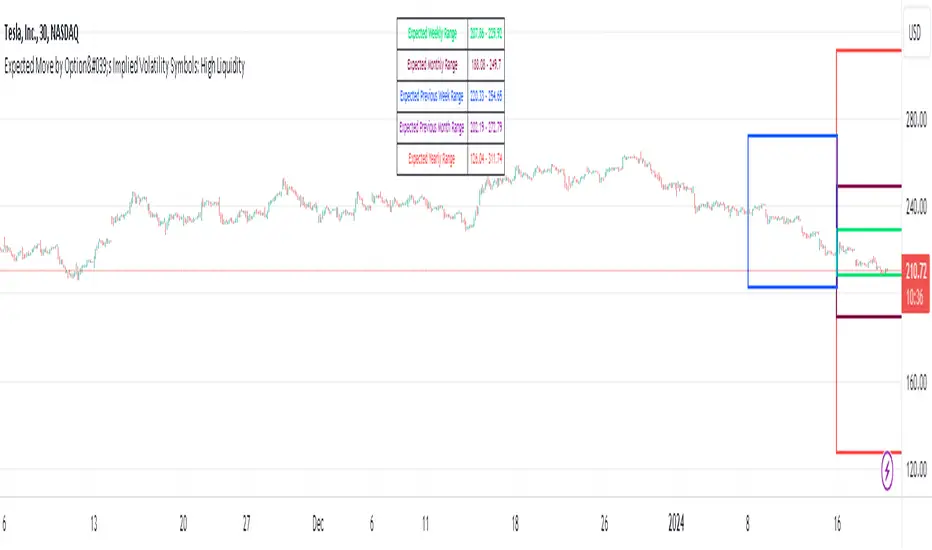
Expected Move by Option's Implied Volatility High Liquidity
This script plots boxes to reflect weekly, monthly and yearly expected moves based on "At The Money" put and call option's implied volatility.
Symbols in range: This script will display Expected Move data for Symbols with high option liquidity.
Weekly Updates: Each weekend, the script is updated with fresh expected move data, a job that takes place every Saturday following the close of the markets on Friday.
In the provided script, several boxes are created and plotted on a price chart to represent the expected price moves for various timeframes.
These boxes serve as visual indicators to help traders and analysts understand the expected price volatility.
Definition of Expected Move: Expected Move refers to the anticipated range within which the price of an underlying asset is expected to move over a specific time frame, based on the current implied volatility of its options. Calculation: Expected Move is typically calculated by taking the current stock price and applying a multiple of the implied volatility. The most commonly used multiple is the one-standard-deviation move, which encompasses approximately 68% of potential price outcomes.
Example: Suppose a stock is trading at $100, and the implied volatility of its options is 20%. The one-standard-deviation expected move would be $100 * 0.20 = $20.
This suggests that there is a 68% probability that the stock's price will stay within a range of $80 to $120 over the specified time frame. Usage: Traders and investors use the expected move as a guideline for setting trading strategies and managing risk. It helps them gauge the potential price swings and make informed decisions about buying or selling options.There is a 68% chance that the underlying asset stock or ETF price will be within the boxed area at option expiry. The data on this script is updating weekly at the close of Friday, calculating the implied volatility for the week/month/year based on the "at the money" put and call options with the relevant expiry. This script will display Expected Move data for Symbols within the range of JBL-NOTE in alphabetical order.
In summary, implied volatility reflects market expectations about future price volatility, especially in the context of options. Expected Move is a practical application of implied volatility, helping traders estimate the likely price range for an asset over a given period. Both concepts play a vital role in assessing risk and devising trading strategies in the options and stock markets.
Expected Move by Option's Implied Volatility Symbols: EAT - GBDC
This script plots boxes to reflect weekly, monthly and yearly expected moves based on "At The Money" put and call option's implied volatility.
Symbols in range: This script will display Expected Move data for Symbols within the range of EAT-GDBC in alphabetical order.
Weekly Updates: Each weekend, the script is updated with fresh expected move data, a job that takes place every Saturday following the close of the markets on Friday.
In the provided script, several boxes are created and plotted on a price chart to represent the expected price moves for various timeframes.
These boxes serve as visual indicators to help traders and analysts understand the expected price volatility.
Definition of Expected Move: Expected Move refers to the anticipated range within which the price of an underlying asset is expected to move over a specific time frame, based on the current implied volatility of its options. Calculation: Expected Move is typically calculated by taking the current stock price and applying a multiple of the implied volatility. The most commonly used multiple is the one-standard-deviation move, which encompasses approximately 68% of potential price outcomes.
Example: Suppose a stock is trading at $100, and the implied volatility of its options is 20%. The one-standard-deviation expected move would be $100 * 0.20 = $20.
This suggests that there is a 68% probability that the stock's price will stay within a range of $80 to $120 over the specified time frame. Usage: Traders and investors use the expected move as a guideline for setting trading strategies and managing risk. It helps them gauge the potential price swings and make informed decisions about buying or selling options. There is a 68% chance that the underlying asset stock or ETF price will be within the boxed area at option expiry. The data on this script is updating weekly at the close of Friday, calculating the implied volatility for the week/month/year based on the "at the money" put and call options with the relevant expiry.
In summary, implied volatility reflects market expectations about future price volatility, especially in the context of options. Expected Move is a practical application of implied volatility, helping traders estimate the likely price range for an asset over a given period. Both concepts play a vital role in assessing risk and devising trading strategies in the options and stock markets.

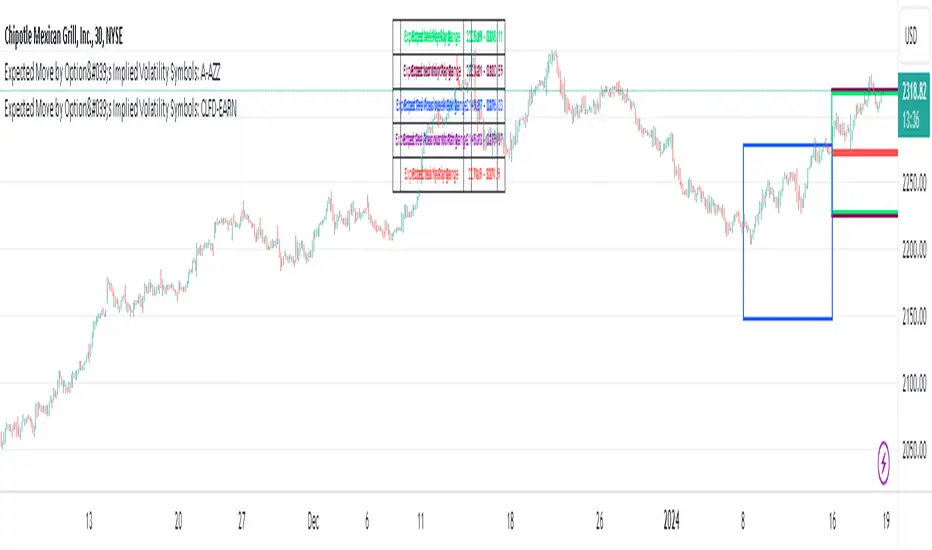
Expected Move by Option's Implied Volatility Symbols: CLFD-EARN This script plots boxes to reflect weekly, monthly and yearly expected moves based on "At The Money" put and call option's implied volatility.
Symbols in range: This script will display Expected Move data for Symbols within the range of CLFD - EARN in alphabetical order.
Weekly Updates: Each weekend, the script is updated with fresh expected move data, a job that takes place every Saturday following the close of the markets on Friday.
In the provided script, several boxes are created and plotted on a price chart to represent the expected price moves for various timeframes.
These boxes serve as visual indicators to help traders and analysts understand the expected price volatility.
Definition of Expected Move: Expected Move refers to the anticipated range within which the price of an underlying asset is expected to move over a specific time frame, based on the current implied volatility of its options. Calculation: Expected Move is typically calculated by taking the current stock price and applying a multiple of the implied volatility. The most commonly used multiple is the one-standard-deviation move, which encompasses approximately 68% of potential price outcomes.
Example: Suppose a stock is trading at $100, and the implied volatility of its options is 20%. The one-standard-deviation expected move would be $100 * 0.20 = $20.
This suggests that there is a 68% probability that the stock's price will stay within a range of $80 to $120 over the specified time frame. Usage: Traders and investors use the expected move as a guideline for setting trading strategies and managing risk. It helps them gauge the potential price swings and make informed decisions about buying or selling options. There is a 68% chance that the underlying asset stock or ETF price will be within the boxed area at option expiry. The data on this script is updating weekly at the close of Friday, calculating the implied volatility for the week/month/year based on the "at the money" put and call options with the relevant expiry.
In summary, implied volatility reflects market expectations about future price volatility, especially in the context of options. Expected Move is a practical application of implied volatility, helping traders estimate the likely price range for an asset over a given period. Both concepts play a vital role in assessing risk and devising trading strategies in the options and stock markets.
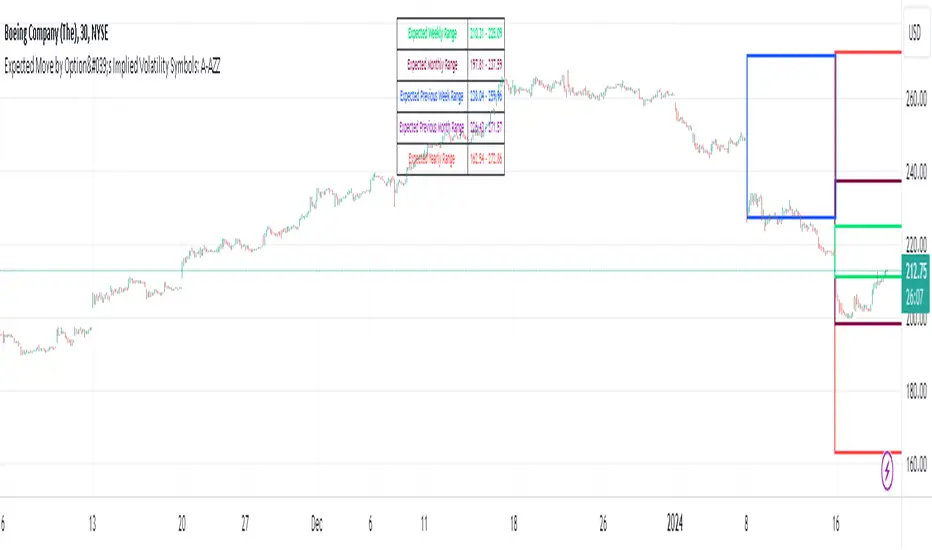
Expected Move by Option's Implied Volatility Symbols: A - AZZ
This script plots boxes to reflect weekly, monthly and yearly expected moves based on "At The Money" put and call option's implied volatility.
Symbols in range: This script will display Expected Move data for Symbols within the range of A - AZZ in alphabetical order.
Weekly Updates: Each weekend, the script is updated with fresh expected move data, a job that takes place every Saturday following the close of the markets on Friday.
In the provided script, several boxes are created and plotted on a price chart to represent the expected price moves for various timeframes.
These boxes serve as visual indicators to help traders and analysts understand the expected price volatility.
Definition of Expected Move: Expected Move refers to the anticipated range within which the price of an underlying asset is expected to move over a specific time frame, based on the current implied volatility of its options. Calculation: Expected Move is typically calculated by taking the current stock price and applying a multiple of the implied volatility. The most commonly used multiple is the one-standard-deviation move, which encompasses approximately 68% of potential price outcomes.
Example: Suppose a stock is trading at $100, and the implied volatility of its options is 20%. The one-standard-deviation expected move would be $100 * 0.20 = $20.
This suggests that there is a 68% probability that the stock's price will stay within a range of $80 to $120 over the specified time frame. Usage: Traders and investors use the expected move as a guideline for setting trading strategies and managing risk. It helps them gauge the potential price swings and make informed decisions about buying or selling options. There is a 68% chance that the underlying asset stock or ETF price will be within the boxed area at option expiry. The data on this script is updating weekly at the close of Friday, calculating the implied volatility for the week/month/year based on the "at the money" put and call options with the relevant expiry.
In summary, implied volatility reflects market expectations about future price volatility, especially in the context of options. Expected Move is a practical application of implied volatility, helping traders estimate the likely price range for an asset over a given period. Both concepts play a vital role in assessing risk and devising trading strategies in the options and stock markets.

Expected Move by Option's Implied Volatility Symbols: B - CLF
This script plots boxes to reflect weekly, monthly and yearly expected moves based on "At The Money" put and call option's implied volatility.
Symbols in range: This script will display Expected Move data for Symbols within the range of B - CLF in alphabetical order.
Weekly Updates: Each weekend, the script is updated with fresh expected move data, a job that takes place every Saturday following the close of the markets on Friday.
In the provided script, several boxes are created and plotted on a price chart to represent the expected price moves for various timeframes.
These boxes serve as visual indicators to help traders and analysts understand the expected price volatility.
Definition of Expected Move: Expected Move refers to the anticipated range within which the price of an underlying asset is expected to move over a specific time frame, based on the current implied volatility of its options. Calculation: Expected Move is typically calculated by taking the current stock price and applying a multiple of the implied volatility. The most commonly used multiple is the one-standard-deviation move, which encompasses approximately 68% of potential price outcomes.
Example: Suppose a stock is trading at $100, and the implied volatility of its options is 20%. The one-standard-deviation expected move would be $100 * 0.20 = $20.
This suggests that there is a 68% probability that the stock's price will stay within a range of $80 to $120 over the specified time frame. Usage: Traders and investors use the expected move as a guideline for setting trading strategies and managing risk. It helps them gauge the potential price swings and make informed decisions about buying or selling options. There is a 68% chance that the underlying asset stock or ETF price will be within the boxed area at option expiry. The data on this script is updating weekly at the close of Friday, calculating the implied volatility for the week/month/year based on the "at the money" put and call options with the relevant expiry.
In summary, implied volatility reflects market expectations about future price volatility, especially in the context of options. Expected Move is a practical application of implied volatility, helping traders estimate the likely price range for an asset over a given period. Both concepts play a vital role in assessing risk and devising trading strategies in the options and stock markets.
EWMA Implied Volatility based on Historical VolatilityVolatility is the most common measure of risk.
Volatility in this sense can either be historical volatility (one observed from past data), or it could implied volatility (observed from market prices of financial instruments.)
The main objective of EWMA is to estimate the next-day (or period) volatility of a time series and closely track the volatility as it changes.
The EWMA model allows one to calculate a value for a given time on the basis of the previous day's value.
The EWMA model has an advantage in comparison with SMA, because the EWMA has a memory.
The EWMA remembers a fraction of its past by a factor A, that makes the EWMA a good indicator of the history of the price movement if a wise choice of the term is made.
Full details regarding the formula :
www.investopedia.com
In this scenario, we are looking at the historical volatility using the anual length of 252 trading days and a monthly length of 21.
Once we apply all of that we are going to get the yearly volatility.
After that we just have to divide that by the square root of number of days in a year, or weeks in a year or months in a year in order to get the daily/weekly/monthly expected volatility.
Once we have the expected volatility, we can estimate with a high chance where the market top and bottom is going to be and continue our analysis on that premise.
If you have any questions, please let me know !

Wavetrend in Dynamic Zones with Kumo Implied VolatilityI was asked to do one of those, so here we go...
As always free and open source as it should be. Do not pay for such indicators!
A WaveTrend Indicator or also widely known as "Market Cipher" is an Indicator that is based on Moving Averages, therefore its an "lagging indicator". Lagging indicators are best used in combination with leading indicators. In this script the "leading indicator" component are Daily, Weekly or Monthly Pivots . These Pivots can be used as dynamic Support and Resistance , Stoploss, Take Profit etc.
This indicator combination is best used in larger timeframes. For lower timeframes you might need to change settings to your liking.
The general Wavetrend settings are the same that are used in Market Cipher, Market Liberator and such popular indicators.
What are these circles?
-These are the WaveTrend Divergences. Red for Regular-Bearish. Orange for Hidden-Bearish. Green for Regular-Bullish. Aqua for Hidden-Bullish.
What are these white, orange and aqua triangles?
-These are the WaveTrend Pivots. A Pivot counter was added. Every time a pivot is lower than the previous one, an orange triangle is printed, every time a pivot is higher than the previous one an aqua triangle is printed. That mimics a very common way Wavetrend is being used for trading when using those other paid Wavetrend indicators.
What are these Orange and Aqua Zones?
-These are Dynamic Zones based on the indicator itself, they offer more information than static zones. Of course static lines are also included and can be adjusted.
What are the lines between the waves?
-This is a Kumo Cloud Implied Volatility indicator. It is color coded and can be used to indicate if a major market move/bottom/top happened.
What are those numbers on the right?
-The first number is a Bollinger Band indicator that shows if said Bollinger Band is in a state of Oversold/Overbought, the second number is the actual Bollinger Band Width that indicates if the Bollinger Band squeezes, normally that happens right before the market makes an explosive move.
Please keep in mind that this indicator is a tool and not a strategy, do not blindly trade signals, do your own research first! Use this indicator in conjunction with other indicators to get multiple confirmations.

Integrated Implied Volatility C/FThe integrated version of IV CAP/FLOOR Premium and Bitcoin IV C/F.
Illustrating Cap-Floor bands based on statistical calculations using the implied volatility of Bitcoin, foreign currency pairs, commodities, bonds, and indexes.

HV/IV Options Indicator - Muthu SThis HV/IV indicator helps you to select an opt Option Strategy. It creates 5 areas & each area defines the present status of the option premium, which varies from Very Low to Very High. From the bottom, (Option Premium is)
Area 1. Very Low
Area 2. Low
Area 3. Fair
Area 4. High
Area 5. Very High
Find which area, current Implied Volatility (User Input) belongs in & choose the option strategy accordingly. Implied Volatility is marked in Black colour circles.
Kindly note, Prior knowledge of Options, Volatility (Historical & Implied) is mandatory to use this indicator. This is shared for education purpose only.

Sigma-Level1-Sigma-Level Indicator (for 28 FX Pairs)
This TradingView indicator calculates and visualizes the 1-sigma price projection range for the current FX pair, based on implied volatility (IV) and a user-defined reference price.
🔧 User Inputs
1. Implied Volatility (IV) Selection
You can choose which volatility term to apply:
ON (Overnight)
1W (1 Week)
1M (1 Month)
Each currency pair uses manually entered IV values (in %), grouped by base currency (USD, EUR, GBP, etc.).
www.investing.com
2. Base Price Selection
You can define the price level used as the anchor for the sigma projection:
CurrentPrice — live market price
YesterdayClose — close of the previous day
LastHourClose — close of the last 1-hour candle
LastFriday — weekly close from last Friday
LastMonthClose — close of the previous monthly candle
LastYearClose — close of the previous yearly candle
These values are retrieved using the appropriate timeframe (D, W, M, 12M, or 60 for hourly).
📐 How the Calculation Works
The indicator calculates the 1σ range using this formula:
1σ Range = basePrice × (IV / √N) / 100
Where:
basePrice is the selected anchor price.
IV is the selected implied volatility for the current pair.
N is the number of periods per year, depending on the IV term:
√252 for ON (trading days)
√52 for 1W (weeks)
√12 for 1M (months)
The upper and lower bands are then:
1σ Up = basePrice + range
1σ Down = basePrice - range
These bands are plotted only during the current calendar week.
🖼️ Visual Output
Green Line: 1σ Upper Boundary
Red Line: 1σ Lower Boundary
Labels show the exact 1σ values at the most recent bar
⚠️ Disclaimer
This indicator is for informational and analytical purposes only. It does not constitute financial advice, a trading signal, or a guarantee of future performance. Always perform your own research and consult with a qualified financial advisor before making trading decisions.
