Price Action All In One IndicatorIf you are the one who is "Price Action" style & does not want to use many indicators or complex indicators or you are an ICT (The Inner Circle Trader)
student or ICT charter, this simple beautiful All In One Indicator is right for you.
The indicator has the following functions.
TIME ZONE SETTING
The default timezone is New York Time GMT-4, if you leave the time zone setting blank, it will use the symbol timezone. Note that the trading time changes with one hour delay in winter. so if you just trade forex, and leave the time zone setting blank, TradingView will adjust the symbol timezone automatically for you or don't forget to change the timezone setting GMT-4 or GMT-5 depending on daylight saving time.
STATISTIC PANEL
You can choose which panel to show through settings.
Session Info Panel : pips info of ADR, Asian, London, and New York sessions.
Trend Panel : showing trend (up/down) of
5m/15m/1h/4h/D/W time frames (TF)
4MA (default values: SMA with lengths: 20–50–100–200)
Money Management Panel : in trading, money management is very important. Just put the % risk, & stop loss value below, the indicator will calculate a suitable size/amount for each trade.
Size by Lots: input stop loss in pips
Size by Units: input stop loss in % (of price)
(*)Units size is calculated by % stop loss & current bar close price. You have to determine a stop-loss price to convert to % stop loss by yourself.
TIME SEPARATORS
We can choose which time separators we want to display. The indicator has 5 options: Anchor Time/Day/Week/Month/Quarter. Of course, we can choose to show just one or all 5 of them.
With Anchor Time you can choose which time you want to draw a vertical line for better timing analysis. This can show up to 2 Anchor Time lines. The default values are 00:00 (New York Midnight Opening) and 08:30 (New York Session Opening). You also have an option to show the past lines or not.
About Day Separator, cause TradingView has supported Session Breaks in Setting but if you don't like to use it or when enabling, it distracts you, you can use mine. My favorite trading dates are Tuesday & Wednesday.
PRICE LEVELS
For intraday trading, the high/low/close of the previous day, the previous week, ADR (default period is 5) are very important key levels. You can choose which one you like to show for better analysis. Of course, you can change the color & style of the lines. This is also my favorite indicator.
This indicator also has an option to show up to 2 price lines at a specific time, you can choose the price type (high/low/close/open) that you want to display. The default time values are:
Specific Time 1: 0:00. (New York Midnight Opening Price)
Specific Time 2: 8:30 am. (New York Session Opening Price)
ACCUMULATION ZONE
The market tends to reprice the higher/lower to the old high/low or imbalance/fair value price to promote buy/sell stops or to provide smart money pricing for long/short entries. Typically, it redistributes quickly and you must learn to anticipate them at key levels intraday. Weak short/long holders will be squeezed in the retracement.
Except for the open price, the price changes continuously until the closing time, so the accumulation area can also be changed in real-time, but if you combine it with other information when analyzing, you can predict/determine whether the zone has been established or not with high probability. In short, price needs time to be accumulated, I usually don't pay attention to this daily zone till London open/close or New York sessions
Not only daily zone, but the indicator also supports higher timeframes accumulation zone from
SESSION & STD
There are 3 sessions: Asian, London, New York. The default values are below (New York Time).
Asian: 19:00 ~ 00:00
London Open (London KillZone): 01:00 ~ 05:00
New York Open (New York KillZone): 07:00 ~ 10:00
If you do not want to show the label, just leave the label values blank or change them to whatever you want.
This is one of my favorite functions. I use it on 15m, 30m, 1h TF for Forex intraday trading. My favorite trading sessions are London Open & New York Open.
You also can choose to show or not Standard Deviations (STD). The default values are set for Asian Range STD and max STD levels can be shown are 5. I use the following 3 types of STD (New York Time):
CBDR (Central Bank Deviations) STD: 14:00 ~ 20:00
Flout STD: 15:00 ~00:00
Asian Range STD: 19:00 ~ 00:00
LOOKBACK HIGH/LOW/MID
Can show high/low/mid of the data ranges on the daily/4h chart. The default values are:
- 20–40–60 days back from today for daily TF.
- 30–60–90 bars back from the latest bar for 4h TF.
The default anchor bar for calculating the lookback is the latest one but with:
- 4h TF: we can change the lookback from the 1st day of the week.
- Daily TF: we can change the lookback from the 1st day of the month.
The indicator also has options showing the high/low/mid (equilibrium level) lines for better analysis. Especially, on daily TF, we have the option that can show up to 4 lines (25% for each one) of the data range.
Of course, you can change the colors or the style of the high/low/mid lines.
The lookback can be shown on the lower TFs for better detection when the market structure is shifted.
MAGIC BARS
Fractal bar : The bar's color is changed when the divergence occurs between the price & RSI. You can change the RSI period (default value is 14) & RSI source. (open/high/low/close,…)
Imbalance bar or liquidity void or fair value gap - whatever you call it. This is my favorite indicator when trading on all TFs.You can choose to extend the last n imbalance bars if you like in the settings. I make sure I covered all cases of imbalance/fair value gap.
OLD HIGH/LOW
First, this function is not used as the common Support & Resistance that retail traders usually use, so I call it Old High/Low. I usually use it in 2 ways:
Detect the next buy/sell stops that Market Makers aim to manipulate.
Detect whether market structure shifted or not (Break of structure)
In settings you can:
Set the period to detect high/low levels, the default value is 10. My other favorite values are 6 & 2.
On a lower time frame, you might want to set it to a large number to remove noise.
On a higher time frame, a small number is enough, I think.
Choose the numbers of the last lines you want to show on your chart.
Of course, the style of lines can be changed easily.
TRENDLINES
A very simple trendline with default pivot left strength is 10.
By default, trendline uses high/low price but you have the "Using close price" option.
LINEAR REGRESSION CHANNEL
The Linear Regression Channel is a three-line technical indicator used to analyze the upper and lower limits of an existing trend. It is a statistical tool used to predict the future from past data and is used to determine trend direction or when prices may be overextended.
You can choose
To fill the background or not
To show inner/outer lines or not
To change the colors/line styles of upper zone, lower zone, upper lines, lower lines, midline
DIRECTION BOX
Working on all TFs, this looks like the same with lookback function but if you would like to display them in a box for easily focusing/comparing with other symbols or for detecting divergence in a specific period. The indicator also has a setting to show or hide lines connecting between lows or highs.
Another example of how I use High/Low connecting lines to detect divergence between S&P 500 and NASDAQ 100.
ZIG ZAG
Can show up to 2 ZigZag lines.
This is suitable for traders who have difficulty in detecting key levels (recent high/low) of the prices to confirm market structure or just for drawing Fibonacci easily at those levels.
MA (Moving Average)
I believe that this is one of the most used indicators for every trader. There are 5 types of MA to choose from: EMA, SMA, WMA, VWMA, SMMA(RMA).
This can show up to 4 MAs. You can choose the source (close/high/low,…) for each one. My favorite values are 34 & 89 EMA.
This indicator also supports MA Bands. You can select which MA you want to display the bands, and the "width" of the bands can be changed via the settings.
WATERMARK
It's just a simple function but I think it's very useful for those who want to add Copyright info to the chart, to prevent others from copying it.
Others/known issues/limitations
In forex or stock (things that are traded only on weekdays), TradingView's does not include the latest bars till Monday so the Day Separator cannot fill that space. Because TradingView deals with those bars as Sunday's ones so I set the color of Sunday the same as Friday for good UI/UX. On Crypto charts, the indicator shows without problems.
If you see "Internal server study error", please try closing the current TradingView tab in your browser and reopening it in a new tab. The error will disappear.
Because TradingView does not provide any detailed error information when such "general error" occurs. It's very difficult to detect which function is causing this error or is there something that caused TradingView "overloaded" through a long time running/loading on that tab? Honestly, I don't know exactly the cause, but in my experience, this error often occurs in the following cases:
When you have the TradingView Tab open for hours. In my case, I usually leave TradingView tab open overnight & when I come back the next day, this error might appear. (I'm a Mac user & I almost never shut down my Mac)
When you change settings too many times, especially settings of drawing objects like line width in a using session, it might cause this error.
So, after changing the setting or when you come back for the next trade, please save & close that TradingView tab, and then open a new one, everything will work fine.
You can see the images below that show I have tested my indicator from 1-minute time frame, enabled all functions, change every setting to max values & everything still works fine.
在腳本中搜尋"Inner circle trader "

IFVG by Toño# IFVG by Toño - Pine Script Indicator
## Overview
This Pine Script indicator identifies and visualizes **Fair Value Gaps (FVG)** and **Inverted Fair Value Gaps (IFVG)** on trading charts. It provides advanced analysis of price inefficiencies and their subsequent inversions when mitigated.
## Key Features
### 1. Fair Value Gap (FVG) Detection
- **Bullish FVG**: Detected when `low > high ` (gap between current low and high of 2 bars ago)
- **Bearish FVG**: Detected when `high < low ` (gap between current high and low of 2 bars ago)
- Visual representation using colored rectangles (green for bullish, red for bearish)
### 2. Inverted Fair Value Gap (IFVG) Creation
- **IFVG Formation**: When a FVG gets mitigated (price fills the gap with candle body), an IFVG is created
- **Color Inversion**: The IFVG takes the opposite color of the original FVG
- Mitigated bullish FVG → Creates red (bearish) IFVG
- Mitigated bearish FVG → Creates green (bullish) IFVG
- **Mitigation Logic**: Uses only candle body (not wicks) to determine when a FVG is filled
### 3. Customizable Display Options
- **Show Normal FVG**: Toggle visibility of regular Fair Value Gaps
- **Show IFVG**: Toggle visibility of Inverted Fair Value Gaps
- **Smart FVG Display**: Even when "Show Normal FVG" is disabled, FVGs that are part of IFVGs remain visible
- **Extension Control**: Option to extend FVGs until they are mitigated
### 4. IFVG Extension Methods
- **Full Cross Method**: IFVG remains active until price completely crosses through it (including wicks)
- **Number of Bars Method**: IFVG remains active for a specified number of bars (1-100)
### 5. Visual Mitigation Signals
- **Cross Markers**: Shows X-shaped markers when IFVGs are mitigated
- Green cross above bar: Bearish IFVG mitigated
- Red cross below bar: Bullish IFVG mitigated
### 6. Comprehensive Alert System
- **IFVG Formation Alerts**: Notifications when new IFVGs are created
- **IFVG Mitigation Alerts**: Notifications when IFVGs are filled/mitigated
- **Separate Controls**: Individual toggles for bullish and bearish IFVG alerts
## How It Works
### Step-by-Step Process:
1. **FVG Detection**: Script continuously scans for 3-bar patterns that create price gaps
2. **FVG Tracking**: Each FVG is stored with its coordinates, type, and status
3. **Mitigation Monitoring**: Script watches for candle bodies that fill the FVG
4. **IFVG Creation**: Upon mitigation, creates an IFVG with opposite polarity at the same location
5. **IFVG Management**: Tracks and extends IFVGs according to chosen method
6. **Visual Updates**: Dynamically updates colors and visibility based on user settings
## Use Cases
- **Support/Resistance Analysis**: IFVGs often act as strong support/resistance levels
- **Market Structure Understanding**: Helps identify how market inefficiencies get filled and reversed
- **Entry/Exit Timing**: Can be used to time entries around IFVG formations or mitigations
- **Confluence Analysis**: Combine with other technical analysis tools for stronger signals
## Configuration Parameters
- **Colors**: Customizable colors for bullish/bearish FVGs and IFVGs
- **Extension**: Choose how long to display gaps on the chart
- **Alerts**: Full control over notification preferences
- **Visual Clarity**: Options to show/hide different gap types for cleaner charts
## Technical Specifications
- **Pine Script Version**: 5
- **Overlay**: True (displays directly on price chart)
- **Max Boxes**: 500 (supports up to 500 simultaneous gaps)
- **Performance**: Optimized array management for smooth operation
This indicator is particularly valuable for traders who use **Smart Money Concepts (SMC)** and **Inner Circle Trader (ICT)** methodologies, as it provides clear visualization of how institutional order flow creates and fills market inefficiencies.

PreviousDayHLEQCME_MINI:NQ1!
Indicator Overview: The "PreviousDayHLEQ" indicator is an essential tool for traders employing Inner Circle Trader (ICT) methodologies, designed to plot the High (H), Low (L), Equilibrium (EQ, the midpoint between high and low), and Optimal Trade Entry (OTE) levels at 61.8%, 70%, and 79% of the previous trading day's range. It provides a clear visual reference for potential support, resistance, and entry zones based on the prior day's price action, helping traders anticipate continuations or reversals in the current day. This indicator stands out by incorporating directional OTE auto-detection, adjusting levels based on whether the previous day formed a new high or low relative to the day before, offering insights into market bias without manual recalculation.
Core Functionality: It tracks and displays the previous day's high and low, calculating the EQ as the average for balance points, and OTE levels as percentage retracements of the range. The script uses a user-defined trading day definition (with timezone support) to accurately capture the day's extremes, ensuring alignment with global market sessions. This core setup allows traders to quickly identify key ICT levels like fair value gaps or liquidity pools from the prior day.
Unique OTE Auto Detection: One of the indicator's most innovative features is its automatic detection of OTE direction. If the previous day made a new high compared to the day before, OTE levels are calculated downward from the high to the low (bearish bias), highlighting potential short entries. Conversely, a new low triggers upward OTE levels from the low to the high (bullish bias), signaling long opportunities. This auto-detection is unique, as it dynamically adapts to historical price expansion without user input, a capability not found in standard previous day indicators that typically use fixed directions. It empowers ICT traders to gauge carry-over momentum from the prior day, such as in scenarios where a bullish expansion suggests buying dips to the 61.8% level.
Directional Bias Indication: Beyond plotting levels, the OTE calculation inherently indicates the previous day's bias (expansion upward or downward), providing context for current day trades. This unique bias detection helps traders align with market structure, e.g., favoring shorts if OTE is downward-oriented, enhancing decision-making in ICT frameworks like order block identification.
Left-Side Trimming Innovation: The indicator includes a highly unique left-side trimming option, allowing users to restrict the historical extension of lines to a specified number of bars (e.g., the last 8 bars). This reduces visual clutter on charts with long history, focusing attention on recent and relevant price action—a feature rarely seen in previous day indicators, where lines often span the entire chart and obscure current developments. Traders can toggle trimming on/off and adjust the bar count, making it ideal for clean, professional setups.
Customization and Visual Controls: Users can fully customize line colors (separate for high, low, EQ, and each OTE level), styles (solid, dashed, dotted), and label properties (text color, background color, transparency, size). This level of granularity ensures the indicator fits any chart theme or strategy, with options to enable/disable individual elements like EQ or OTE for minimalistic views. The stick-right label option keeps labels visible as the chart updates, preventing overlap.
Auto-Deletion at Trading Day End: Levels can be automatically cleared at the indicator's calculated market close (17:00 NY time), a unique feature that prevents accumulation of outdated data, keeping the chart fresh for the next day. This is particularly useful for day traders who reset their setups daily.
No External Dependencies: The indicator operates solely on chart price data using built-in Pine Script functions, ensuring reliability and compatibility without needing additional libraries or internet access.
How It Works
Previous Day Data Capture: The script identifies the previous trading day using the user-defined timezone and calculates high, low, EQ, and OTE levels based on that day's range.
OTE Calculation: Levels are computed as percentages of the range, with auto-detection switching direction if a new high/low was made relative to the day before.
Drawing and Trimming: Lines are plotted with user-set padding for extension, and trimming cuts the left side to focus on current action.
Update Mechanism: Levels update in real-time as the previous day's data is fixed, but the script refreshes on chart reloads or new days.
Deletion Logic: At market close, if auto-delete is enabled, all elements are removed to prepare for the next cycle.
Uniqueness and Innovation
Session OTE Auto Detection: Automatically determines OTE direction based on previous day's high/low expansion, a rare feature that provides bias insights not available in basic previous day high/low indicators, aiding ICT traders in identifying entry zones with market context.
Left-Side Trimming: This innovation allows customizable historical line length, solving chart clutter issues unique to previous day indicators that typically show full history, enhancing usability for live trading.
Directional OTE with Multi-Level Support: Combines auto-bias detection with three OTE percentages (61.8%, 70%, 79%), offering more granular entry options than single-level tools, tailored for ICT's focus on range retracements.
Independent Customization per Element: Separate controls for high, low, EQ, and OTE colors/styles, plus transparency and size, provide unmatched flexibility compared to rigid indicators.
Auto-Deletion for Cleanliness: Unique cleanup at market close prevents level buildup, a practical feature for multi-day analysis not commonly implemented in similar tools.
How to Use It
Setup: Add to chart, configure timezone (e.g., "America/New_York"), and enable the indicator.
Customization: Adjust line colors (e.g., blue for high), styles (dashed for OTE), and enable trimming (8 bars for focus).
Interpretation: Use OTE for entries (e.g., buy at 61.8% in bullish bias); EQ for reversion.
Tips: Test on historical data; combine with ICT concepts like CISD, FVG etc.
This indicator elevates ICT trading with its auto-detection and trimming. Use with risk management; trading carries risk

Trading Macro Windows by BW v2
Trading Macros by BW: Integrating ICT Concepts for Session Analysis
This indicator combines two key Inner Circle Trader (ICT) concepts—Change in State of Delivery (CISD) or Inverted Fair Value Gap (IFVG) signals with Macro Time Windows—to provide a unified tool for analyzing intraday price action, particularly during Pacific Time (PT) sessions. Rather than simply merging existing scripts, this integration creates a cohesive visual framework that highlights how macro consolidation periods interact with potential reversal or continuation signals like CISD or IFVG. By overlaying macro candle styling and borders on the chart alongside selectable signal lines, traders can better contextualize setups within ICT's macro narrative, where price often manipulates liquidity during these windows before displacing toward higher-timeframe objectives.
Core Components and How They Work Together:
Macro Time Windows (Inspired by ICT's Macro Periods):
ICT emphasizes "macro" as 30-minute windows (e.g., 06:45–07:15 PT, 07:45–08:15 PT, up to 11:45–12:15 PT) where price tends to consolidate, sweep liquidity, or form key structures like Fair Value Gaps (FVGs). These periods set the stage for the session's directional bias.
The indicator styles candles within these windows using a user-defined color for wicks, borders, and bodies (translucent for visibility). This visual emphasis helps traders focus on activity inside macros, where reversals or continuations often originate.
Borders are drawn as vertical lines at the start and end of each window (with a +5 minute buffer to capture related activity), using a dotted style by default. This creates a "study zone" that encapsulates macro events, allowing traders to assess if price is respecting or violating these zones in alignment with broader ICT models like the Power of 3 (AMD cycle).
Toggle: "Macro Candles Enabled" (default: true) – Turn off to disable styling and borders if focusing solely on signals.
CISD or IFVG Signals (Selectable Mode):
Mode Selection: Choose between "Change in the State of Delivery" (CISD) or "IFVG" (default: IFVG). Both detect shifts in market delivery during specific 30-minute slices (15–45 or 17–45 minutes past the hour in PT sessions).
CISD Mode: Based on ICT's definition of a sudden directional shift, this identifies aggressive displacements after sweeping recent highs/lows. It uses a rolling reference high/low over 6 bars, checks for sweeps (penetrating by at least 2 ticks in the last 2-3 bars), reclamation (closing beyond the reference with at least 50% body), and displacement (50% of prior range or an immediate FVG of 6+ ticks). Signals plot a horizontal line from the close, extending 24 bars right, labeled "CISD."
IFVG Mode: Focuses on Inverted Fair Value Gaps, where a bullish FVG (low > high by 13+ ticks) forms but is inverted (closed below) in the same slice, signaling bearish intent (or vice versa). This targets violations against opposing liquidity, often leading to raids on external ranges. Signals plot similarly, labeled "IFVG."
Shared Logic: Both modes enforce a 55-bar cooldown to prevent clustering, operate only during PT sessions (06:30–13:00), and use tick-based thresholds for precision across instruments. The integration with macros allows traders to see if signals occur within or at the edges of macro windows, enhancing confirmation—for example, a CISD inside a macro might indicate a manipulated reversal toward the session's true objective.
Toggle: "Signals Enabled" (default: true) – Turn off to hide all signal lines and labels, isolating the macro visualization.
How Components Interact:
Macro windows provide the "narrative context" (consolidation/manipulation), while CISD/IFVG signals detect the "delivery shift" (displacement). Together, they form a mashup that justifies publication: isolated signals can be noisy, but when filtered by macro periods, they align with ICT's session model. For instance, an IFVG inversion during a macro might confirm a liquidity sweep before targeting PD arrays or order blocks.
No external dependencies; all calculations are self-contained using Pine's built-in functions like ta.highest/lowest for references and time-based sessions for windows.
Usage Guidelines:
Apply to intraday charts (e.g., 1-5 min) or stocks during PT hours.
Look for confluence: A bull IFVG signal post-macro low sweep might target the next macro high or daily bias.
Customize colors/styles for signals (solid/dashed/dotted lines) and macros to suit your chart.
Backtest in replay mode to observe how macros frame signals—e.g., price often respects macro borders as S/R.
Limitations: Timezone-fixed to PT (America/Los_Angeles); signals are directional hints, not trade entries. Combine with ICT tools like order blocks or liquidity pools for full setups.
This script draws from community ICT implementations but refines them into a single, purpose-built tool for macro-driven trading, reducing chart clutter while emphasizing interconnected concepts. Feedback welcome!

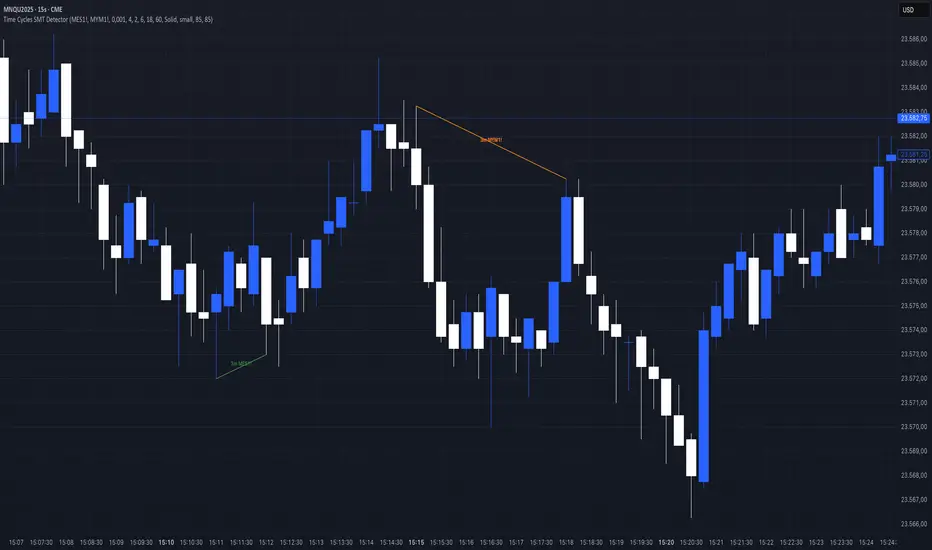
Time Cycles SMT Detector📊 Overview
The Time Cycles SMT Detector is an advanced indicator designed to identify Smart Money Technique (SMT) divergences across multiple time cycles during the New York trading session. It compares price action between correlated instruments to spot institutional footprints and potential market reversals.
🎯 What is SMT (Smart Money Timing)?
SMT occurs when correlated markets fail to make matching highs or lows, indicating potential institutional manipulation or positioning. This divergence often precedes significant market moves.
⚙️ Key Features
Multi-Timeframe Cycle Analysis:
90-minute cycles (6 cycles per trading day) - Major institutional positioning
30-minute cycles (18 cycles per trading day) - Intermediate market structure
10-minute cycles (54 cycles per trading day) - Intraday momentum shifts
3-minute cycles (180 cycles per trading day) - Scalping opportunities
Intelligent Overlap Prevention
Hierarchical priority system prevents visual clutter
Higher timeframe SMTs take precedence over lower timeframes
Clean, readable charts even with multiple active signals
Dual Correlation Analysis
Compare your main chart with two different instruments simultaneously
Default setup: MES1! (S&P 500) and MYM1! (Dow Jones)
Fully customizable ticker selection
📈 Trading Signals
Bullish SMT
Main instrument makes a higher low while correlated instrument makes a lower low
Indicates potential upward movement
Displayed with customizable bullish colors (default: green for MES, aqua for MYM)
Bearish SMT
Main instrument makes a lower high while correlated instrument makes a higher high
Indicates potential downward movement
Displayed with customizable bearish colors (default: red for MES, orange for MYM)
🔧 Customization Options
Visual Settings:
Toggle individual timeframe cycles on/off
Customize colors for each ticker's bullish/bearish signals
Choose line styles (solid, dashed, dotted)
Show/hide cycle text labels
Optional SMT zones with adjustable transparency
Cycle boxes for visual time segmentation
Analysis Settings:
Compare only consecutive cycles or scan multiple cycles back
Adjust maximum cycles to compare (1-20)
Enable/disable bullish or bearish SMT detection separately
Real-time alerts for all timeframes
💡 How to use it
Add to your chart - Works best on 1-minute timeframe for maximum precision
Select your correlated instruments - Default MES/MYM for NQ traders
Monitor for divergences - Look for SMT lines connecting cycle highs/lows
Confirm with market context - Use alongside your existing strategy
Trade the convergence - Expect prices to realign after SMT divergence
🎓 Best Practices
Focus on higher timeframes first - 90m and 30m SMTs carry more weight
Look for confluence - Multiple timeframes showing same direction SMT
Time your entries - Use lower timeframe SMTs (10m, 3m) for precise entry timing
Respect the hierarchy - When overlapping signals occur, higher timeframes have priority
⏰ Trading Hours
The indicator operates during New York trading hours (7:00 AM - 4:00 PM ET), automatically resetting at the start of each trading day.
🚀 Why This Indicator?
Institutional Logic: Based on how smart money creates divergences before major moves
Multi-dimensional Analysis: Four different time cycles provide complete market perspective
Clean Visualization: Smart overlap prevention keeps your charts readable
Flexible Configuration: Adapt to any correlated market pairs
Real-time Alerts: Never miss a significant SMT formation
📝 Notes
Designed primarily for index futures (NQ, ES, YM) but works with any correlated instruments
Best results on 1-minute charts for accurate cycle detection
All cycles reset at 7:00 AM New York time
Maximum effectiveness during regular trading hours
Acknowledgement
This indicator is based on ICT (Inner Circle Trader) concepts and Smart Money techniques for identifying institutional order flow through market divergences.
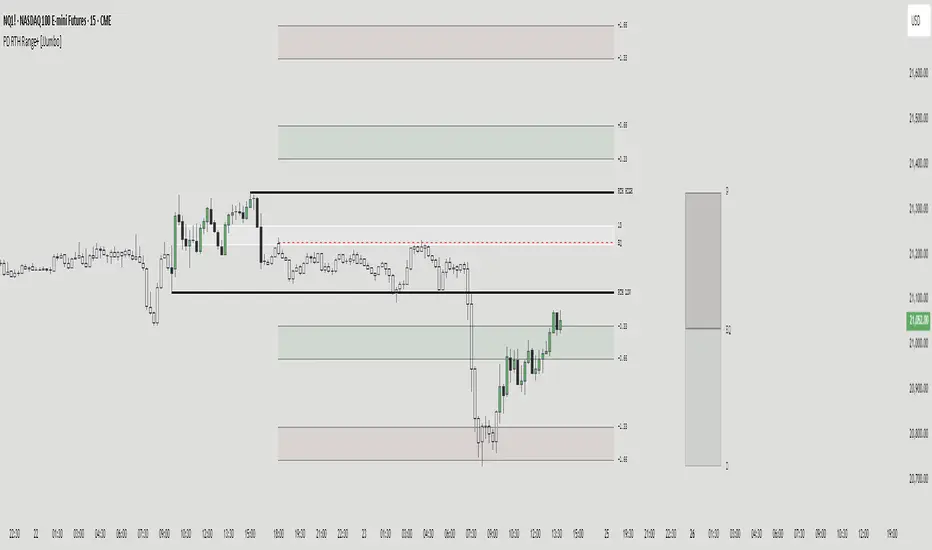
PD RTH Range+ [JJumbo]Introduction:
The PD RTH Range+ indicator is a powerful tool designed to visualize and track previous day and previous day's Regular Trading Hours (RTH) ranges for futures markets. This indicator identifies and plots automatically key price levels established during standard US trading hours (9:30 AM - 4:15 PM ET "RTH") and Globex hours, helping traders identify important key levels and fair value zones.
Just like my other time based range indicator "SDRange+" it works around the same idea but with a different context and different ranges in use, range deviations are still a big part in this framework.
Key features:
Range functions and plot modes:
This tool is equipped with two modes "RTH" range and "Previous day" range, which help you visualize previous day's points of interest and swing high and low essentially helping you framing the current day's daily candle in relation to previous day ranges both RTH and previous day.
Projections feature:
The projection feature in the tool also has two plot modes "Fixed" and "Custom", the Fixed mode projections make use of the rule of thirds (just like the SDRange+) but with two areas 0.33-0.66 and 1.33-1.66, here is where most deviations happen and price exhausts above/below the range.
These are your actionable areas to expect price lose momentum and retrace back into the range.
Dynamic Premium&Discount visualization:
This feature will allow you to identify fair value and equilibrium at current price dynamically updating until out projections or levels have been met and and swing high/low has formed, helping you identify the equilibrium of the market at the current state and where premium or discounted prices are.
Automatic First presentation Fair Value Gap:
A concept idea originated from The Inner Circle Trader (ICT), the feature in the indicator will automatically plot the first presented fair value gap (first FVG present of Regular trading hours) dynamically changing time-frame as well, showing the first presented FVG in any time frame you are visualizing.
This can be used as you area of action as well or targets (during RTH hours).
ETH (Eletronic Trading Hours) candles transparency:
This feature is important for define ETH and RTH hours, removing the color out of the the ETH hours candles helping visualize better the RTH hours, which is where you want base your trading day on.
Customizable inputs:
Fully customizable aesthetics in the input menu
How can traders use this framework and tool effectively in their trading:
Trading range sequences:
This framework is based on IF-THEN statements sequences, it will generate your daily bias by following the sequences.
Sequences: EQ > high/low, high/low > EQ,EQ > fixed projections, fixed projections >EQ.
When following these sequences, you will easily find you daily direction, which are also data-backed by statistics (you can see about it in my X profile, you will find the link in my Trading View profile)
Trading retracements/reversals:
Retracements are often taken from the projections areas until Equilibrium of the dynamic premium and discount feature in the indicator, often participating in the moves to fair value from the deviation of the range.
Reversals are often taken from the projections areas until opposing levels of the range (EQ or high/low)
Terms & Conditions
Our charting tools are products provided for informational and educational purposes only and do not constitute financial, investment, or trading advice. Our charting tools are not designed to predict market movements or provide specific recommendations. Users should be aware that past performance is not indicative of future results and should not be relied upon for making financial decisions. By using our charting tools, the purchaser agrees that the seller and the creator are not responsible for any decisions made based on the information provided by these charting tools. The purchaser assumes full responsibility and liability for any actions taken and the consequences thereof, including any loss of money or investments that may occur as a result of using these products. Hence, by purchasing these charting tools, the customer accepts and acknowledges that the seller and the creator are not liable nor responsible for any unwanted outcome that arises from the development, the sale, or the use of these products. We hold no reimbursement, refund, or chargeback policy. Once these Terms and Conditions are accepted by the Customer, before purchase, no reimbursements, refunds or chargebacks will be provided under any circumstances.
By continuing to use these charting tools, the user acknowledges and agrees to the Terms and Conditions outlined in this legal disclaimer.
Multi Timeframe Fair Value Gap Indicator ProMulti Timeframe Fair Value Gap Indicator Pro | MTF FVG Imbalance Zones | Institutional Supply Demand Levels
🎯 The Most Comprehensive Multi-Timeframe Fair Value Gap (FVG) Indicator on TradingView
Transform Your Trading with Institutional-Grade Multi-Timeframe FVG Analysis
Keywords: Multi Timeframe Indicator, MTF FVG, Fair Value Gap, Imbalance Zones, Supply and Demand, Institutional Trading, Order Flow Imbalance, Price Inefficiency, Smart Money Concepts, ICT Concepts, Volume Imbalance, Liquidity Voids, Multi Timeframe Analysis
📊 WHAT IS THIS INDICATOR?
The Multi Timeframe Fair Value Gap Indicator Pro is the most advanced FVG detection system on TradingView, designed to identify high-probability institutional supply and demand zones across multiple timeframes simultaneously. This professional-grade tool automatically detects Fair Value Gaps (FVGs), also known as imbalance zones, liquidity voids, or inefficiency gaps - the exact areas where institutional traders enter and exit positions.
🔍 What Are Fair Value Gaps (FVGs)?
Fair Value Gaps are three-candle price formations that create imbalances in the market structure. These gaps represent areas where buying or selling was so aggressive that price moved too quickly, leaving behind an inefficient zone that price often returns to "fill" or "mitigate." Professional traders use these zones as high-probability entry points.
Bullish FVG: When the low of candle 3 is higher than the high of candle 1
Bearish FVG: When the high of candle 3 is lower than the low of candle 1
⚡ KEY FEATURES
📈 Multi-Timeframe Analysis (MTF)
- 12 Timeframes Simultaneously: 1m, 3m, 5m, 15m, 30m, 45m, 1H, 2H, 3H, 4H, Daily, Weekly
- Real-Time Detection: Instantly identifies FVGs as they form across all selected timeframes
- Customizable Timeframe Selection: Choose which timeframes to display based on your trading style
- Higher Timeframe Confluence: See when multiple timeframes align for stronger signals
🎨 Three Professional Visual Themes
1. Dark Intergalactic: Futuristic neon colors with high contrast for dark mode traders
2. Light Minimal: Clean, professional appearance for traditional charting
3. Pro Modern: Low-saturation colors for extended screen time comfort
📊 Advanced FVG Dashboard
- Live FVG Counter: Real-time count of active bullish and bearish gaps
- Total Zone Tracking: Monitor all active imbalance zones at a glance
- Theme-Adaptive Display: Dashboard automatically adjusts to your selected visual theme
- Strategic Positioning: Optimally placed to not interfere with price action
🔧 Smart Zone Management
- Dynamic Zone Updates: FVG boxes automatically adjust when price touches them
- Mitigation Detection: Visual feedback when zones are tested or filled
- Color-Coded Status: Instantly see untested vs tested zones
- Extended Projection: Option to extend boxes to the right for future reference
- Timeframe Labels: Optional labels showing which timeframe each FVG originated from
💡 Intelligent Features
- Automatic Zone Cleanup: Removes fully mitigated FVGs to keep charts clean
- Touch-Based Level Adjustment: Zones adapt to partial fills
- Maximum Box Management: Optimized to handle 500 simultaneous FVG zones
- Performance Optimized: Efficient code ensures smooth operation even with multiple timeframes
🎯 TRADING APPLICATIONS
Day Trading & Scalping
- Use 1m, 3m, 5m FVGs for quick scalp entries
- Combine with higher timeframe FVGs for directional bias
- Perfect for futures (ES, NQ, MNQ), forex, and crypto scalping
Swing Trading
- Focus on 1H, 4H, and Daily FVGs for swing positions
- Identify major support/resistance zones
- Plan entries at untested higher timeframe gaps
Position Trading
- Utilize Daily and Weekly FVGs for long-term positions
- Identify institutional accumulation/distribution zones
- Major reversal points at significant imbalance areas
Multi-Timeframe Confluence Trading
- Stack multiple timeframe FVGs for high-probability zones
- Confirm entries when lower and higher timeframe FVGs align
- Professional edge through timeframe confluence
📚 HOW TO USE THIS INDICATOR
Step 1: Add to Your Chart
Click "Add to Favorites" and apply to any trading instrument - works on all markets including stocks, forex, crypto, futures, and indices.
Step 2: Configure Your Timeframes
In settings, select which timeframes you want to monitor. Day traders might focus on 1m-15m, while swing traders might use 1H-Weekly.
Step 3: Choose Your Visual Theme
Select from three professional themes based on your preference and trading environment.
Step 4: Identify Trading Opportunities
For Long Entries:
- Look for Bullish FVGs (green/cyan zones)
- Wait for price to return to untested zones
- Enter when price shows rejection from the FVG zone
- Higher timeframe FVGs provide stronger support
For Short Entries:
- Look for Bearish FVGs (red/pink zones)
- Wait for price to return to untested zones
- Enter when price shows rejection from the FVG zone
- Higher timeframe FVGs provide stronger resistance
Step 5: Manage Risk
- Place stops beyond the FVG zone
- Use partially filled FVGs as trailing stop levels
- Exit when opposite FVGs form (reversal signal)
🏆 WHY THIS IS THE BEST MTF FVG INDICATOR
✅ Most Comprehensive
- More timeframes than any other FVG indicator
- Advanced features not found elsewhere
- Professional-grade visual presentation
✅ Institutional-Grade
- Based on smart money concepts (SMC)
- ICT (Inner Circle Trader) methodology compatible
- Used by professional prop traders
✅ User-Friendly
- Clean, intuitive interface
- Detailed tooltips and descriptions
- Works out-of-the-box with optimal defaults
✅ Continuously Updated
- Regular improvements and optimizations
- Community feedback incorporated
- Professional development by PineProfits
🔥 PERFECT FOR
- Scalpers seeking quick FVG fills
- Day Traders using multi-timeframe analysis
- Swing Traders identifying major zones
- ICT/SMC Traders following smart money
- Prop Firm Traders needing reliable setups
- Algorithmic Traders building systematic strategies
- Technical Analysts studying market structure
- All Experience Levels from beginners to professionals
💎 ADVANCED TIPS
1. Confluence is Key: The strongest signals occur when multiple timeframe FVGs align at the same price level
2. Fresh vs Tested: Untested FVGs (original color) are stronger than tested ones (gray/muted color)
3. Time of Day: FVGs formed during high-volume sessions (London/NY) are more reliable
4. Trend Alignment: Trade FVGs in the direction of the higher timeframe trend for best results
5. Volume Confirmation: Combine with volume indicators for enhanced reliability
📈 INDICATOR SETTINGS
Visual Settings
- Visual Theme: Choose between Dark Intergalactic, Light Minimal, or Pro Modern
- Show Branding: Toggle PineProfits branding on/off
General Settings
- Move box levels with price touch: Dynamically adjust FVG zones
- Change box color with price touch: Visual feedback for tested zones
- Extend boxes to the right: Project zones into the future
- Plot Timeframe Label: Show origin timeframe on each FVG
- Show FVG Dashboard: Toggle the summary dashboard
Timeframe Selection
Select any combination of 12 available timeframes (1m to Weekly)
🚀 GET STARTED NOW
1. Click "Add to Favorites" to save this indicator
2. Apply to your chart - works on any instrument
3. Join thousands of traders already using this professional tool
4. Follow PineProfits for more institutional-grade indicators
⚖️ DISCLAIMER
This indicator is for educational and informational purposes only. It should not be considered financial advice. Always do your own research and practice proper risk management. Past performance does not guarantee future results. Trade responsibly.
© PineProfits - Professional Trading Tools for Modern Markets
If you find this indicator valuable, please leave a like and comment. Your support helps me create more professional-grade tools for the TradingView community!

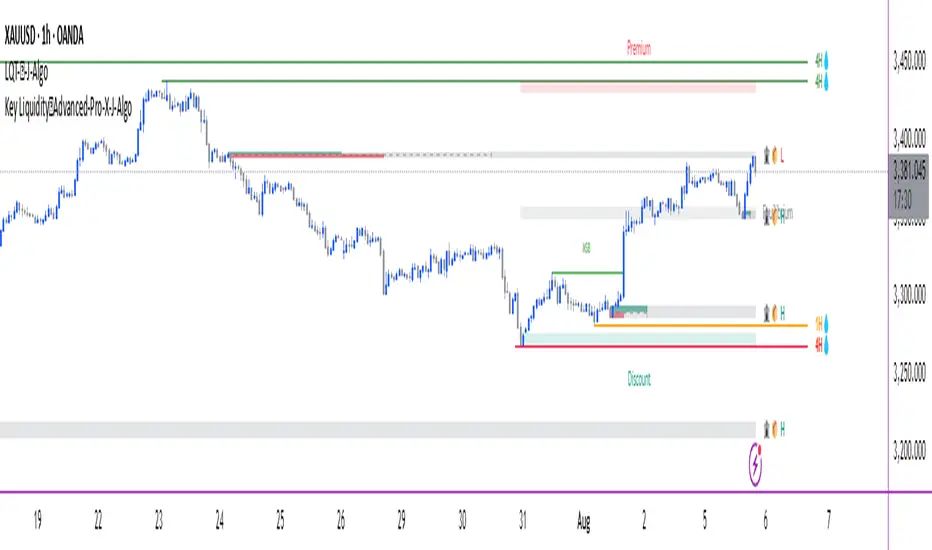
Key Liquidity💧Advanced-Pro-J-Algo# 💧 Key Liquidity Advanced Pro - Multi-Timeframe Institutional Analysis
## 🏆 **Premium Institutional Trading Indicator**
Transform your trading with this comprehensive **multi-timeframe liquidity analysis tool** that combines **Smart Money Concepts (SMC)** and **ICT methodology** into one powerful indicator. Designed for serious traders who demand institutional-grade analysis.
---
## 🔥 **Key Features**
### 💧 **Multi-Timeframe Key Liquidity Levels**
- **HTF (Higher Timeframe)**: Major institutional levels with real-time alerts 🚨
- **LTF (Lower Timeframe)**: Precision entry/exit levels for optimal timing
- **CTF (Current Timeframe)**: Flexible analysis for any chart timeframe
- **Smart Mitigation Detection**: Automatically removes hit liquidity levels
- **Professional Labels**: Clean timeframe identification (4H, 1H, etc.)
### 🏦 **Institutional Order Blocks**
- **📦 Smart Money Order Blocks**: Identify where institutions placed large orders
- **Volume-Weighted Analysis**: Bullish/Bearish strength calculations
- **Professional Labels**: 🏦📦 H (High) and 🏦📦 L (Low) markers
- **Violation Detection**: Automatic cleanup when order blocks are broken
- **Overlap Prevention**: Clean chart presentation without clutter
### 🚨 **Advanced Alert System**
- **HTF Liquidity Hit Alerts**: Never miss major institutional level breaks
- **Detailed Notifications**: Timeframe, price, and timestamp information
- **Smart Frequency Control**: No spam - only meaningful alerts
- **Mobile Ready**: Perfect for Trading View mobile app notifications
### 📊 **Market Structure Analysis**
- **MSB (Market Structure Breaks)**: Current trend direction changes
- **Premium/Discount Zones**: ICT-style institutional price zones
- **Clean Presentation**: Only shows current MSB, removes historical clutter
### 🔄 **Trading Session Analysis**
- **Multi-Session Support**: Asian, London, New York sessions
- **Session Overlaps**: Highlighted with special bar coloring
- **Configurable Display**: Show 0-10 previous days of session data
- **High/Low Tracking**: Session-specific price levels
---
## 🎯 **Perfect For**
### **Trading Styles:**
- ✅ **Forex Trading** (ICT/SMC methodology)
- ✅ **Index Trading** (institutional analysis)
- ✅ **Crypto Trading** (smart money concepts)
- ✅ **Swing Trading** (HTF liquidity levels)
- ✅ **Scalping** (multi-timeframe precision)
### **Methodologies:**
- ✅ **Smart Money Concepts (SMC)**
- ✅ **Inner Circle Trader (ICT)**
- ✅ **Institutional Order Flow**
- ✅ **Liquidity Hunting Strategies**
- ✅ **Market Structure Trading**
---
## ⚙️ **Comprehensive Settings**
### **Master Controls:**
- 💧 Enable/Disable Key Liquidity Levels
- 🏦 Enable/Disable Order Blocks
- 📊 Enable/Disable Market Structure Breaks
- 🎯 Enable/Disable Premium/Discount Zones
- 🔄 Enable/Disable Trading Sessions
### **Customization Options:**
- **Timeframe Selection**: Choose your HTF and LTF periods
- **Color Schemes**: Professional color coding for each timeframe
- **Display Limits**: Control chart clutter with smart limits
- **Text Sizing**: Scalable labels for any screen size
- **Extension Options**: Short, Current, or Max line extensions
### **Alert Configuration:**
- 🚨 HTF High Liquidity Hit Alerts
- 🚨 HTF Low Liquidity Hit Alerts
- Smart frequency control to prevent spam
---
## 🎨 **Visual Excellence**
### **Professional Design:**
- **Clean Interface**: No chart clutter, only relevant information
- **Consistent Labeling**: All elements perfectly aligned and positioned
- **Smart Color Coding**: Visual hierarchy based on timeframe importance
- **Emoji Integration**: Instant visual recognition (💧🏦📦📊)
### **Label System:**
- **Liquidity Levels**: Timeframe labels (4H, 1H, etc.) with tooltips
- **Order Blocks**: 🏦📦 H/L institutional liquidity markers
- **Market Structure**: MSB break notifications
- **Sessions**: Clear session identification and overlaps
---
## 🔬 **Technical Implementation**
### **Performance Optimized:**
- Efficient memory management with `max_bars_back()` settings
- Smart array handling to prevent performance issues
- Clean object deletion to maintain chart responsiveness
### **Advanced Logic:**
- **Pivot Detection**: Sophisticated swing high/low identification
- **Mitigation Algorithms**: Smart detection of liquidity level hits
- **Volume Analysis**: Institutional strength calculations
- **Multi-Timeframe Security**: Proper HTL/LTF data handling
---
## 📈 **How to Use**
### **Setup:**
1. Add indicator to your chart
2. Configure your preferred HTF (default: 4H) and LTF (default: 1H)
3. Enable desired features via Master Controls
4. Set up TradingView alerts for HTF liquidity hits
### **Trading Workflow:**
1. **Identify Bias**: Use HTF liquidity levels for market direction
2. **Find Entries**: Use LTF levels and Order Blocks for precision entries
3. **Confirm Structure**: Check MSB for trend continuation/reversal
4. **Time Entries**: Use session analysis for optimal timing
5. **Get Alerted**: Never miss major HTF liquidity hits
---
## 🏅 **Why Choose This Indicator?**
### **Professional Grade:**
- Combines multiple premium concepts into one comprehensive tool
- Institutional-quality analysis typically found in expensive platforms
- Clean, professional presentation suitable for serious trading
### **Complete Solution:**
- No need for multiple indicators - everything in one package
- Covers all aspects of modern institutional trading methodology
- Suitable for beginners learning SMC/ICT and professionals alike
### **Constantly Updated:**
- Built with modern Pine Script v6
- Performance optimized for all timeframes
- Clean code structure for reliability
---
## 🚨 **Important Notes**
- **Timeframe Compatibility**: Works on all intraday timeframes (not suitable for daily/weekly/monthly)
- **Best Performance**: Recommended for 1m-4H chart timeframes
- **Alert Setup**: Configure TradingView alerts for mobile notifications
- **Education**: Best used with understanding of SMC/ICT concepts
---
## 📞 **Support & Updates**
This indicator represents months of development and testing, combining the best of institutional trading analysis into one comprehensive tool. Perfect for traders who demand professional-grade analysis and real-time alerting.
**🎯 Take your trading to the institutional level with Key Liquidity Advanced Pro!**
---
*Disclaimer: This indicator is for educational and informational purposes. Past performance does not guarantee future results. Always practice proper risk management.*
Mig Trade Model - Kill Zones
Key features:
Liquidity Hunt Detection: Spots aggressive moves that "hunt" stops beyond recent swing highs/lows.
Consolidation Filter: Requires 1-3 small-range candles after a hunt before confirming with a strong candle.
Bias Application: Uses daily open/close to auto-detect bias or allows manual override.
Kill Zone Restriction: Limits signals to London (default: 7-10 AM UTC) and NY (default: 12-3 PM UTC) sessions for better relevance in active markets.
This strategy is inspired by smart money concepts (SMC) and ICT (Inner Circle Trader) methodologies, aiming to capture venom-like "stings" in price action where liquidity is grabbed before reversals.
How It Works
ATR Calculation: Uses a user-defined ATR length (default: 14) to measure volatility, which scales candle body and range thresholds.
Bias Determination:
Auto: Compares daily close to open (bullish if close > open).
Manual: User selects "Bullish" or "Bearish."
Strong Candles:
Bullish: Green candle with body > 2x ATR (configurable).
Bearish: Red candle with body > 2x ATR.
Small Range Candles:
Candles where high-low < 0.5x ATR (configurable).
Liquidity Hunt:
Bullish Hunt: Strong bearish candle making a new low below the past swing low (default: 10 bars).
Bearish Hunt: Strong bullish candle making a new high above the past swing high.
Signal Generation:
After a hunt, counts 1-3 small-range candles.
Confirms with a strong candle in the opposite direction (e.g., strong bullish after bearish hunt).
Resets if >3 small candles or an opposing strong candle appears.
Kill Zone Filter:
Checks if the current bar's time (in UTC) falls within London or NY Kill Zones.
Only allows final "Buy" (bullish entry) or "Sell" (bearish entry) if bias matches and in Kill Zone.
Plots:
Yellow circle (below): Bullish liquidity hunt.
Orange circle (above): Bearish liquidity hunt.
Blue diamond (below): Raw bullish signal.
Purple diamond (above): Raw bearish signal.
Green triangle up ("Buy"): Filtered bullish entry.
Red triangle down ("Sell"): Filtered bearish entry.
Inputs
Bias: "Auto" (default), "Bullish", or "Bearish" – Controls signal direction based on daily trend.
ATR Length: 14 (default) – Period for ATR calculation.
Swing Length for Liquidity Hunt: 10 (default) – Bars to look back for swing highs/lows.
Strong Candle Body Multiplier (x ATR): 2.0 (default) – Threshold for strong candle bodies.
Small Range Multiplier (x ATR): 0.5 (default) – Threshold for small-range candles.
London Kill Zone Start/End Hour (UTC): 7/10 (default) – Customize London session hours.
NY Kill Zone Start/End Hour (UTC): 12/15 (default) – Customize New York session hours.
Usage Tips
Timeframe: Best on lower timeframes (e.g., 5-15 min) for intraday trading, especially forex pairs like EURUSD or GBPUSD.
Timezone Adjustment: Inputs are in UTC. If your chart is in a different timezone (e.g., EST = UTC-5), adjust hours accordingly (e.g., London: 2-5 AM EST → 7-10 UTC).
Risk Management: Use with stop-loss (e.g., beyond the hunt low/high) and take-profit based on ATR multiples. Not financial advice—backtest thoroughly.
Customization: Tweak multipliers for different assets; higher for volatile cryptos, lower for stocks.
Limitations: Relies on historical data; may generate false signals in ranging markets. Combine with other indicators like volume or support/resistance.
This indicator is for educational purposes. Always use discretion and proper risk management in live trading. If you find it useful, feel free to share feedback or suggestions!

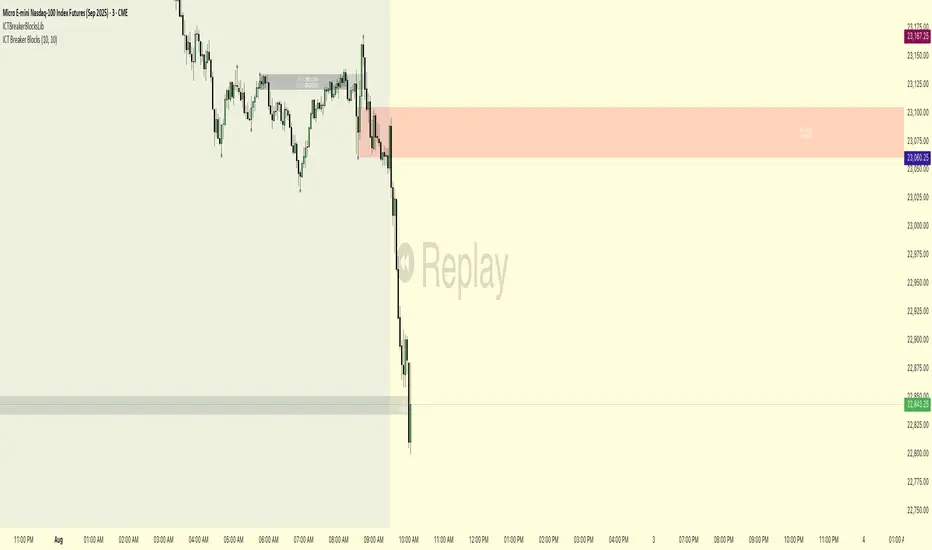
ICT Breaker BlocksICT Breaker Block Detector
This indicator automatically identifies and displays high-probability ICT (Inner Circle Trader) Breaker Blocks on your chart. It is designed to help traders spot key shifts in market structure where price is likely to react.
What It Does
The indicator's primary function is to find and draw both Bullish and Bearish Breaker Blocks. These are specific price action patterns that signal a potential reversal after a liquidity sweep.
Bullish Breaker Block (Green): Forms after a low is swept (creating a lower low) and the market structure shifts by breaking above the intermediate swing high. This broken swing high becomes the Bullish Breaker.
Bearish Breaker Block (Red): Forms after a high is swept (creating a higher high) and the market structure shifts by breaking below the intermediate swing low. This broken swing low becomes the Bearish Breaker.
Invalidation: The indicator also tracks these zones in real-time. If price trades completely through a breaker block, the zone is considered invalidated. It will stop extending, its color will change to gray, and an exclamation mark ! will be added to its label.
How It Functions
The script's logic is designed to precisely identify the ICT breaker pattern:
Liquidity Sweep: It first identifies a sequence where a recent swing high is taken out by a higher high (for a bearish setup) or a swing low is taken out by a lower low (for a bullish setup).
Market Structure Shift (MSS): After the sweep, it waits for a clear break in market structure. This occurs when price closes below the intermediate swing low (for a bearish breaker) or above the intermediate swing high (for a bullish breaker).
Drawing the Zone: Once the MSS is confirmed, the indicator draws a box around the range of the swing point that was broken. This box is the Breaker Block, which is then extended into the future to serve as a potential area of interest.
How to Use This Indicator
Settings
Pivot Lookback: This setting determines the sensitivity of the swing point detection. A higher number will identify larger, more significant market structure and result in fewer, but potentially stronger, breaker blocks. A lower number will identify smaller, more immediate patterns.
Color & Display Options: You can customize the colors for the bullish, bearish, and invalidated zones, as well as toggle the visibility of each type of breaker.
Trading Application
Traders can use these automatically drawn zones as high-probability Points of Interest (POI). The common application is to wait for price to return to the breaker block after it has formed. This retest can offer a potential entry opportunity in the direction of the market structure shift.
For a Bullish Breaker, a trader might look for a long entry when the price dips back into the green zone.
For a Bearish Breaker, a trader might look for a short entry when the price rallies back up into the red zone.
Disclaimer: This indicator is a tool to assist in technical analysis. It is not a standalone trading system and does not provide financial advice. Always use proper risk management and combine this tool with your own analysis and trading strategy.
Prophet Model [TakingProphets]Indicator Description
The Prophet Model is a structured, logic-driven indicator designed specifically for traders familiar with ICT (Inner Circle Trader) methodologies. Built to streamline the analytical workflow, this tool integrates multiple Smart Money Concepts into a clear and actionable trading framework, simplifying the identification of high-probability setups without chart clutter.
What Does This Indicator Do?
The Prophet Model guides traders by dynamically identifying and visually aligning key components of ICT methodology:
Higher Time Frame (HTF) PD Array Identification:
Automatically locates and maps critical Fair Value Gaps (FVGs) from higher timeframes onto your lower timeframe charts, clearly highlighting institutional areas of interest.
Candle Range Theory (CRT) Validation:
Monitors higher timeframe candles to detect shifts in market delivery, confirming directional bias according to ICT Candle Range Theory.
Liquidity Sweep Detection:
Precisely identifies buy-side and sell-side liquidity sweeps within marked HTF zones, clearly highlighting areas where price is likely to reverse or continue.
Change in State of Delivery (CISD):
Pinpoints the exact moment when market structure shifts via significant displacement, providing a clear reference point for trade entries.
Overlapping Fair Value Gap (FVG) Refinement:
Enhances entry precision by automatically adjusting entry points (EPE) when internal gaps overlap the CISD candle.
Risk Management Levels:
Dynamically calculates and plots your Stop Loss (SL), Break-Even (BE), and Take Profit (TP) levels based on actual structural movements (2.25x CISD range for TP, recent highs/lows for SL).
Real-Time Setup Checklist:
Provides a dynamic visual checklist confirming when all entry criteria (HTF PDA, CRT, Liquidity Sweep, CISD) are met.
Optimal Entry Tracking:
Marks refined entry points after CISD confirmation, automatically adjusting when internal imbalances (FVGs) are detected, ensuring accurate and efficient entries.
Chart Info Box:
Optionally displays complete symbol, timeframe, and indicator name for transparent chart annotations and efficient trade journaling.
How Does It Work?
Identify HTF Institutional Interest:
The indicator scans higher timeframes for unmitigated FVGs, displaying these critical zones automatically on your trading timeframe.
Confirm Market Delivery Shift (CRT):
Confirms directional conviction by comparing the range and behavior of recent higher timeframe candles.
Detect Liquidity Sweeps:
Clearly marks liquidity levels that have been swept, signaling potential price reversals or continuations.
Spot Displacement & Structure Shifts (CISD):
Highlights decisive movements indicating a significant change in market direction, crucial for entry timing.
Precision Entry Adjustments (EPE):
Refines entry positions by identifying overlapping FVGs within the displacement candle structure.
Manage Risk Clearly:
Calculates realistic SL, BE, and TP levels based on structural price action, removing guesswork and improving consistency.
Why Is It Worth Paying For?
Simplified Confluence-Building:
Removes ambiguity by automatically aligning multiple ICT criteria into a single, easy-to-follow visual workflow.
Precision & Efficiency:
Improves execution timing by dynamically updating entry and risk management levels based on actual market structure rather than arbitrary measures.
Real-Time Adaptation:
Continuously updates as market conditions evolve, providing confidence and clarity in dynamic trading environments.
Focused Trading Decisions:
Keeps traders disciplined by visually confirming setups step-by-step, aligning trades only with strong institutional-backed movements.
Important Considerations
This indicator is intended for traders with foundational knowledge of ICT methodologies.
It is not a standalone buy/sell signal provider; it must be combined with proper risk management and market narrative analysis.
Always use discretion and confirm the context of each trade within your overall trading strategy.
By providing traders with actionable insights and clear visual confirmations aligned strictly with professional ICT concepts, the Prophet Model significantly enhances trading decisions and execution precision.

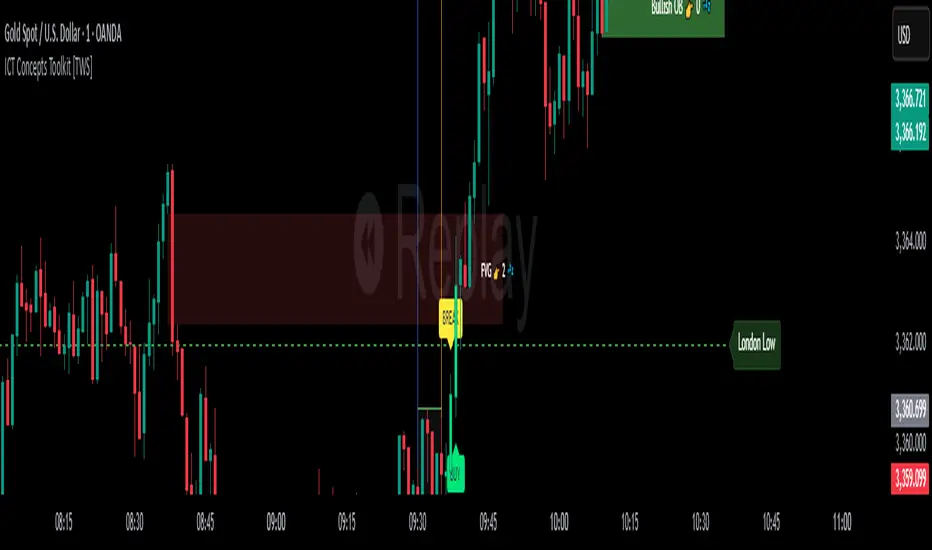
ICT Concepts Toolkit [TWS]
ICT Concepts Toolkit – by Trade With Stevie
Unlock the full power of Inner Circle Trader (ICT) concepts with this all-in-one indicator built for serious traders.
The ICT Concepts Toolkit combines the most powerful price action tools into one clean, efficient, and highly customizable interface — perfect for mastering market structure and timing precision entries.
✅ Features Included:
🟩 Order Blocks – Automatically detect key institutional levels for potential reversals and entries.
📉 Fair Value Gaps (FVGs) – Visualize imbalances in price action to spot high-probability targets and mitigation zones.
📊 Support & Resistance – Dynamically plotted levels to track market structure and trend shifts in real-time.
📅 Previous Daily Highs/Lows – Key liquidity zones marked for precision scalping and swing setups.
🕒 Session Zones – Clearly defined Asian, London, and New York sessions with customizable times and colors.
📌 Extension Lines – Extends each session’s high and low to the current candle for ongoing bias and liquidity mapping.
🚦ICT Morning Signal – Your personal directional bias assistant: smart signals showing when to Buy or Sell based on ICT’s powerful Morning Model logic.
Whether you're trading Forex, Futures, or Crypto — this toolkit gives you a cleaner chart, clearer bias, and more confidence in your setups.
💡 Created by Trade With Stevie — follow for more smart tools and signal insights.
Multi-Timeframe SMTSummery
The Multi-Timeframe SMT indicator is designed to identify and visualize Higher Timeframe (HTF) data on a Lower Timeframe (LTF) chart, allowing traders to see the broader market context without changing their current chart's resolution. It accurately draws pivots and SMT divergences from higher timeframes on the corresponding candles of your current lower timeframe chart.
Its core features include:
Multi-Timeframe Analysis: Configure and monitor pivots on up to four independent timeframes, from intraday to monthly.
Customizable Pivot Detection: Define the strength of pivots by adjusting the number of bars to the left and right.
SMT Divergence: Automatically identifies bullish and bearish SMT divergences by comparing the price action of the main chart symbol with a chosen correlated asset.
Early SMT Detection: A unique feature that monitors a lower "detection timeframe" to provide early warnings of potential SMT setups before they're confirmed on the main timeframe. Note that this early detection is only shown on timeframes equal to or lower than the "Detection timeframe" you have set.
Visual Cues & Alerts: Clear on-chart labels, lines, and fully customizable alerts notify you of confirmed pivots and SMT divergences, ensuring you don't miss key opportunities.
Important Nuance Regarding Pivot Label Display
Due to a self-imposed limit within this script's drawing management logic, the indicator might quickly reach its drawing capacity if you enable pivot crosses for multiple timeframes simultaneously. When this internal drawing limit is exceeded, the script is designed to automatically remove the oldest drawings to make space for new ones.
Therefore, to ensure optimal performance and visibility of the most recent and relevant pivots, it's highly recommended to only enable the "Show Pivot Crosses" option for one timeframe at a time. If you wish to view pivots for a different timeframe, simply disable the pivot crosses for the currently active timeframe and then enable them for your desired one. This approach prevents the rapid cycling and disappearance of pivot labels, providing a clearer and more stable visual experience.
In-Depth Explanation of the Logic
This script is built on two primary concepts: pivot points and Smart Money Technique (SMT) divergence. It systematically collects historical data on multiple timeframes, identifies pivots, and then compares them between two assets to find divergences.
Pivot Point Identification
A pivot is a turning point in the market. A pivot high is a candle that has a higher high than the candles to its immediate left and right. Conversely, a pivot low is a candle with a lower low than its neighbors.
How it Works in the Script:
The script tracks the highest high and lowest low for each period of the selected timeframe (e.g., for each 4-hour candle). When a new high-timeframe candle closes, it stores that high/low value and its bar index in an array. The checkForPivot() function then checks if a recently stored high or low qualifies as a pivot.
Key Inputs:
Left Strength (leftBars1): The number of candles to the left that must have a lower high (for a pivot high) or higher low (for a pivot low).
Right Strength (rightBars1): The number of candles to the right that must meet the same criteria.
For example, with Left Strength and Right Strength both set to 3, a pivot high is only confirmed when its high is greater than the highs of the 3 previous high-timeframe candles and the 3 subsequent high-timeframe candles. Increasing these values will identify more significant, longer-term pivots.
Smart Money Technique (SMT) Divergence
SMT Divergence is a concept popularized by The Inner Circle Trader (ICT). It occurs when two closely correlated assets fail to move in sync. For instance, if Asset A makes a higher high but Asset B fails to do so and instead makes a lower high, this creates a bearish SMT divergence. It suggests that the "smart money" may not be supporting the move in Asset A, signaling a potential reversal.
Bearish SMT: Main asset makes a higher high, while the correlated asset makes a lower high. This is a potential sell signal.
Bullish SMT: Main asset makes a lower low, while the correlated asset makes a higher low. This is a potential buy signal.
How it Works in the Script:
Data Request: For each timeframe, the script uses the request.security() function to fetch the high and low data for both the main chart symbol (syminfo.tickerid) and the chosen Comparison Asset.
Pivot Comparison: When a new pivot is confirmed on the main asset, the script checks if a corresponding pivot also formed on the comparison asset at the same time.
Divergence Check: It then compares the direction of the pivots. For a bearish SMT, it checks if the main asset's new pivot high is higher than its previous pivot high, while the comparison asset's new pivot high is lower than its previous one. The logic is reversed for bullish SMT.
Visualization: If a divergence is found, the script draws a red (bearish) or green (bullish) line connecting the two pivots on your chart and places an "SMT" label.
Early SMT Detection
This is a proactive feature designed to give you a heads-up. Waiting for a 4-hour or daily pivot to form can take a long time. The early detection system looks for SMT divergences on a much smaller, user-defined Detection timeframe (e.g., 15-minute).
How it Works in the Script:
Awaiting Setup: After a primary pivot (Pivot A) is formed on the main timeframe (e.g., a Daily pivot high), the script begins monitoring.
Intraday Monitoring: It then watches the Detection timeframe (e.g., 15-minute) for smaller intraday pivots.
Potential Divergence: It looks for an intraday pivot that forms a divergence against the primary Pivot A.
Watchline & Alert: When this "potential" divergence occurs, the script draws a dashed white line and triggers a "Potential SMT" alert. This isn't a confirmed SMT on the main timeframe yet, but it's a powerful early warning that one may be forming.
Drawing & Object Management
To keep the chart clean and prevent performance issues, the script manages its drawings (lines and labels) efficiently. It stores them in arrays and uses a drawing limit to automatically delete the oldest drawings as new ones are created, ensuring your TradingView remains responsive.
How to Use the Indicator
Configuration
Enable Timeframes: Use the checkboxes (Enable Timeframe 1, Enable Timeframe 2, etc.) to activate the timeframes you want to monitor. It's often best to start with one or two to keep the chart clean.
Select Timeframes: Choose the higher timeframes you want to analyze (e.g., 240 for 4-hour, D for Daily, W for Weekly).
Set Pivot Strength: The default of 3 for Left/Right strength is a good starting point. Increase it to find more significant market structure points or decrease it for more frequent, shorter-term pivots.
Configure SMT:
Check Enable SMT for the timeframes where you want to detect divergence.
Enter a Comparison Asset . This is crucial. Ensure the assets are correlated.
To use the early warning system, check Enable early SMT detection and select an appropriate Detection timeframe (e.g., 15 or 60 minutes for a Daily analysis).

ICT & Zeussy Macro - Vertical Lines at Specific Times 1.0# ICT & Zeussy Macro - Vertical Lines at Specific Times 1.0
## Description
The **ICT & Zeussy Macro - Vertical Lines at Specific Times 1.0** is a Pine Script indicator designed for TradingView to plot vertical lines at user-defined times within each hour, making it a valuable tool for traders following ICT (Inner Circle Trader) and Zeussy macro strategies. The indicator allows users to mark specific times during the trading day with customizable vertical lines, helping to highlight key market moments such as macro times for analysis or trade planning.
## Key Features
- **Customizable Time Selection**: Choose specific hours (00:00 to 23:00) to display vertical lines using checkboxes in the settings.
- **Flexible Minute Inputs**: Define exact minutes for green and orange lines using comma-separated values (e.g., "45,15" for green lines at :45 and :15, or "50,0,10" for orange lines at :50, :00, :10).
- **Color and Style Customization**: Select colors for green and orange lines, as well as the line style (Solid, Dashed, or Dotted) to suit your chart preferences.
- **Historical and Future Plotting**: Configure the number of past and future days to display lines, allowing for analysis of historical patterns or planning for upcoming sessions.
- **Line Limit Management**: The indicator supports up to 500 lines to comply with TradingView's limits, with a warning label displayed if the maximum is reached.
## How It Works
The indicator plots vertical lines at specified minutes within selected hours for each chosen day:
- **Green Lines**: Drawn at user-defined minutes (default: :45 and :15 past the hour).
- **Orange Lines**: Drawn at user-defined minutes (default: :50, :00, and :10 past the hour).
- Users can enable or disable specific hours via checkboxes, and the lines are plotted for the specified number of past and future days.
- The indicator uses the chart's timezone to ensure accurate placement of lines relative to the market's session times.
## Usage
1. **Add to Chart**: Apply the indicator to your TradingView chart.
2. **Configure Settings**:
- In the "Hour Selection" group, check the boxes for the hours you want to display lines (e.g., 08:00 to 23:00 are enabled by default).
- In the "Green Minutes" and "Orange Minutes" fields, enter comma-separated minute values (e.g., "45,15" for green, "50,0,10" for orange).
- Adjust the "Days in Past" and "Days in Future" to control how many days the lines will cover.
- Customize the "Green Color", "Orange Color", and "Line Style" to match your chart aesthetics.
3. **Monitor Limits**: If you see a "Line limit reached (500 max)" warning, reduce the number of selected hours or days to stay within TradingView's line limit.
## Ideal For
- Traders using ICT or Zeussy macro strategies to identify key times for market analysis.
- Users who need to mark recurring time-based events on their charts.
- Technical analysts looking to visualize specific time intervals across multiple days.
## Notes
- Ensure that the number of selected hours and days does not exceed TradingView's 500-line limit to avoid missing lines.
- The indicator respects the chart's timezone, so verify that your chart's timezone aligns with your trading session.
- For optimal performance, limit the number of past and future days when using multiple hours to avoid hitting the line limit.
This indicator is perfect for traders who rely on precise timing for their strategies, offering a clean and customizable way to visualize critical market moments.

Checklist Dashboard Table# Checklist Dashboard Table – ICT/SMC Trading Helper
Overview
The “Checklist Dashboard Table” is a TradingView indicator designed to help traders structure, organize, and validate their market analyses following the ICT/SMC (Inner Circle Trader / Smart Money Concepts) methodology. It provides a visual and interactive checklist directly on your chart, ensuring you never miss a crucial step in your decision-making process.
Key Features
- Visual Checklist : All your trading criteria are displayed as color-coded checkboxes (green for validated, red for not validated), making your analysis process both clear and efficient.
- Clear Separation Between Analysis and Confirmations :
- Analysis : Reminders for your routine, such as timeframe selection (M3 to H4), trend analysis via RSI, and identification of key zones (Midnight Open, SSL/BSL, Asian High/Low).
- Confirmations : Six customizable criteria to check off as you validate your setup (clear trend, OB + FVG, OTE zone, Premium/Discount, R/R > 1:2, CBDR/Midnight).
- Personal Notes Section : Keep your trade entries, observations, or comments in a dedicated field in the indicator’s settings. Your notes are displayed right in the checklist for quick reference and journaling.
- Elegant and Compact Display : The table is styled for readability and can be positioned anywhere on your chart.
- Quick Customization : Instantly update any criterion or your personal notes via the script settings.
How to Use
1. Add the indicator to your chart.
2. Review the “Analysis” section as your pre-trade routine reminder.
3. Check off the “Confirmations” criteria as you validate your entry strategy.
4. Write your trade notes or comments in the provided notes section.
5. Use the checklist to reinforce discipline and repeatability in your trading.
Why Use This Checklist?
- Prevents you from skipping important steps in your analysis.
- Reinforces trading discipline and consistency.
- Allows you to document and review your trade decisions for ongoing improvement.
Who Is It For?
Perfect for ICT/SMC traders, but also valuable for anyone looking to organize and systematize their trading process.
Happy trading!

Noon Curve Box with Quadrants & 1st FVGOverview 📜
The Noon Curve Box with Quadrants & 1st FVG is a comprehensive analysis tool built for intraday traders. It automates the process of identifying and visualizing key time-based concepts popularized by ICT (Inner Circle Trader) and other price action methodologies.
While the concepts themselves are public, this script's value lies in its unique automation and clear presentation. It saves you the manual effort of marking session ranges, quadrants, and searching for critical imbalances every single day, allowing you to focus purely on execution.
Underlying Concepts Explained 🧠
This script is built on a few core price action principles:
Time-Based Profiling: The idea that different times of the trading day have different characteristics. The script visually separates the main session into 2-hour quadrants to help you track momentum shifts.
Fair Value Gaps (FVG): An FVG is a three-bar pattern that indicates a price imbalance or inefficiency. It's a foundational concept in many institutional trading methods.
A Bullish FVG (or BISI) forms when there is a gap between the first candle's high and the third candle's low:
Candle 1 HighCandle 3 High
"Silver Bullet" Time Windows: This indicator specifically targets the first FVG formed during the high-impact AM session (9:30-10:00 NY Time) and a corresponding PM session (13:30-14:00 NY Time), as these are often considered high-probability reversal or continuation zones.
Key Features & How It Works ✨
Automated Session Box: The script automatically draws a box around the high and low of your specified trading session (default is 8:00 AM - 4:00 PM New York time). This provides an instant view of the day's operating range.
Dynamic Quadrant Analysis: The session is automatically divided into 2-hour quadrants. Each box is colored based on its internal momentum (close vs. open), providing an at-a-glance summary of buying or selling pressure throughout the day.
Precision FVG Detection:
The script's core logic scans for the very first FVG within the AM (9:30-10:00) and PM (13:30-14:00) windows.
It identifies the exact 3-bar pattern and immediately draws a box marking the imbalance zone. Once the first FVG is found for a window, the script stops searching, ensuring your chart remains clean and focused on the most significant, initial imbalance.
The FVG boxes extend to the current bar, keeping these key levels of interest visible all day.
How to Use This Indicator 🎯
Context: Use the Session Box high and low as your primary intraday support and resistance levels.
Momentum: Use the Quadrant Box colors to gauge the flow of the market. A switch from red to green, for example, can signal a potential shift in control.
High-Probability Setups: The AM and PM First FVG boxes are your key points of interest. These imbalances often act as price magnets. Look for price to return to these zones to find potential entries, as they may act as support (bullish FVG) or resistance (bearish FVG).
Settings and Customization ⚙️
You have full control over all visual elements.
Session Control: Adjust the session time and timezone.
Visual Toggles: Enable or disable the Session Box, Quadrants, and AM/PM FVGs.
Color Customization: Match all elements to your personal chart theme.
History: Limit the number of historical FVG boxes displayed to keep your chart clean.

ICT Sensitive Key Levels [Mariinus]Indicator Overview – Inspired by ICT Concepts
This indicator is inspired by the teachings of Inner Circle Trader (ICT), whose philosophies and principles have greatly shaped the way I view price action. One of the most powerful lessons that stuck with me is his quote:
"All you need is OHLC."
Another fundamental concept that underpins this tool is the idea that:
"Price is constantly moving in cycles from Premium or Discount to Equilibrium, from Equilibrium to Discount to Premium."
With these core ideas in mind, this indicator was developed to help traders who are already using an ICT-based framework. In addition to plotting the standard OHLC levels, the ICT Sensitive Key Levels indicator also includes derived levels that provide deeper Market insight. These include the Equilibrium of the full candle range (High to Low) as well as the Equilibrium of the wicks – offering a more nuanced view of price balance and potential turning points, in line with ICT’s core concepts.
⚠️ Important Disclaimer:
This is not a standalone trading plan.
This is not a buy or sell signal generator.
Instead, this tool is designed to support traders who follow ICT principles by helping them identify higher-probability PD Arrays – the key zones where setups are more likely to occur. If your trading plan includes looking for specific PD Arrays and structural frameworks taught by ICT, then this indicator is a visual aid to refine and focus your attention on the areas where your framework has a higher probability of playing out.
🔁 Backtesting & Daily Preparation
In addition to improving your real-time analysis, this indicator is also a valuable tool for accelerated backtesting . Rather than manually drawing out levels, the indicator automatically provides them, allowing you to analyze past price action faster and more efficiently .
It’s also ideal for preparing your trading day . By loading the indicator before the session starts, you get a clear visual of key levels that may play a role in your strategy. And if you find the chart too cluttered with lines, simply copy the ones that matter to you, draw them manually, and then turn the indicator off to keep your chart clean while keeping your zones intact.
⚙️ Explanation of the Settings
You can combine up to 4 timeframes to monitor their respective levels while operating on a lower timeframe. For each timeframe, you can:
• Set a lookback period to control how far back you want to calculate levels.
• Choose to display or hide the levels of the current candle , which helps you monitor intra-candle ebbs and flows.
Each level (e.g., High, Low, Open, Close, Equilibrium) can be customized:
• Color
• Line style
• Line width
• To hide a level , simply set its opacity to zero.
You can also enable dividers to clearly mark the start and end of higher timeframe candles on your lower timeframe chart. These dividers are also fully customizable:
• Color
• Style
• Width
• And again, if you prefer a cleaner chart, you can set the opacity to zero to hide them completely.
This setup gives you full control over how much or how little visual data you want to see, aligning the tool with your personal trading workflow.
💡 Example Use Cases
These examples are for educational purposes only. This tool is not financial advice and should always be used in conjunction with your own trading plan—whether it involves Fair Value Gaps, Order Blocks, or a custom combination of ICT-based elements.
• Example 1: A 1H Bearish Fair Value Gap overlapping with the Equilibrium Key Level of the Previous Day's Range – a high-probability zone for reaction.
• Example 2: A 1H Bullish Fair Value Gap in Discount, overlapping with the Equilibrium of Two Days Ago, followed by a move into a 1H Bearish Order Block that coincides with the Previous Day’s Equilibrium.
• Example 3: The same 1H PD Arrays viewed from a 4H chart, alongside Weekly Price Levels – giving you a higher timeframe context that supports or invalidates lower timeframe setups.
• Example 4: A combination of two timeframes for added context. A 4H Bullish Fair Value Gap is nested inside the current Weekly Equilibrium Key Level . On the 15M chart , we observe a reaction that creates an Inversion Fair Value Gap , which aligns with the Equilibrium Key Level of the previous 4H candle .
This indicator doesn’t replace your trading plan—it enhances your ability to execute it. It’s a precision tool made for ICT traders who understand context, structure, and probability.

IME's Community First Presented FVGsIME's Community First Presented FVGs v1.5 - Advanced Implementation
ORIGINALITY & INNOVATION
This indicator advances beyond basic Fair Value Gap detection by implementing a sophisticated 24-hour FVG lifecycle management system aligned with institutional trading patterns. While many FVG indicators simply detect gaps and extend them indefinitely, this implementation introduces temporal intelligence that mirrors how institutional algorithms actually manage these inefficiencies.
Key Innovations that set this apart:
- 24-Hour Lifecycle Management: FVGs extend dynamically until 16:59, then freeze until removal at 17:00 next day
- Institutional Day Alignment: Recognizes 18:00-16:59 trading cycles vs standard calendar days
- Multi-Session Detection: Simultaneous monitoring of Midnight, London, NY AM, and NY PM sessions
- Advanced Classification System: A.FVG detection with volume imbalance analysis vs classic FVG patterns
- Volatility Settlement Logic: Blocks contamination from opening mechanics (3:01+, 0:01+, 13:31+ rules)
- Visual Enhancement System: C.E. lines, contamination warnings, dark mode support with proper transparency handling
BASED ON ICT CONCEPTS
This indicator implements First Presented Fair Value Gap methodology taught by ICT (Inner Circle Trader). The original F.P. FVG concepts, timing rules, and session-based detection are credited to ICT's educational material. This implementation extends those foundational concepts with advanced lifecycle management and institutional alignment features.
ICT's Core F.P. FVG Rules Implemented:
- First clean FVG after session opening (avoids opening contamination)
- 3-candle pattern requirement for valid detection
- Session-specific timing windows and volatility settlement
- Consequent Encroachment level identification
IME's Advanced Enhancements:
- Automated lifecycle management with institutional day recognition
- Multi-session simultaneous monitoring with proper isolation
- Advanced visual system with transparency states for aged FVGs
- A.FVG classification with volume imbalance detection algorithms
HOW IT WORKS
Core Detection Engine
The indicator monitors four key institutional sessions using precise timing windows:
- Midnight Session: 00:01-00:30 (blocks 00:00 contamination)
- London Session: 03:01-03:30 (blocks 03:00 contamination)
- NY AM Session: 09:30-10:00 (configurable 9:30 detection)
- NY PM Session: 13:31-14:00 (blocks 13:30 contamination)
During each session window, the algorithm scans for the first valid FVG pattern using ICT's 3-candle rule while applying volatility settlement principles to avoid false signals from opening mechanics.
Advanced Classification System
Classic FVG Detection:
Standard 3-candle wick-to-wick gap where candle 1 and 3 don't overlap, creating an inefficiency that institutions must eventually fill.
A.FVG (Advanced FVG) Detection:
Enhanced pattern recognition that includes volume imbalance analysis (deadpool detection) to identify more significant institutional inefficiencies. A.FVGs incorporate both the basic gap plus additional price imbalances between candle bodies, creating larger, more significant levels.
24-Hour Lifecycle Management
Phase 1 - Dynamic Extension (Creation Day):
From detection until 16:59 of creation day, FVGs extend in real-time as new bars form, maintaining their relevance as potential support/resistance levels.
Phase 2 - Freeze Period (Next Day):
At 16:59, FVGs stop extending and "freeze" at their final size, remaining visible as reference levels but no longer growing. This prevents outdated levels from contaminating fresh analysis.
Phase 3 - Cleanup (17:00 Next Day):
Exactly 24+ hours after creation, FVGs are automatically removed to maintain chart clarity. This timing aligns with institutional trading cycle completion.
Institutional Day Logic
The algorithm recognizes that institutional trading days run from 18:00-16:59 (not midnight-midnight). This alignment ensures FVGs are managed according to institutional timeframes rather than arbitrary calendar boundaries.
Contamination Avoidance System
Volatility Settlement Principle:
Opening mechanics create artificial volatility that can produce false FVG signals. The indicator automatically blocks detection during exact session opening times (X:00) and requires settlement time (X:01+) before identifying clean institutional inefficiencies.
Special NY AM Handling:
Provides configurable 9:30 detection for advanced users who want to capture potential opening range FVGs, with clear visual warnings about contamination risk.
VISUAL SYSTEM
Color Intelligence
- Current Day FVGs: Full opacity with session-specific colors
- Previous Day FVGs: 70% transparency for historical reference
- Special Timing (9:30): Dedicated warning color with alert labels
- Dark Mode Support: Automatic text/line color adaptation
Enhanced Visual Elements
C.E. (Consequent Encroachment) Lines:
Automatically calculated 50% levels within each FVG, representing the most likely fill point based on institutional behavior patterns. These levels extend and freeze with their parent FVG.
Contamination Warnings:
Visual alerts when FVGs are detected during potentially contaminated timing, helping traders understand signal quality.
Session Identification:
Clear labeling system showing FVG type (FVG/A.FVG), session origin (NY AM, London, etc.), and creation date for easy reference.
HOW TO USE
Basic Setup
1. Session Selection: Enable/disable specific sessions based on your trading strategy
2. FVG Type: Choose between Classic FVGs or A.FVGs depending on your analysis preference
3. Visual Preferences: Adjust colors, text size, and enable dark mode if needed
Trading Applications
Intraday Reference Levels:
Use current day FVGs as potential support/resistance for price action analysis. The dynamic extension ensures levels remain relevant throughout the trading session.
Multi-Session Analysis:
Monitor how price interacts with FVGs from different sessions to understand institutional flow and market structure.
C.E. Level Trading:
Focus on the 50% consequent encroachment levels for high-probability entry points when price approaches FVG zones.
Historical Context:
Previous day FVGs (shown with transparency) provide context for understanding market structure evolution across multiple trading days.
Advanced Features
9:30 Special Detection:
For experienced traders, enable 9:30 FVG detection to capture opening range inefficiencies, but understand the contamination risks indicated by warning labels.
A.FVG vs Classic Toggle:
Switch between detection modes based on market conditions - A.FVGs for trending environments, Classic FVGs for ranging conditions.
Best Practices
- Use on 1-minute to 15-minute timeframes for optimal session detection
- Combine with other institutional concepts (order blocks, liquidity levels) for comprehensive analysis
- Pay attention to transparency states - current day FVGs are more actionable than previous day references
- Consider C.E. levels as primary targets rather than full FVG fills
TECHNICAL SPECIFICATIONS
Platform: Pine Script v6 for optimal performance and reliability
Timeframe Compatibility: All timeframes (optimized for 1M-15M)
Market Compatibility: 24-hour markets (Forex, Crypto, Futures)
Session Management: Automatic trading day detection with weekend handling
Memory Management: Intelligent capacity limits with automatic cleanup
Performance: Optimized algorithms for smooth real-time operation
CLOSED SOURCE JUSTIFICATION
This indicator is published as closed source to protect the proprietary algorithms that enable:
- Precise 24-hour lifecycle timing calculations with institutional day alignment
- Advanced A.FVG classification with sophisticated volume imbalance detection
- Complex multi-session coordination with contamination filtering
- Optimized memory management preventing performance degradation
- Specialized visual state management for transparency and extension logic
The combination of these advanced systems creates a unique implementation that goes far beyond basic FVG detection, warranting protection of the underlying computational methods while providing full transparency about functionality and usage.
PERFORMANCE CHARACTERISTICS
Real-Time Operation: Smooth performance with minimal resource usage
Accuracy: Precise session detection with timezone consistency
Reliability: Robust error handling and edge case management
Scalability: Supports multiple simultaneous FVGs without performance impact
This advanced implementation represents significant evolution beyond basic FVG indicators, providing institutional-grade analysis tools for serious traders while maintaining the clean visual presentation essential for effective technical analysis.
IMPORTANT DISCLAIMERS
Past performance does not guarantee future results. This indicator is an educational tool based on ICT's Fair Value Gap concepts and should be used as part of a comprehensive trading strategy. Users should understand the risks involved in trading and consider their risk tolerance before making trading decisions. The indicator identifies potential support/resistance levels but does not predict market direction with certainty.
2 days ago
Release Notes
IME's Community First Presented FVGs v1.5.2 - Critical Bug Fixes
Bug Fixes:
v1.5.1 - Fixed 9:30 Contamination Blocking:
Issue: When 9:30 detection toggle was OFF, script still detected 9:30 candles as F.P. FVGs
Fix: Added proper contamination blocking logic that prevents 9:30 middle candle detection when toggle is OFF
Result: Toggle OFF now correctly shows clean F.P. FVGs at 9:31+ (proper ICT volatility settlement)
v1.5.2 - Fixed A.FVG Box Calculation Accuracy:
Issue: A.FVG boxes incorrectly included ALL body levels even when no actual deadpool existed between specific candles
Fix: Implemented selective body level inclusion - only adds body prices where actual volume imbalances exist
Result: A.FVG boxes now accurately represent only areas with real institutional volume imbalances
Impact:
More Accurate Detection: 9:30 contamination properly blocked when disabled
Precise A.FVG Zones: Boxes only include levels with actual deadpools/volume imbalances
Institutional Accuracy: Both fixes align detection with true institutional trading principles
Technical Details:
Enhanced contamination blocking checks middle candle timing in normal mode
A.FVG calculation now selectively includes body levels based on individual deadpool existence
Maintains backward compatibility with all existing features and settings
These fixes ensure the indicator provides institutionally accurate FVG detection and sizing for professional trading analysis.

Rejection Blocks (RJB) and Liquidity Grabs (SFPs)- Milana TradesThis indicator highlights Rejection Blocks (RJB) and Liquidity Grabs (SFPs)—two advanced price action concepts used by professional traders, especially those following ICT (Inner Circle Trader) strategies.
Rejection Block (RJB) is an advanced version of the traditional Order Block. It marks areas where price has been sharply rejected—often zones where smart money enters or exits positions. The logic is based on specific wick rejection criteria and candle structure, with mitigated RJBs marked or hidden automatically.
Liquidity Grab (SFP) detects key Swing Failure Patterns—where price takes out a previous high/low, grabs liquidity, and reverses. Optional volume validation is available for more accurate filtering, especially using LTF (lower timeframe) data.
Key Features:
Rejection Block (RJB)
1) Identifies both bullish and bearish rejection blocks.
2) Two logic types: “trapped wick” and “signal wick” configurations.
3) Auto-detection of mitigated RJBs and customizable visualization.
4)Adjustable color, transparency, box style, label text, and more.
5)Limit on max RJBs displayed to keep the chart clean.
Liquidity Grab (SFP)
1)Detects bullish and bearish SFPs (Swing Failure Patterns).
2)Optional volume validation with threshold control (based on LTF).
3)Dynamically adjusts lower timeframe resolution (auto/manual).
4)Visual confirmation lines, wick highlights, and labels.
5)SFP Dashboard table (optional) for LTF & validation display.
SFP Wick to RJB Zones
Converts confirmed SFPs into new RJB boxes.
Adds powerful confluence between rejection and liquidity.
🔔 Built-in Alerts
Alerts can be set up for both bullish and bearish Rejection Blocks, as well as confirmed SFPs.
Ideal for traders who want to be notified in real-time when price:
Forms a valid Rejection Block,
Prints a confirmed SFP (Swing Failure),
Enters or exits key liquidity zones.
Alerts are fully compatible with TradingView’s alert system.
⚙️ Settings Overview:
Rejection Blocks
Enable plotting, box limit, mitigated filtering, label customization.
Liquidity Grabs (SFPs)
Enable SFPs (bull/bear), pivot length, volume % threshold, LTF resolution.
Enable dashboard, wick display, and validation logic.
SFP-based RJB
Create RJB zones from confirmed SFP signals.
Independent box length and color settings.
Dashboard & Labels
Enable/disable visual labels and LTF info table.
Customize font size, color, and position.
Use Cases:
Identify smart money rejection zones before price reversals.
Use mitigated RJBs to anticipate failed retests or structure breaks.
Trade with confidence by combining RJB + SFP signals.
Set alerts to monitor setups without staring at charts 24/7.
Notes:
Compatible with any market (Forex, Crypto, Indices, Stocks).
Works on all timeframes.

Predictive Time & AlertsPredictive Time Engine (ICT Macros)
Summary
The Predictive Time Engine is a visual tool designed specifically for traders who utilize Time & Price based methodologies, particularly those inspired by ICT (Inner Circle Trader) concepts.
The primary purpose of this indicator is to visualize the critical "time windows" where market liquidity is most likely to be significantly manipulated or distributed. Instead of only appearing in real-time, this indicator is predictive: at the beginning of each day, it will automatically calculate and draw all selected macro sessions for the day ahead, serving as your daily time roadmap.
With this tool, you will no longer miss these crucial moments and can be better prepared to anticipate price action.
Key Features
Predictive Visualization: Automatically projects and draws all macro time windows for the current trading day, giving you a forward-looking view of where the action is likely to occur.
ICT Macro Time Filter: Based on the "Hourly-Macros" concept, which are specific 20-minute periods within each hour (e.g., 09:50 - 10:10) where the price delivery algorithm (IPDA) is often active. You can select and enable each macro window you wish to monitor.
Full Customization: You have complete control over how the information is displayed. Choose between:
Outline: A clean, transparent box frame.
Background: A solid, colored background for the time zone.
Vertical Lines (Dotted, Dashed, Solid): Marks the beginning of each macro session with a vertical line in your chosen style.
Real-time Alerts: Set up notifications in TradingView to get an alert precisely when the price enters one of your selected Macro Time windows.
Automatic Management: Drawings from previous days are automatically cleared to keep your chart clean and focused on the current day's schedule.
The Concept Behind the Indicator
This indicator is inspired by the concept that the market moves in fractal Time Cycles, from yearly down to 90-minute periods. Each of these time cycles often follows a pattern of AMD (Accumulation, Manipulation, Distribution).
Accumulation: A phase of order gathering.
Manipulation: Price is often driven in the opposite direction of its true intent to sweep liquidity (stop losses).
Distribution: The true price move towards a liquidity target (Draw On Liquidity).
The Macro Time windows marked by this indicator are often the stage where the Manipulation phase or the beginning of the Distribution phase occurs. By knowing when these times are approaching, traders can be on high alert and look for confirming trade setups in the most potent areas and times.
How to Use
Configure Sessions: Open the indicator's Settings.
In the "1. General Settings" tab, ensure the Timezone matches your chart's local time (Default: "America/New_York").
In the "2. Active Macro Sessions" tab, check the box for each macro time window you want to monitor.
Choose Display Style: In "General Settings", select your preferred "Display Style" (Outline, Background, or various Line types). You can also change the color.
Set Up Alerts (Optional):
Click the "Alert" clock icon in the TradingView toolbar.
In the "Condition" section, select this indicator: Predictive Time Engine.
From the dropdown below it, ensure "Sesi Makro Dimulai" (Macro Session Start) is selected.
Set your desired notification options and click "Create".
Chart Interpretation: Use the marked time zones as high-alert areas. Pay close attention to how price reacts when entering or leaving these zones to find potential entry opportunities that align with your trading strategy.
Disclaimer: This tool is provided for educational and analytical purposes only. It is not financial advice. All trading decisions are solely your responsibility. Conduct your own research and manage your risk appropriately.
ICT IRL & ERL ZonesICT IRL & ERL Zones
This indicator visualizes Internal Range Liquidity (IRL) and External Range Liquidity (ERL) levels, based on ICT (Inner Circle Trader) concepts. It's designed to help traders identify key liquidity zones that often act as magnet levels or reversal points in price action.
🔍 How It Works
Lookback Range: The script analyzes the highest high and lowest low over a user-defined number of candles (default: 50).
IRL (Internal Range Liquidity):
Plots the highest high and lowest low within the lookback period.
Represented as orange lines and a shaded zone.
ERL (External Range Liquidity):
Extends the IRL boundaries by a small buffer (50 ticks above/below).
Visualizes zones where price may reach for liquidity beyond the current range.
Plotted as a green (high) and red (low) line.
⚙️ Inputs
Lookback Range: Number of candles to calculate the range (min 5).
Show IRL: Toggle visibility for Internal Range Liquidity zone.
Show ERL: Toggle visibility for External Range Liquidity buffer zone.
📊 Visual Elements
IRL High/Low: Orange lines with fill to mark the main liquidity range.
ERL High/Low: Green and red lines indicating potential liquidity sweep zones.
Zone Fill: Light orange shading to visually emphasize the IRL area.
📈 Use Case
Use this tool to:
Identify areas where price might consolidate or reverse.
Highlight likely zones of liquidity grabs before trend continuations or shifts.
Enhance entry/exit decisions based on smart money concepts.

True Market Structure [Advanced Liquidity Hunter] v1True Market Structure v1
📌 Table of Contents
1. Introduction
2. Core Concepts
3. Indicator Components
4. Configuration
5. Signal Interpretation
6. Trading Strategies
7. Risk Management
8. FAQ
________________________________________
🎯 Introduction
What is True Market Structure?
True Market Structure is an advanced technical analysis indicator that reveals hidden market mechanisms. Based on Smart Money Concepts (SMC) and ICT (Inner Circle Trader) methodology, it identifies where large financial institutions hunt retail traders' stop losses.
Who is this indicator for?
• ✅ Beginners - Intuitive visualizations and clear signals
• ✅ Intermediate - Deeper market structure analysis
• ✅ Advanced - Full parameter control and advanced strategies
Key Benefits
• 🔍 Sees the invisible - Hidden liquidity levels
• 🎯 Precise signals - Based on real data
• ⚡ Real-time - Instant analysis
• 🛡️ Capital protection - Warns against traps
💡 Pro Tip: Start with 15M timeframe! That's where most action happens - stop hunts every few candles, retail traps, liquidity battles. It's the best "microscope" to understand how the market really works.
________________________________________
📚 Core Concepts
Smart Money vs Retail Money
Smart Money:
• Banks, hedge funds, large institutions
• Create market moves, don't follow them
• Exploit retail predictability
Retail Money:
• Individual traders
• Often act emotionally
• Place stop losses at predictable levels
Liquidity
Liquidity refers to areas where many orders are waiting:
• Stop losses above highs (shorts)
• Stop losses below lows (longs)
• Orders at round numbers
Key principle: Smart Money needs liquidity to enter/exit large positions. That's why they "hunt" stop losses first, then make the real move.
________________________________________
🔧 Indicator Components
1. 💧 Liquidity Pools
What is it?
• Price levels tested multiple times
• Stop loss accumulation areas
• Displayed as blue horizontal lines
How to read?
• LIQ HIGH x15 = Level tested 15 times from above
• LIQ LOW x8 = Level tested 8 times from below
• Higher number = stronger zone
Significance:
• Price magnet
• High probability of reaction
• Smart Money target
2. 🎣 Stop Hunts
What is it?
• Candles with long wicks
• Brief penetrations of important levels
• Marked with purple labels
Types:
• STOP HUNT ⬆ - Upward hunt (shorts' stop losses)
• STOP HUNT ⬇ - Downward hunt (longs' stop losses)
Characteristics:
• Long wick (minimum 2x larger than body)
• Wick must also be larger than 0.5 ATR (default)
• Breaks recent high/low from lookback period
• Quick price return
3. 🪤 Trapped Traders
What is it?
• Areas where retail got trapped
• Failed breakouts that didn't hold
• Colored rectangles on chart
Trap types:
• 🔴 TRAPPED LONGS - Buyers caught at top
• 🟢 TRAPPED SHORTS - Sellers caught at bottom
Mechanism:
1. Important level break
2. Retail enters breakout direction
3. Price returns leaving them at loss
4. Stop losses get activated
4. 🎪 Inducement Levels
What is it?
• "Too obvious" support/resistance
• Levels respected minimum 3 times
• Orange dashed lines
Why is it a trap?
• Look like perfect trading spots
• Attract retail traders' attention
• Smart Money uses them to collect liquidity
Example:
• 100,000 level on BTC - round number
• 3 bounces = "strong support"
• Retail buys, Smart Money sells to them
5. ⏰ Kill Zones
What is it?
• Highest Smart Money activity periods
• Red background on chart
• Maximum manipulation time
Default Kill Zones:
• 🌆 London Open (08:00-09:00 UTC)
• 🏙️ NY Open (13:00-14:00 UTC)
• 🌃 Midnight (00:00-01:00 UTC)
Trading Sessions (chart background):
• 🌏 Asian (00:00-08:00 UTC) - Gray background
• 🇬🇧 London (08:00-16:00 UTC) - Blue background
• 🇺🇸 New York (13:00-21:00 UTC) - Orange background
Note: London and New York sessions overlap (13:00-16:00 UTC) - this is the highest liquidity period!
6. 🎯 Smart Money Signals
What is it?
• Potential institutional entry points
• Large labels with 🎯 emoji
• Appear after stop hunts
Conditions:
1. Stop hunt in one direction
2. High volume (2x average)
3. In Kill Zone
4. Direction reversal
7. 📊 Market Analysis Table
The table displays 9 rows with key information:
1. Session - Current trading session (ASIA/LONDON/NEW YORK/CLOSED)
2. Kill Zone - Zone status (🔴 ACTIVE / ✅ SAFE)
3. Liquidity Pools - Number of liquidity zones found
4. Inducement Levels - Number of bait levels
5. Traps (50 bars) - Number of traps in last 50 bars
6. Market Bias - Market direction:
o BULLISH 📈 (close > SMA50 and EMA21)
o BEARISH 📉 (close < SMA50 and EMA21)
o NEUTRAL ➡️ (other cases)
7. Volume - Volume status:
o 🔥 EXTREME (>2x average)
o ⬆️ HIGH (>1.5x average)
o NORMAL (>average)
o ⬇️ LOW (3 traps)
o ⚠️ CHOPPY (>5 traps)
o 👀 WATCH LIQUIDITY (>3 liquidity zones)
o ✓ NORMAL (other)
________________________________________
⚙️ Configuration
Step 1: Basic Configuration
Where to find settings:
• Method 1: Click the ⚙️ (gear) icon next to indicator name on chart
• Method 2: Double-click any indicator line/label
• Method 3: Right-click → "Settings" on indicator name
🌍 Timezone Setting
UTC Offset: Your timezone
Examples:
- London: 0 (winter) or +1 (summer)
- New York: -5 (winter) or -4 (summer)
- Tokyo: +9
🎚️ Sensitivity Adjustment
For beginners - Default settings:
• Lookback Period: 30
• Detection Sensitivity: 0.3
• Min. Touches: 2
For different timeframes:
• 15M: Sensitivity 0.2-0.3, Lookback 20-30
• 1H: Sensitivity 0.3-0.4, Lookback 30-40
• 4H: Sensitivity 0.4-0.5, Lookback 40-50
For different instruments:
• Forex Majors (EUR/USD): Sensitivity 0.1-0.2
• Indices (S&P500;): Sensitivity 0.2-0.4
• Crypto (BTC): Sensitivity 0.4-0.8
• Stocks: Sensitivity 0.3-0.5
Step 2: Advanced Configuration
🔧 Liquidity Zones Parameters
• Min. Touches (1-5): Less = more signals
• Lookback (20-200): More = further levels
• Max Zones (1-10): Display quantity control
🎣 Stop Hunt Parameters
• Wick/Body Ratio (1-5): Lower = more signals
• Min. Wick Size (0.1-2 ATR): Filters small wicks
🎯 Smart Money Analysis
• Require Kill Zone: Enable for fewer signals
• Volume Multiplier: Higher = only big moves
________________________________________
📖 Signal Interpretation
Note: Most examples are shown on 15M timeframe, because that's where you can best see all market manipulations in action!
Signal Importance Hierarchy
1. 🎯 Smart Money Signal - Strongest signal
2. 🪤 Trapped Traders - High reliability
3. 🎣 Stop Hunt - Medium reliability
4. 💧 Liquidity Touch - Needs confirmation
Interpretation Examples
Scenario 1: "Liquidity Grab"
You see: LIQ HIGH x20 at 100,000
+ Stop Hunt ⬆
+ Volume spike
= Likely decline
Scenario 2: "Trap and Reverse"
You see: TRAPPED LONGS
+ Kill Zone Active
+ SM SHORT 🎯
= Strong short signal
Scenario 3: "Inducement Break"
You see: Inducement Level break
+ No volume
+ Status: NORMAL
= Likely trap, wait
Colors and Their Meaning
• 🔵 Blue - Liquidity (neutral)
• 🟠 Orange - Caution, possible trap
• 🔴 Red - Negative signal / long trap
• 🟢 Green - Positive signal / short trap
• 🟣 Purple - Stop hunt (neutral, wait for reaction)
________________________________________
💡 Trading Strategies
Strategy 1: "Liquidity Sweep" (For Beginners)
Assumptions:
• Trade only with trend
• Wait for liquidity collection
• Enter on return
Best timeframe for learning: 15M - you'll see all manipulation stages in real-time!
Steps:
1. Identify trend (Market Bias in table)
2. Find nearest liquidity zone aligned with trend
3. Wait for price to touch and bounce
4. Enter after confirming candle
5. Stop loss beyond liquidity zone
6. Take profit at next zone
Example:
• Trend: BULLISH
• Liquidity at 100,000 (support)
• Price drops to 99,950 (stop hunt)
• Returns above 100,000
• LONG with SL 99,900, TP 101,000
Strategy 2: "Kill Zone Hunter" (Intermediate)
Assumptions:
• Trade only in Kill Zones
• Exploit stop hunts
• Aggressive entries
Ideal timeframe: 15M - in Kill Zones on 15M you'll see exactly every Smart Money move!
Steps:
1. Wait for Kill Zone (red background)
2. Watch first 15-30 minutes
3. Look for stop hunt
4. Enter immediately after stop hunt
5. Tight stop loss (0.5 ATR)
6. Scale position with profit
Tips:
• London Open - often stop hunt down, then rise
• NY Open - often tests Asian High/Low
• Midnight - position resets, false moves
Strategy 3: "Smart Money Follow" (Advanced)
Assumptions:
• Ignore minor signals
• Wait only for SM signals
• Larger positions, fewer trades
Steps:
1. Status must show HIGH RISK or WATCH LIQUIDITY
2. Wait for stop hunt series (minimum 2)
3. Watch Trapped Traders
4. Enter only on SM signal 🎯
5. Stop loss beyond last extreme
6. Hold position until opposite SM signal
Position Management:
• 1/3 position at signal
• 1/3 after direction confirmation
• 1/3 after breaking last high/low
________________________________________
🛡️ Risk Management
Basic Rules
1. Never place stop loss at obvious level
o Add 5-10 pips buffer
o Avoid round numbers
o Check where Liquidity Pools are
2. Reduce position in Kill Zones
o 50% of normal size
o Or wait until they end
3. Avoid trading at HIGH RISK status
o Unless experienced
o Then reverse logic - look for traps
Stop Loss - Where to Place?
❌ Bad places:
• Exactly below/above candle
• At Inducement Levels
• At round numbers
• Where Liquidity Pools visible
✅ Good places:
• Beyond last stop hunt
• Behind Trapped Traders zone
• Minimum 1.5 ATR from entry
• Where SM would lose significantly
Position Sizing
Safe position formula:
Risk per trade = 1-2% of capital
Position size = Risk / (Stop Loss in pips × Pip value)
Modifiers:
• Kill Zone active: × 0.5
• After SM signal: × 1.5
• HIGH RISK status: × 0.3
• With trend: × 1.2
________________________________________
❓ FAQ
General Questions
Q: Indicator shows nothing, what to do? A: Check in settings:
1. Reduce "Min. Touches" to 1
2. Increase "Detection Sensitivity"
3. Enable "Debug Mode" to see statistics
4. Ensure proper timeframe (15M+)
5. On 15M sometimes wait a few candles for first signal
Tip for 15M: If you don't see signals on 15M, enable Debug Mode. If it shows Liq=0, reduce "Min. Touches" to 1 and increase "Liquidity Lookback" to 100.
Q: Too many signals, I'm lost A:
1. Increase requirements (min. touches, respects)
2. Disable some components
3. Trade only strongest signals (SM 🎯)
Q: Which timeframe is best? A:
• 15M - PERFECT FOR LEARNING! Many signals, shows all manipulations, great for beginners
• 30M - Good balance, less noise than 15M
• 1H - Medium-term trading, clear setups
• 4H - Fewer signals but bigger moves, for patient traders
• 1D - Only major levels, position trading
💡 For beginners: Start with 15M! That's where you'll see how the market really works - stop hunts, traps, false breakouts. Only after understanding the mechanics, move to higher timeframes.
Technical Questions
Q: What does "x15" mean at LIQ? A: Number of level touches. Higher = stronger level.
Q: Why are Kill Zones red? A: High risk periods - most manipulation.
Q: What does Debug Mode show? A: When "Show Debug Info" is enabled, a label appears above the last candle with:
• Liq=X - number of Liquidity Pools found
• Ind=X - number of Inducement Levels found
• HighLvl=X - number of highs stored in memory
• LowLvl=X - number of lows stored in memory
This helps understand why sometimes no signals appear (e.g., when Liq=0).
Trading Questions
Q: Can I use only this indicator? A: Yes, but better combined with:
• Trend analysis
• Support/resistance
• Volume
Q: Does it work on all markets? A: Best on liquid ones:
• ✅ Major Forex pairs
• ✅ Main indices
• ✅ BTC, ETH
• ⚠️ Less liquid altcoins
• ❌ Exotic pairs, small caps
Q: How to remove indicator from chart? A:
• Method 1: Click X next to indicator name
• Method 2: Right-click on name → "Remove"
• Method 3: In indicators panel (left side) find and click trash icon
Q: Can I use multiple copies of the indicator? A: Yes! You can add the indicator multiple times with different settings (e.g., one for liquidity, another for stop hunts only).
Q: How much can I earn? A: Indicator doesn't guarantee profit. It's an analysis tool, not a trading system. Your results depend on:
• Discipline
• Risk management
• Experience
• Market conditions
________________________________________
🎯 Quick Start - Checklist
Pro Tip: After adding the indicator, click the star ⭐ to add to favorites - you'll have quick access in the future!
For Beginners:
• After adding indicator, set your UTC offset in settings
• Start on 15M timeframe (where you'll see the most action!)
• Observe for a week without trading
• Learn to recognize each signal type
• Practice on 15M, then try 1H
• Start with "Liquidity Sweep" strategy
• Max 1% risk per trade
• Keep trading journal
First Steps:
1. Days 1-3: Observe and learn signals
2. Days 4-7: Mark potential entries (no trading)
3. Week 2: Demo trading with small positions
4. Week 3+: Real trading with strict risk management
________________________________________
💬 Support
• Questions & Suggestions: Comments section under the indicator
• Bug Reports: Describe issue in comments with timeframe and instrument
• Updates: Click "Follow" to receive notifications
• Examples: Regular trading idea publications with usage examples
💡 Community: Share your setups in comments - let's help each other!
________________________________________
⚖️ Disclaimer
This indicator is an educational and analytical tool. It does not constitute investment advice. Trading involves risk of capital loss. Always conduct your own analysis and apply appropriate risk management. Historical results do not guarantee future profits.

Contrarian 100 MAPairs nicely with Enhanced-Stock-Ticker-with-50MA-vs-200MA located here:
Description
The Contrarian 100 MA is a sophisticated Pine Script v6 indicator designed for traders seeking to identify key market structure shifts and trend reversals using a combination of a 100-period Simple Moving Average (SMA) envelope and Inner Circle Trader (ICT) Break of Structure (BoS) and Market Structure Shift (MSS) logic. By overlaying a semi-transparent SMA-based shadow on the price chart and plotting bullish and bearish structure signals, this indicator helps traders visualize critical price levels and potential trend changes. It leverages higher timeframe (HTF) pivot points and dynamic logic to adapt to various chart timeframes, making it ideal for swing and contrarian trading strategies. Customizable colors, timeframes, and alert conditions enhance its versatility for manual and automated trading setups.
Key Features
SMA Envelope: Plots a 100-period SMA for high and low prices, creating a semi-transparent (50% opacity) purple shadow to highlight the price range and provide context for price movements.
ICT BoS/MSS Logic: Identifies Break of Structure (BoS) and Market Structure Shift (MSS) signals for both bullish and bearish conditions, based on HTF pivot points.
Dynamic Timeframe Support: Adjusts pivot detection based on user-selected HTF (default: 1D) and chart timeframe (1M, 5M, 15M, 30M, 1H, 4H, 1D), ensuring adaptability across markets.
Visual Signals: Draws dotted lines for BoS (bullish/bearish) and MSS (bullish/bearish) signals at pivot levels, with customizable colors for easy identification.
Contrarian Approach: Signals potential reversals by combining SMA context with ICT structure breaks, ideal for traders looking to capitalize on trend shifts.
Alert Conditions: Supports alerts for bullish/bearish BoS and MSS signals, enabling integration with TradingView’s alert system for automated trading.
Performance Optimization: Uses efficient pivot detection and line management to minimize resource usage while maintaining accuracy.
Technical Details
SMA Calculation:
Computes 100-period SMAs for high (smaHigh) and low (smaLow) prices.
Plots invisible SMAs (fully transparent) and fills the area between them with 50% transparent purple for visual context.
Pivot Detection:
Uses ta.pivothigh and ta.pivotlow to identify HTF swing points, with dynamic lookback periods (rlBars: 5 for daily, 2 for intraday).
Tracks pivot highs (pH, nPh) and lows (pL, nPl) using a custom piv type for price and time.
BoS/MSS Logic:
Bullish BoS: Triggered when price breaks above a pivot high in a bullish trend, drawing a line at the pivot level.
Bearish BoS: Triggered when price breaks below a pivot low in a bearish trend.
Bullish MSS: Occurs when price breaks a pivot high in a bearish trend, signaling a potential trend reversal.
Bearish MSS: Occurs when price breaks a pivot low in a bullish trend.
Lines are drawn using line.new with xloc.bar_time for precise alignment, styled as dotted with customizable colors.
HTF Integration: Fetches HTF close prices and pivot data using request.security with lookahead_on for accurate signal timing.
Line Management: Maintains an array of lines (lin), removing outdated lines when new MSS signals occur to keep the chart clean.
Pivot Reset: Clears broken pivots (e.g., when price exceeds a pivot high or falls below a pivot low) to ensure fresh signal generation.
How to Use
Add to Chart:
Copy the script into TradingView’s Pine Editor and apply it to your chart.
Configure Settings:
SMA Length: Adjust the SMA period (default: 100 bars) to suit your trading style.
Structure Timeframe: Set the HTF for pivot detection (default: 1D).
Chart Timeframe: Select the chart timeframe (1M, 5M, 15M, 30M, 1H, 4H, 1D) to adjust pivot sensitivity.
Colors: Customize bullish/bearish BoS and MSS line colors via input settings.
Interpret Signals:
Bullish BoS: White dotted line (default) at a broken pivot high in a bullish trend, indicating trend continuation.
Bearish BoS: White dotted line at a broken pivot low in a bearish trend.
Bullish MSS: White dotted line at a broken pivot high in a bearish trend, suggesting a reversal to bullish.
Bearish MSS: White dotted line at a broken pivot low in a bullish trend, suggesting a reversal to bearish.
Use the SMA shadow to gauge price position within the recent range.
Set Alerts:
Create alerts for bullish/bearish BoS and MSS signals using TradingView’s alert system.
Customize Visuals:
Adjust line colors or SMA fill transparency via TradingView’s settings for better visibility.
Example Use Cases
Swing Trading: Use MSS signals to enter trades at potential trend reversals, with the SMA envelope confirming price extremes.
Contrarian Trading: Capitalize on BoS and MSS signals to trade against prevailing trends, using the SMA shadow for context.
Automated Trading: Integrate BoS/MSS alerts with trading bots for systematic entries and exits.
Multi-Timeframe Analysis: Combine HTF signals (e.g., 1D) with lower timeframe charts (e.g., 1H) for precise entries.
Notes
Testing: Backtest the indicator on your chosen market and timeframe to validate performance.
Compatibility: Built for Pine Script v6 and tested on TradingView as of June 19, 2025.
Limitations: Signals rely on HTF pivot accuracy, which may lag in fast-moving markets. Adjust rlBars or timeframe for sensitivity.
Optional Enhancements: Consider uncommenting or adding a histogram for SMA divergence (e.g., smaHigh - smaLow) for additional insights.
Acknowledgments
This indicator combines ICT’s market structure concepts with a dynamic SMA envelope to provide a unique contrarian trading tool. Share your feedback or suggestions in the TradingView comments, and happy trading!
