Indicator: Market Facilitation Index [MFIndex]
***** NOTE: You may see all GREEN circles (it is due to a recent TV update). To work around this issue, change the "Circles" to "Cross" via Format -> Style *****
Market Facilitation Index, by Bill Williams, plots the effectiveness of price movement by computing the price movement per volume unit.
4 possible combinations of MFIndex and Volume are:
Green :
---------------------------------
MFIndex increases and the volume increases. This means that the amount of participants entering the market increases, therefore the volume increases and the fresh incoming players align their positions in the direction of candlestick growth.
Fade :
------------------------------
MFIndex falls and volume falls. It means that the market participants are indifferent and the price movement is small on small volumes. This usually happens at the end of a trend.
Fake :
------------------------------
MFIndex increases, but the volume falls. It is highly likely that the market is being supported by broker speculation and not any significant client volume.
Squat :
--------------------------------
MFIndex falls, but the volume increases. In this particular situation bulls and bears are fighting between themselves to see who will dominate the next trend. These battles are noticeable by the large sell and buy volumes. However, the price does not change appreciably since the strengths are equal. One of the competing parties either the buyers or the sellers will ultimately triumph in the battle. Usually, the fracture of such a candle indicates if this particular candle determines the continuation of the trend, or terminates the trend.
More info: en.wikipedia.org
Code: pastebin.com
在腳本中搜尋"LazyBear"

Indicators: Twiggs Money Flow [TMF] & Wilder's MA [WiMA]TMF is a CMF (Chaikin Money Flow) variation that addresses some of the gaps in the original indicator. More info: www.incrediblecharts.com
TMF uses true range, rather than daily Highs minus Lows. Also, uses Wilder's MA rather than SMA/EMA.
Since I had to write Wilder's MA (WiMA) for TMF, I have published that also as a separate indicator. WiMA is like EMA, but with a different "alpha" value.
How to include this in your charts?
-----------------------------------------------
- Click on "Share" button (top right on this chart). A dialog box opens up.
- Click on "Make it mine" button. This will create a copy of my published chart for you to edit.
- You can click on "{}" button next to the indicator name to get access to the source code.
- Save it to your CustomScripts library.

Indicator: Custom COG channelThis is my custom channel (Bear Channel!? :)) derived from BB/STARC. It uses both ATR/STDEV for plotting the bounds.
I use COG (Center of Gravity) for deriving the baseline. This enables it to track the price action better than many other channels that make use of MAs or simply "close". Indicator also marks "squeezes" (stdev bands come inside ATR bands). Pay attention to these, as these usually indicate a move.
I am still exploring this indicator on different BTCUSD time frames, would love to hear your feedback / setups for other instruments.
Code for this indicator: pastebin.com
Code for COG fibs I mentioned in the comments: pastebin.com

1st Gray Cross Signals ━ Histogram SQZMOM [whvntr][LazyBear]This is the Histogram Version of one of my other indicators named: SQZ Momentum + 1st Gray Cross Signals (with arrows) Which is a modification of "Squeeze Momentum Indicator" by user: "LazyBear". In that indicator of his he described, and suggested, the use of his gray cross signals to find points of interest for trading based on the direction of momentum when the first gray cross appears... I have programmed these points, and highlighted them, for ease of use. The 1st gray cross strategy, he said , is from John F. Carter's book, Chapter 11, "Mastering the Trade".
Here we have the Histogram version, with background highlights only, and nothing on the chart, in true SQZ Momentum style.
Disclaimer: using this indicator, or any indicator anywhere, involves risk when trading and isn't a guarantee of 100% accurate results.

Divergence of DecisionPoint Breadth Swenlin Trading [LazyBear]// This source code is subject to the terms of the Mozilla Public License 2.0 at mozilla.org
// © 03.freeman
//This is indicator from LazyBear is very accurate for stocks and indexes.
//I added some code snippets for spot and draw divergences automatically
//
// @author LazyBear
//
//
Best use with daily time frame.
Enter when a divergence is found (Bull or Bear label) and wait at least a couple of candles before exit.
Next improvement: alerts ready made for webhooks and screener for multiple tickers.
Please use comment section for any feedback.

Study for Squeeze Momentum Indicator [LazyBear]This study is based on LazyBear Squeeze Momentum Indicator and my strategy developed using it.
I added some custom feature and filters.
Main improvements are:
1- study is updated to version 4 of pine script;
2- I added alerts for entry rules and exit rules.
3- Alert syntax can be customized for webhooks: I added one example only for long entry.
You can customize a lot of features to get a profitable strategy.
Here is a link to original study.
Please use comment section for any feedback.

Squeeze Momentum Indicator Strategy [LazyBear + PineIndicators]The Squeeze Momentum Indicator Strategy (SQZMOM_LB Strategy) is an automated trading strategy based on the Squeeze Momentum Indicator developed by LazyBear, which itself is a modification of John Carter's "TTM Squeeze" concept from his book Mastering the Trade (Chapter 11). This strategy is designed to identify low-volatility phases in the market, which often precede explosive price movements, and to enter trades in the direction of the prevailing momentum.
Concept & Indicator Breakdown
The strategy employs a combination of Bollinger Bands (BB) and Keltner Channels (KC) to detect market squeezes:
Squeeze Condition:
When Bollinger Bands are inside the Keltner Channels (Black Crosses), volatility is low, signaling a potential upcoming price breakout.
When Bollinger Bands move outside Keltner Channels (Gray Crosses), the squeeze is released, indicating an expansion in volatility.
Momentum Calculation:
A linear regression-based momentum value is used instead of traditional momentum indicators.
The momentum histogram is color-coded to show strength and direction:
Lime/Green: Increasing bullish momentum
Red/Maroon: Increasing bearish momentum
Signal Colors:
Black: Market is in a squeeze (low volatility).
Gray: Squeeze is released, and volatility is expanding.
Blue: No squeeze condition is present.
Strategy Logic
The script uses historical volatility conditions and momentum trends to generate buy/sell signals and manage positions.
1. Entry Conditions
Long Position (Buy)
The squeeze just released (Gray Cross after Black Cross).
The momentum value is increasing and positive.
The momentum is at a local low compared to the past 100 bars.
The price is above the 100-period EMA.
The closing price is higher than the previous close.
Short Position (Sell)
The squeeze just released (Gray Cross after Black Cross).
The momentum value is decreasing and negative.
The momentum is at a local high compared to the past 100 bars.
The price is below the 100-period EMA.
The closing price is lower than the previous close.
2. Exit Conditions
Long Exit:
The momentum value starts decreasing (momentum lower than previous bar).
Short Exit:
The momentum value starts increasing (momentum higher than previous bar).
Position Sizing
Position size is dynamically adjusted based on 8% of strategy equity, divided by the current closing price, ensuring risk-adjusted trade sizes.
How to Use This Strategy
Apply on Suitable Markets:
Best for stocks, indices, and forex pairs with momentum-driven price action.
Works on multiple timeframes but is most effective on higher timeframes (1H, 4H, Daily).
Confirm Entries with Additional Indicators:
The author recommends ADX or WaveTrend to refine entries and avoid false signals.
Risk Management:
Since the strategy dynamically sizes positions, it's advised to use stop-losses or risk-based exits to avoid excessive drawdowns.
Final Thoughts
The Squeeze Momentum Indicator Strategy provides a systematic approach to trading volatility expansions, leveraging the classic TTM Squeeze principles with a unique linear regression-based momentum calculation. Originally inspired by John Carter’s method, LazyBear's version and this strategy offer a refined, adaptable tool for traders looking to capitalize on market momentum shifts.

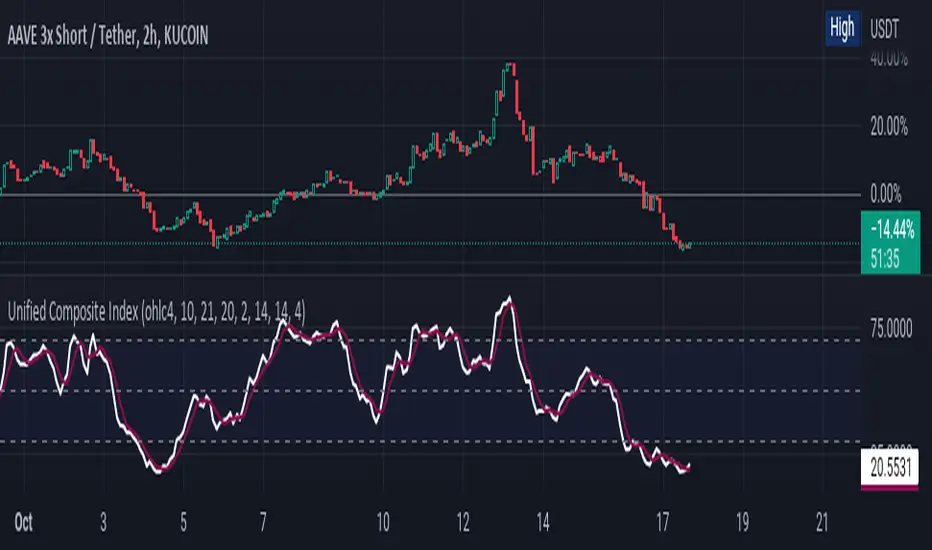
Unified Composite Index [UCI] [KuraiBlu] [LazyBear]The purpose of this indicator is to combine the four basic types of indicators (Trend, Volatility, Momentum and Volume) to create a singular, composite index in order to provide a more holistic means of observing potential changes within the market, known as the Unified Composite Index . The indicators used in this index are as follows:
Trend - Trend Composite Index
Volatility - Bollinger Bands %b
Momentum - Relative Strength Index
Volume - Money Flow Index
The average price source can’t be altered as I’ve made it an average between ((open + close) / 2) and ((high + low) / 2).
The best way to use this is by observing several of the indicators at once in conjunction with the average, rather than simply using the average produced to determine the right moment to enter, or exit a trade by itself. I've found when one indicator goes way out of bounds relative to the other three (and subsequently, the average array), then it presents a good buying, or selling opportunity.
Some adjustments were made to several of the indicators in order to standardize them on a scale of 1-100 so that they could better accommodate the average array that was finally produced. Thanks to LazyBear for letting me strip down the WaveTrend Oscillator.
WaveTrend [LazyBear] vX by DGTDGT interpreted version of LazyBear's WaveTrend, visualizing on Price Chart
Original Author : LazyBear
Crosses above or below threshold are emphasized with bigger labels
- crosses above threshold : probable short indications with a bigger label and relativly small label for probable long indications
- crosses below threshold : probable long indications with a bigger label and relativly small label for probable short indications
All rest crosses within threshold boundaries with relatively small labels for both long and short probable indications

Squeeze Momentum Indicator [LazyBear] vHMAThis is a remake of the famous LazyBear Indicator, the Squeeze Momentum Indicator.
All i did was take out the SMA's and replace them with HMA's. HMA is a more responsive moving average.
Hull Moving Average.
This is a derivative of John Carter's "TTM Squeeze" volatility indicator, as discussed in his book "Mastering the Trade" (chapter 11).
Black crosses on the midline show that the market just entered a squeeze ( Bollinger Bands are with in Keltner Channel). This signifies low volatility , market preparing itself for an explosive move (up or down). Gray crosses signify "Squeeze release".
Mr.Carter suggests waiting till the first gray after a black cross, and taking a position in the direction of the momentum (for ex., if momentum value is above zero, go long). Exit the position when the momentum changes (increase or decrease --- signified by a color change). My (limited) experience with this shows, an additional indicator like ADX / WaveTrend, is needed to not miss good entry points. Also, Mr.Carter uses simple momentum indicator , while I have used a different method (linreg based) to plot the histogram.
More info:
- Book: Mastering The Trade by John F Carter
Here is the original version:

Squeeze [LazyBear] w Murat ColorsOriginal by @LazyBear
Differents:
scolor => white & black
plot histogram => linewidth=5
plot style => circles, linewidth => 4, transp => 0

Colored Volume Bars [LazyBear] with overlayDivs and candle alignment a little easier to see - volume/2 to size correctly - could still use some refining
All credits to LazyBear for his color volume bar source code
Indicator: Intrady Momentum IndexThe Intraday Momentum Index (IMI), developed by Tushar Chande, is a cross-breed between RSI and candlestick analysis. IMI determines the candle type that dominated the recent price action, using that to pinpoint the extremes in intraday momentum.
As the market tries to bottom after a sell off, there are gradually more candles with green bodies, even though prices remain in a narrow range. IMI can be used to detect this shift, because its values will increase towards 70. Similarly, as the market begins to top, there will be more red candles, causing IMI to decline towards 20. When the market is in trading range, IMI values will be in the neutral range of 40 to 60.
Usually intraday momentum leads interday momentum. QStick can show interday momentum, it complements IMI. You will find it in my published indicators.
I have added volatility bands based OB/OS, in addition to static OB/OS levels. You can also turn on IMI Ehlers smoothing. BTW, all parameters are configurable, so do check out the options page.
List of my other indicators:
-
- Google doc: docs.google.com

Indicator: HawkEye Volume IndicatorHawkEye volume, developed by Nigel Hawks, is supposed to be a premier VSA indicator. Documentation on this is scarce (looks like the training seminars/sessions conducted by the parent company cover this in detail), if you come across any (other than what I have mentioned on that chart) do let me know.
I am not sure how much this resembles the commercial indicator out there as I don't have access to one (noticed the "clone" part? :) ). This is a direct port of a similar MT4 indicator. If you have access to the commercial indicator in another platform, do post some comparison results.

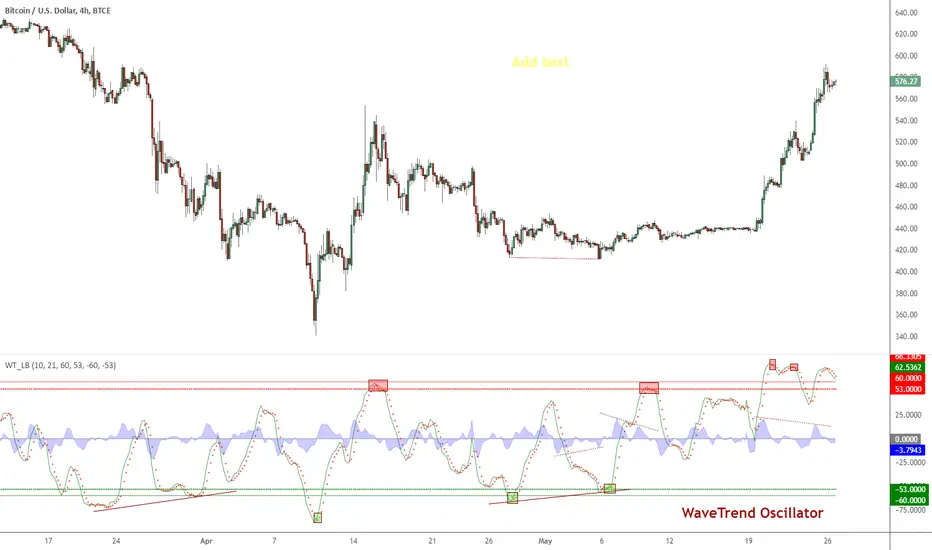
Indicator: WaveTrend Oscillator [WT]WaveTrend Oscillator is a port of a famous TS/MT indicator.
When the oscillator is above the overbought band (red lines) and crosses down the signal (dotted line), it is usually a good SELL signal. Similarly, when the oscillator crosses above the signal when below the Oversold band (green lines), it is a good BUY signal.
I have marked some cross-overs in the above chart. As you can see, they are *not* the only useful signals WT generates. Try it on your instrument and let me know what you think.
3 more indicators: Inverse Fisher on RSI/MFI and CyberCycleSuggested by John Ehlers, IFT helps you to determine the exact oversold/overbought points in any oscillator-type indicators.
The 3 IFT based indicators in this chart are:
- Inverse Fisher on RSI (IFTRSI)
- Inverse Fisher on MFI (IFTMFI)
- Inverse Fisher on CyberCycle (IFTCC)
Suggested method to use any IFT indicator is to buy when the indicator crosses over –0.5 or crosses over +0.5 if it has not previously crossed over –0.5 and to sell short when the indicators crosses under +0.5 or crosses under –0.5 if it has not previously crossed under +0.5.
More info: www.mesasoftware.com
You can use these indicators by doing "Make it mine" (Click on "Share" to open the dialog box with this button).
Let me know what you think, would love to hear how these indicators are used and how effective these are for other instruments.

3 new Indicators - PGO / RAVI / TIIMy "to-publish" list is getting too big, so decided to push out 3 indicators in the same chart
Feel free to "make mine" and use :) Leave a comment on what you think.
Pretty Good Oscillator
----------------------------------------
This indicator, by Mark Johnson, measures the distance of the current close from its N-day simple moving average, expressed in terms of an average true range (see Average True Range) over a similar period. So for instance a PGO value of +2.5 would mean the current close is 2.5 average days' range above the SMA.
Johnson's approach was to use it as a breakout system for longer term trades. If the PGO rises above 3.0 then go long, or below -3.0 then go short, and in both cases exit on returning to zero (which is a close back at the SMA). Indicator marks all these areas (3/-3/0)
Rapid Adaptive Variance Indicator
---------------------------------------------------------
RAVI is a simple indicator, by Tushar Chande, to show whether a stock is trending or not. Unlike ADX, RAVI measures only the trend intensity, it doesn't distinguish which way the trend is going. Rising RAVI shows the beginning of a trend or an increase in trend intensity, a decreasing slope signifies decreasing intensity. Also, RAVI often reacts more quickly and exhibits a more pronounced curve than ADX.
The standard values for daily charts are 7 and 65. For hourly charts, the most common averaging periods are 12 and 72 or 24 and 120.
The signal lines suggested are from +/- 0.3% to +/-1%. I haven't added any markings as these signals are instrument-specific. I suggest doing some back testing and adding these accordingly.
Trend Intensity Index
--------------------------------------
TII, by M. H. Pee, measures the strength of a trend, by looking at what proportion of the past "n" days prices have been above or below the level of today's "x"-day simple moving average. You can configure "n" via options page. "x" is calculated as "2 times n".
TII moves between 0 and 100. A strong uptrend is indicated when TII is above 80. A strong downtrend is indicated when TII is below 20.
Pee recommended entering trades when levels of 80 on the upside or 20 on the downside are reached. Indicator marks these lines for easy reference.

Squeeze Momentum on Reversal Strategy** From the original work of LazyBear ** Thanks for his Squeeze Momentum indicator
This strategy gives acceptable result on EUR/USD - 1H chart with default parameters

WaveTrend with Crosses [LazyBear]LazyBear's wavetrend oscillator enhanced with wavetrend cross visualization on the indicator as well as with bar color highlights.


Squeeze Momentum Strategy [LazyBear] Buy Sell TP SL Alerts-Modified version of Squeeze Momentum Indicator by @LazyBear.
-Converted to version 5,
-Taken inspiration from @KivancOzbilgic for its buy sell calculations,
-Used @Bunghole strategy template with Take Profit, Stop Loss and Enable/Disable Toggles
-Added Custom Date Backtesting Module
------------------------------------------------------------------------------------------------------------------------
All credit goes to above
Problem with original version:
The original Squeeze Momentum Strategy did not have buy sell signals and there was alot of confusion as to when to enter and exit.
There was no proper strategy that would allow backtesting on which further analysis could be carried out.
There are 3 aspects this strategy:
1 ) Strategy Logic (easily toggleable from the dropdown menu from strategy settings)
- LazyBear (I have made this simple by using Kivanc technique of Momentums Moving Average Crossover, BUY when MA cross above signal line, SELL when crossdown signal line)
- Zero Crossover Line (BUY signal when crossover zero line, and SELL crossdown zero line)
2) Long Short TP and SL
- In strategies there is usually only 1 SL and 1 TP, and it is assumed that if a 2% SL giving a good profit %, then it would be best for both long and short. However this is not the case for many. Many markets/pairs, go down with much more speed then they go up with. Hence once we have a profitable backtesting setting, then we should start optimizing Long and Short SL's seperately. Once that is done, we should start optimizing for Long and Short TP's separately, starting with Longs first in both cases.
3) Enable and Disable Toggles of Long and Short Trades
- Many markets dont allow short trades, or are not suitable for short trades. In this case it would be much more feasible to disable "Short" Trading and see results of Long Only as a built in graphic view of backtestor provides a more easy to understand data feed as compared to the performance summary in which you have to review long and short profitability separately.
4) Custom Data Backtesting
- One of most crucial aspects while optimizing for backtesting is to check a strategies performance on uptrends, downtrend and sideways markets seperately as to understand the weak points of strategy.
- Once you enable custom date backtesting, you will see lines on the chart which can be dragged left right based on where you want to start and end the backtesting from and to.
Note:
- Not a financial advise
- Open to feedback, questions, improvements, errors etc.
- More info on how the squeeze momentum works visit LazyBear indicator link:
Happy Trading!
Cheers
M Tahreem Alam @mtahreemalam

OBV Oscillator [LazyBear]- with some MAsThis indicator in modified OBV written by @LazyBear
I just added the 2 different Bollinger Bands and 2 different moving averages to the OBV version of LazyBear.
OBV line green -> OBV above zero
OBV line red -> OBV under zero
green background line -> OBV crossover 1st Moving Average
red background line -> OBV crossunder 1st Moving Average
blue '◆' -> OBV crossover 2nd Moving Average
yellow '◆' -> OBV crosunder 2nd Moving Average
blue '+' -> 1st Moving Average crossUNDER 2nd Moving Average
red '+' -> 1st Moving Average crossOVER 2nd Moving Average
