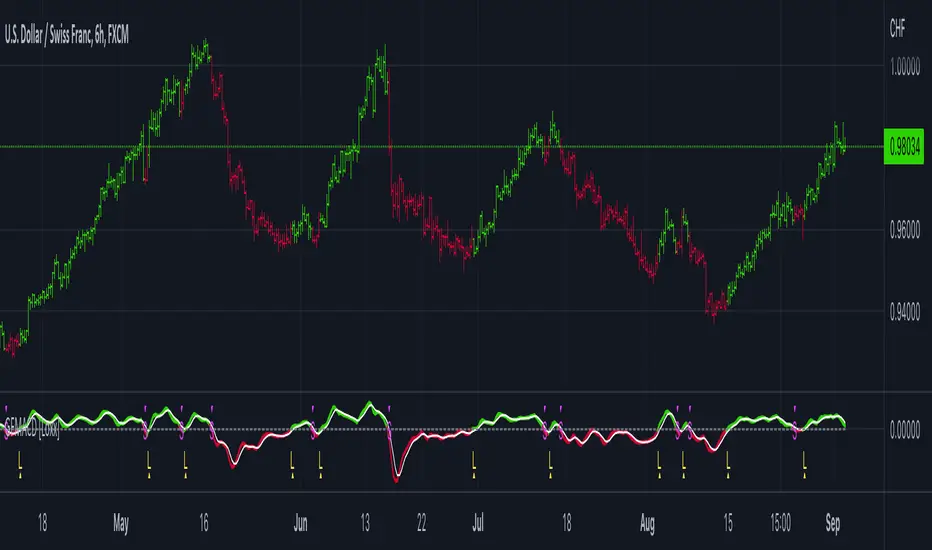
Hybrid, Zero lag, Adaptive cycle MACD [Loxx]TASC's March 2008 edition Traders' Tips includes an article by John Ehlers titled "Measuring Cycle Periods," and describes the use of bandpass filters to estimate the length, in bars, of the currently dominant price cycle.
What are Dominant Cycles and Why should we use them?
Even the most casual chart reader will be able to spot times when the market is cycling and other times when longer-term trends are in play. Cycling markets are ideal for swing trading however attempting to “trade the swing” in a trending market can be a recipe for disaster. Similarly, applying trend trading techniques during a cycling market can equally wreak havoc in your account. Cycle or trend modes can readily be identified in hindsight. But it would be useful to have an objective scientific approach to guide you as to the current market mode.
There are a number of tools already available to differentiate between cycle and trend modes. For example, measuring the trend slope over the cycle period to the amplitude of the cyclic swing is one possibility.
We begin by thinking of cycle mode in terms of frequency or its inverse, periodicity. Since the markets are fractal; daily, weekly, and intraday charts are pretty much indistinguishable when time scales are removed. Thus it is useful to think of the cycle period in terms of its bar count. For example, a 20 bar cycle using daily data corresponds to a cycle period of approximately one month.
When viewed as a waveform, slow-varying price trends constitute the waveform's low frequency components and day-to-day fluctuations (noise) constitute the high frequency components. The objective in cycle mode is to filter out the unwanted components--both low frequency trends and the high frequency noise--and retain only the range of frequencies over the desired swing period. A filter for doing this is called a bandpass filter and the range of frequencies passed is the filter's bandwidth .
Indicator Features
-Zero lag or Regular MACD/signal calculation
- Fixed or Band-pass Dominant Cycle for MACD and Signal MA period inputs
-10 different moving average options for both MACD and Signal MA calculations
-Separate Band-pass Dominant Cycle calculations for both MACD and Signal MA calculations
- Slow-to-Fast Band-pass Dominant Cycle input to tweak the ratio of MACD MA input periods as they relate to each other
在腳本中搜尋"MACD"

Selected MACD Areas CompareThis is a simple tool to compare two selected MACD histogram area. The MACD histogram area is sometimes used to determine trend reversal or trend strength. One may have difficulty with this when the compared MACD areas are of different shape or similar in size. This indicator/tool allows user to select two time periods on the chart and get a precise compare result.
To use the indicator, place a regular MACD indicator on the chart which shows the histogram, then add this indicator and select the two areas of which you want to compare the size. Please make sure that the regular MACD indicator this one have the same source.

RSI MACD Same RatioこのインジケータはRSIとMACDを同比率で表示するものです。
なぜ同比率で表示するのでしょうか。
同比率で表示することでRSIとMACDのダイバージェンスを同時に確認することができます。
私には思いつきませんが、他にも使い道はあるかもしれません。
必要と感じた場合はぜひ使ってみてください。
※同比率で表示するためにRSIとMACDの値を変更しています。
そのため、値はあくまで参考程度にご覧ください。
注目すべきはラインのみです。
使う場合は「adjustment ratio」に適当な値を入れて、RSIの比率とMACDの比率を合わせてください。
それでは良いトレードライフを。
-----
This indicator shows RSI and MACD in equal proportions.
Why are they displayed at the same ratio?
By displaying at the same ratio, you can check the divergence of RSI and MACD at the same time.
I can't think of it, but there may be other uses.
If you feel it is necessary, please use it.
caution!
The RSI and MACD values are changed to display the same ratio.
Therefore, please see the values for reference only.
Only the line should be noted.
When using it, enter an appropriate value in "adjustment ratio" and match the RSI ratio with the MACD ratio.
Let's have a good trade life.

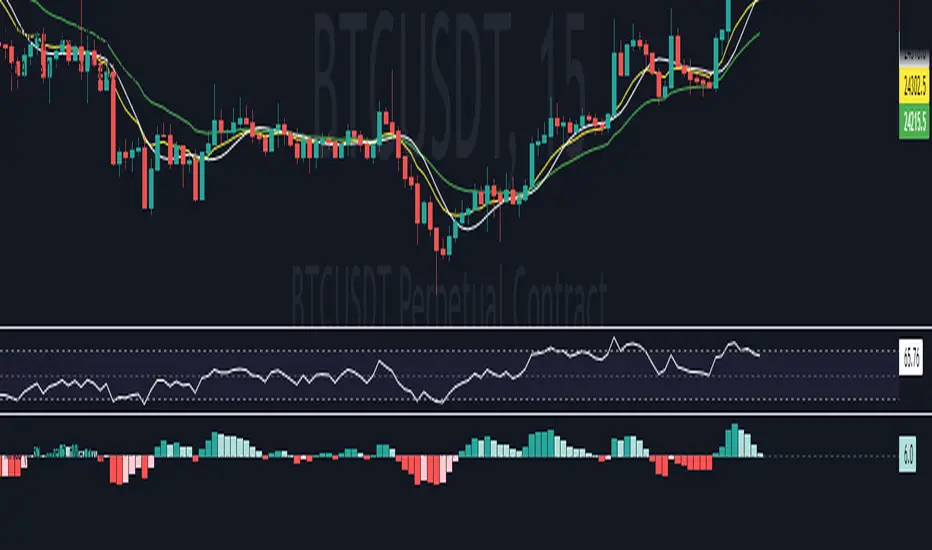
Momentum Strategy (BTC/USDT; 1h) - MACD (with source code)Good morning traders.
It's been a while from my last publication of a strategy and today I want to share with you this small piece of script that showed quite interesting result across bitcoin and other altcoins.
The macd indicator is an indicator built on the difference between a fast moving average and a slow moving average: this difference is generally plottted with a blue line while the orange line is simply a moving average computed on this difference.
Usually this indicator is used in technical analysis for getting signals of buy and sell respectively when the macd crosses above or under its moving average: it means that the distance of the fast moving average (the most responsive one) from the slower one is getting lower than what it-used-to-be in the period considered: this could anticipate a cross of the two moving averages and you want to anticipate this potential trend reversal by opening a long position
Of course the workflow is specularly the same for opening short positions (or closing long positions)
What this strategy does is simply considering the moving average computed on macd and applying a linear regression on it: in this way, even though the signal can be sligthly delayed, you reduce noise plotting a smooth curve.
Then, it simply checks the maximums and the minimums of this curve detecting whenever the changes of the values start to be negative or positive, so it opens a short position (closes long) on the maximum on this curve and it opens a long position (closes short) on the minimum.
Of course, I set an option for using this strategy in a conventional way working on the crosses between macd and its moving average. Alternatively you can use this workflow if you prefer.
In conclusion, you can use a tons of moving averages: I made a function in pine in order to allw you to use any moving average you want for the two moving averages on which the macd is based or for the moving average computed on the macd
PLEASE, BE AWARE THAT THIS TRADING STRATEGY DOES NOT GUARANTEE ANY KIND OF SUCCESS IN ADVANCE. YOU ARE THE ONE AND ONLY RESPONSIBLE OF YOUR OWN DECISIONS, I DON'T TAKE ANY RESPONSIBILITY ASSOCIATED WITH THEM. IF YOU RUN THIS STRATEGY YOU ACCEPT THE POSSIBILITY OF LOOSING MONEY, ALL OF MY PUBBLICATIONS ARE SUPPOSED TO BE JUST FOR EDUCATIONAL PURPOSES.
IT IS AT YOUR OWN RISK WHETHER TO USE IT OR NOT
But if you make money out of this, please consider to buy me a beer 😜
Happy Trading!

[SK] Double MACDThe Double MACD indicator is precisely two different MACD indicators plotted on the same axis for precise visual correlation between each other.
This correlation provides more information than a single regular MACD by allowing you to compare the signals of a shorter timeframe to the default or longer timeframe,
showing the strength of the change in momentum and the peak of the momentum between both configurations.
The indicator has cloud options by default if you toggle on the MACD / Signal lines for better readability.
The cloud will change color to the line on top of it's set. This is to help you not get lost in the 4 different lines.
Customize the indicator to your preference and make it your own
If you'd like a candle like visualization, change the short MACD plot style to a histogram.
For a beautiful double bars style, select bars on both configurations and set the transparency to 30 - 40
For a dynamic moving average style, go with the line plot style ( default )
All MACD/Signal lines are toggled off by default, toggle them on in the inputs section.
On the styles panel, you can turn off the cloud fills or the lines.
Change all the colors you'd like!

SALEH MACD Donchian + EMA & MACD + ADXI gathered all the signals coming from the MACD & Donchian channels indicators and filtered them with EMA 200 or ADX > 25 indicators (which both of them show the trend),
and put them on the chart to show me the buy and sell signals;
the signals rules are as following:
BUY:
when we have an uptrend ( the price is above the EMA 200 or ADX > 25 ) & the macd line cross up the signal line while they are both under the 0 level of histogram it generates buy signals.
SELL:
when we have a downtrend ( the price is below the EMA 200 or ADX > 25) & the macd line cross below the signal line while they are both above the 0 level of histogram it generates sell signals.
Donchian channel works as a confirmation for the macd signal.
this signals work best at London session, you can also filter them by chandelier exit indicator.

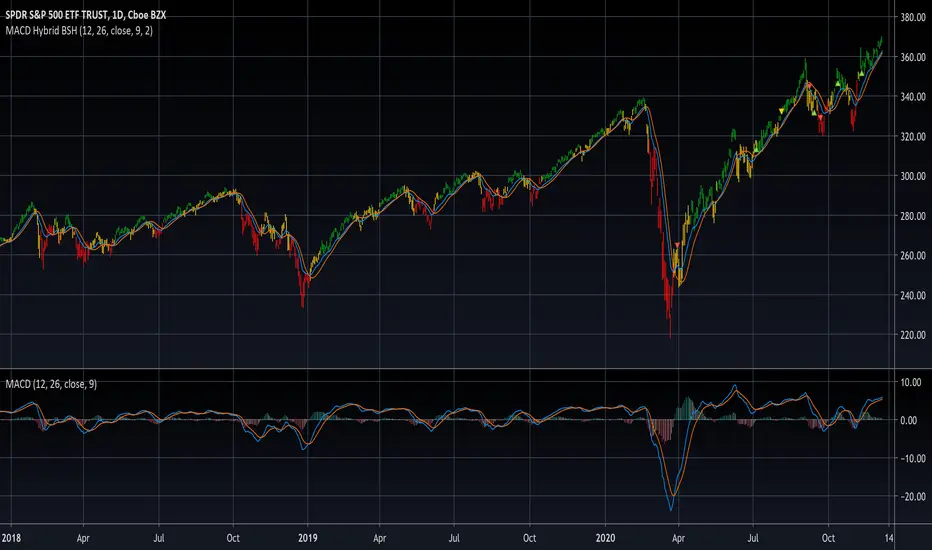
MACD Hybrid BSHMACD = Moving Average Convergence and Divergence
Hybrid = Combining the two main MACD signals into one indicator
BSH = Buy Sell Hold
This indicator looks for a crossover of the MACD moving averages (12ema and 26ema) in order to generate a buy/sell signal and a crossover of the MACD line (12ema minus 26ema) and MACD signal line (9ema of MACD line) in order to generate a completely seperate buy/sell signal. The two buy/sell signals are combined into a hybrid buy/sell/hold indicator which looks for one, neither, or both signals to be "buys." If both signals are buys (fast crossed above slow), a "buy" signal is given (green bar color). If only one signal is a buy, a "hold" signal is given (yellow bar color). If neither signal is a buy, a "sell" signal is given (red bar color). Note: MACD moving averages crossing over is the same thing as the MACD line crossing the zero level in the MACD indicator.
It makes sense to have the MACD indicator loaded as a reference when using this but it isn't required. The lines plotted on the chart are the 12ema and a signal line which is the MACD signal line shown relative to the 12ema rather than the MACD line. The 26ema is not plotted on the chart because the chart becomes cluttered, plus the moving averages crossing over is indicated with the MACD indicator.
This indicator should be used with other indicators such as ATR (1), RSI (14), Bollinger bands (20, 2), etc. in order to determine the best course of action when a signal is given. One way to use this as a strict system is to take a neutral cash position when a yellow "hold" signal is given, to go long when a
green "buy" signal is given, and to go short when a red "sell" signal is given. It can be observed that for many tickers and timeframes that green-yellow-green and red-yellow-red sequences are stronger signals than green-yellow-red and red-yellow-green signals.
Note: Chart type must be "bars" in order for the bar colorization to work properly
Point and Figure (PnF) MACDThis is live and non-repainting Point and Figure Chart MACD tool. The script has it’s own P&F engine and not using integrated function of Trading View.
Point and Figure method is over 150 years old. It consist of columns that represent filtered price movements. Time is not a factor on P&F chart but as you can see with this script P&F chart created on time chart.
P&F chart provide several advantages, some of them are filtering insignificant price movements and noise, focusing on important price movements and making support/resistance levels much easier to identify.
P&F MACD is calculated and shown by using its own P&F engine.
If you are new to Point & Figure Chart then you better get some information about it before using this tool. There are very good web sites and books. Please PM me if you need help about resources.
Options in the Script
Box size is one of the most important part of Point and Figure Charting. Chart price movement sensitivity is determined by the Point and Figure scale. Large box sizes see little movement across a specific price region, small box sizes see greater price movement on P&F chart. There are four different box scaling with this tool: Traditional, Percentage, Dynamic (ATR), or User-Defined
4 different methods for Box size can be used in this tool.
User Defined: The box size is set by user. A larger box size will result in more filtered price movements and fewer reversals. A smaller box size will result in less filtered price movements and more reversals.
ATR: Box size is dynamically calculated by using ATR, default period is 20.
Percentage: uses box sizes that are a fixed percentage of the stock's price. If percentage is 1 and stock’s price is $100 then box size will be $1
Traditional: uses a predefined table of price ranges to determine what the box size should be.
Price Range Box Size
Under 0.25 0.0625
0.25 to 1.00 0.125
1.00 to 5.00 0.25
5.00 to 20.00 0.50
20.00 to 100 1.0
100 to 200 2.0
200 to 500 4.0
500 to 1000 5.0
1000 to 25000 50.0
25000 and up 500.0
Default value is “ATR”, you may use one of these scaling method that suits your trading strategy.
If ATR or Percentage is chosen then there is rounding algorithm according to mintick value of the security. For example if mintick value is 0.001 and box size (ATR/Percentage) is 0.00124 then box size becomes 0.001.
And also while using dynamic box size (ATR or Percentage), box size changes only when closing price changed.
Reversal : It is the number of boxes required to change from a column of Xs to a column of Os or from a column of Os to a column of Xs. Default value is 3 (most used). For example if you choose reversal = 2 then you get the chart similar to Renko chart.
Source: Closing price or High-Low prices can be chosen as data source for P&F charting.
P&F MACD Part
Fast Length: Fast Length for P&F MACD , default value is 12
Slow Length: Fast Length for P&F MACD , default value is 26
Signal Smoothing: Signal Length, default value is 9
Source: Moving averages on P&F charts are based on the average price of each column. Bar chart moving averages are based on each close price. Average price means “(ClosePrice + OpenPrice) / 2”. You can choose Close Price or Average Price as source. Default is Average Price.
There are 2 Alerts:
If PNF MACD line crossover the signal line
If PNF MACD line crossunder the signal line
While adding alert “Once Per Bar Close” option should be chosen.

MAC-Z & MACD Leader signal [ChuckBanger]This is a combination of my MACD Leader script and MAC-Z with option to add Laguerre filter. The advantage of the MAC-Z over MACD is that it is a more accurate and “assumption-free” indicator that can more accurately describe how a market actually perform. But you can use this as a regular MACD indicator.
Crossovers signals
The MAC-Z line and signal line can be utilized in the same way as a stochastic oscillator, with the crossover between the two lines providing buy and sell signals. As with most crossover strategies, a buy signal comes when the shorter-term, more reactive line – in this case the MAC-Z line (blue line) crosses above the slower signal line (orange line). For example, when the MAC-Z line crosses below the signal line it provides a bearish sell signal.
Zero line crossing
The zero cross strategy is based on either of the lines crossing the zero line. If the MAC-Z crosses the zero line from below, it is a signal for a possible new uptrend, while the MAC-Z crossing from above is a signal that a new downtrend may be starting. This is special powerful if the lines has a fast up or down movement but the price action doesn't reflect that movement.
Divergences
Bearish and bullish divergences is my favorite signals. When price action and oscillators follow the same path it is called Convergences, when they don’t, it’s called a Divergence. Don't confuse the two because they have not the same meaning. But be aware that for example during consolidation or low liquidity, some small divergences between price and indicators might form, but that doesn't mean we should consider them as real divergences.
There is many different types of divergences. It is easier to show a picture then explaining it so I recommend you to check out the link below. Especially the top image. It sums this up very well
medium.com
MACD Leader
The MACD leader is only showing the crossing of MACD as a vertical line
Green vertical line = MACD Leader Bullish Cross
Red vertical line = MACD Leader Bearish Cross
MACD Leader:
MAC-Z:
More Information
cssanalytics.wordpress.com
en.wikipedia.org
drive.google.com

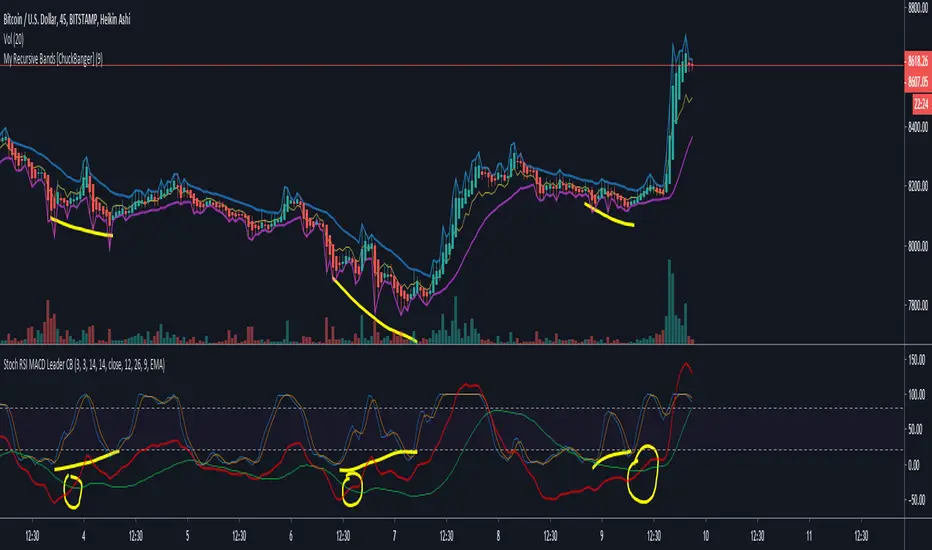
Stochastic RSI and MACD leader [ChuckBanger]Here I have combined Stochastic RSI with my MACD leader.
MACD leader and Stochastic RSI works well together and they are powerful in combination with My Recursive Bands. It is up to you to back test this properly before you use it in real life trades. But in my opinion it is very powerful.
Because of MACD nature it's a little messy when you turn on the MACD's histogram so I commented that out.
MACD Leader:
My Recursive Bands:
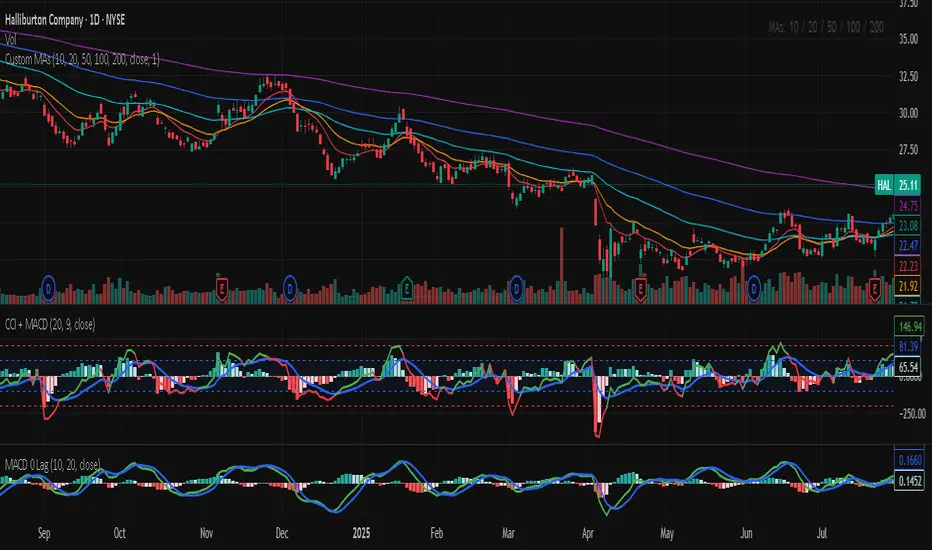
CCI MACDCCI and MACD in one indicator. CCI implementation with MACD like histogram. The result is the same as MACD with zero log.
Stochastic MACDStochastic MACD Indicator: Quick Guide
This Pine Script indicator, "Stochastic MACD" (SMACD), blends MACD and Stochastic Oscillator principles to help you spot momentum shifts and potential reversals.
What it Shows:
SMACD Line: Tracks momentum.
Signal Line: Averages the SMACD line, creating crossovers.
Histogram: Visualizes momentum strength, changing color with direction.
Overbought/Oversold Levels: (Default 10 and -10) Help identify stretched market conditions. Adjustable in settings.
Visual Signals (Triangles):
Red Down Arrow (Overbought Signal): Appears when both SMACD and Signal lines are above the Overbought level (default 10) AND SMACD crosses the Signal line upwards. This suggests strong overbought conditions and a potential reversal down.
Green Up Arrow (Oversold Signal): Appears when both SMACD and Signal lines are below the Oversold level (default -10) AND SMACD crosses the Signal line upwards. This suggests potential buying opportunities from oversold conditions and a possible reversal up.
How to Use It:
Confirm Trends: Use the histogram and line directions.
Spot Reversals: Look for the red and green triangles for quick alerts.
Combine: Always use with other analysis like price action or support/resistance.
Important: This is an analytical tool, not financial advice. Trading involves risk.

Super 6x: RSI, MACD, Stoch, Loxxer, CCI, & Velocity [Loxx]Super 6x: RSI , MACD , Stoch , Loxxer, CCI , & Velocity is a combination of 6 indicators into one histogram. This includes the option to allow repainting.
What is MACD?
Moving average convergence divergence ( MACD ) is a trend-following momentum indicator that shows the relationship between two moving averages of a security’s price. The MACD is calculated by subtracting the 26-period exponential moving average ( EMA ) from the 12-period EMA .
What is CCI?
The Commodity Channel Index ( CCI ) measures the current price level relative to an average price level over a given period of time. CCI is relatively high when prices are far above their average. CCI is relatively low when prices are far below their average. Using this method, CCI can be used to identify overbought and oversold levels.
What is RSI?
The relative strength index is a technical indicator used in the analysis of financial markets. It is intended to chart the current and historical strength or weakness of a stock or market based on the closing prices of a recent trading period. The indicator should not be confused with relative strength .
What is Stochastic?
The stochastic oscillator, also known as stochastic indicator, is a popular trading indicator that is useful for predicting trend reversals. It also focuses on price momentum and can be used to identify overbought and oversold levels in shares, indices, currencies and many other investment assets.
What is Loxxer?
The Loxxer indicator is a technical analysis tool that compares the most recent maximum and minimum prices to the previous period's equivalent price to measure the demand of the underlying asset.
What is Velocity?
In simple words, velocity is the speed at which something moves in a particular direction. For example as the speed of a car travelling north on a highway, or the speed a rocket travels after launching.
How to use
Long signal: All 4 indicators turn green
Short signal: All 4 indicators turn red
Included
Bar coloring
Alerts

Ichimoku Cloud with MACD and Trailing Stop Loss (by Coinrule)The Ichimoku Cloud is a collection of technical indicators that show support and resistance levels, as well as momentum and trend direction. It does this by taking multiple averages and plotting them on a chart. It also uses these figures to compute a “cloud” that attempts to forecast where the price may find support or resistance in the future.
The Ichimoku Cloud was developed by Goichi Hosoda, a Japanese journalist, and published in the late 1960s. It provides more data points than the standard candlestick chart. While it seems complicated at first glance, those familiar with how to read the charts often find it easy to understand with well-defined trading signals.
The Ichimoku Cloud is composed of five lines or calculations, two of which comprise a cloud where the difference between the two lines is shaded in.
The lines include a nine-period average, a 26-period average, an average of those two averages, a 52-period average, and a lagging closing price line.
The cloud is a key part of the indicator. When the price is below the cloud, the trend is down. When the price is above the cloud, the trend is up.
The above trend signals are strengthened if the cloud is moving in the same direction as the price. For example, during an uptrend, the top of the cloud is moving up, or during a downtrend, the bottom of the cloud is moving down.
The MACD is a trend following momentum indicator and provides identification of short-term trend direction. In this variation it utilises the 12-period as the fast and 26-period as the slow length EMAs, with signal smoothing set at 9.
This strategy combines the Ichimoku Cloud with the MACD indicator to better enter trades.
Long/Exit orders are placed when three basic signals are triggered.
Long Position:
Tenkan-Sen is above the Kijun-Sen
Chikou-Span is above the close of 26 bars ago
Close is above the Kumo Cloud
MACD line crosses over the signal line
Exit Position:
Price increases 3% trailing
Price decreases 3% trailing
The script is backtested from 1 June 2022 and provides good returns.
The strategy assumes each order is using 30% of the available coins to make the results more realistic and to simulate you only ran this strategy on 30% of your holdings. A trading fee of 0.1% is also taken into account and is aligned to the base fee applied on Binance.

Adaptive Two-Pole Super Smoother Entropy MACD [Loxx]Adaptive Two-Pole Super Smoother Entropy (Math) MACD is an Ehlers Two-Pole Super Smoother that is transformed into an MACD oscillator using entropy mathematics. Signals are generated using Discontinued Signal Lines.
What is Ehlers; Two-Pole Super Smoother?
From "Cycle Analytics for Traders Advanced Technical Trading Concepts" by John F. Ehlers
A SuperSmoother filter is used anytime a moving average of any type would otherwise be used, with the result that the SuperSmoother filter output would have substantially less lag for an equivalent amount of smoothing produced by the moving average. For example, a five-bar SMA has a cutoff period of approximately 10 bars and has two bars of lag. A SuperSmoother filter with a cutoff period of 10 bars has a lag a half bar larger than the two-pole modified Butterworth filter.Therefore, such a SuperSmoother filter has a maximum lag of approximately 1.5 bars and even less lag into the attenuation band of the filter. The differential in lag between moving average and SuperSmoother filter outputs becomes even larger when the cutoff periods are larger.
Market data contain noise, and removal of noise is the reason for using smoothing filters. In fact, market data contain several kinds of noise. I’ll group one kind of noise as systemic, caused by the random events of trades being exercised. A second kind of noise is aliasing noise, caused by the use of sampled data. Aliasing noise is the dominant term in the data for shorter cycle periods.
It is easy to think of market data as being a continuous waveform, but it is not. Using the closing price as representative for that bar constitutes one sample point. It doesn’t matter if you are using an average of the high and low instead of the close, you are still getting one sample per bar. Since sampled data is being used, there are some dSP aspects that must be considered. For example, the shortest analysis period that is possible (without aliasing)2 is a two-bar cycle.This is called the Nyquist frequency, 0.5 cycles per sample.A perfect two-bar sine wave cycle sampled at the peaks becomes a square wave due to sampling. However, sampling at the cycle peaks can- not be guaranteed, and the interference between the sampling frequency and the data frequency creates the aliasing noise.The noise is reduced as the data period is longer. For example, a four-bar cycle means there are four samples per cycle. Because there are more samples, the sampled data are a better replica of the sine wave component. The replica is better yet for an eight-bar data component.The improved fidelity of the sampled data means the aliasing noise is reduced at longer and longer cycle periods.The rate of reduction is 6 dB per octave. My experience is that the systemic noise rarely is more than 10 dB below the level of cyclic information, so that we create two conditions for effective smoothing of aliasing noise:
1. It is difficult to use cycle periods shorter that two octaves below the Nyquist frequency.That is, an eight-bar cycle component has a quantization noise level 12 dB below the noise level at the Nyquist frequency. longer cycle components therefore have a systemic noise level that exceeds the aliasing noise level.
2. A smoothing filter should have sufficient selectivity to reduce aliasing noise below the systemic noise level. Since aliasing noise increases at the rate of 6 dB per octave above a selected filter cutoff frequency and since the SuperSmoother attenuation rate is 12 dB per octave, the Super- Smoother filter is an effective tool to virtually eliminate aliasing noise in the output signal.
What are DSL Discontinued Signal Line?
A lot of indicators are using signal lines in order to determine the trend (or some desired state of the indicator) easier. The idea of the signal line is easy : comparing the value to it's smoothed (slightly lagging) state, the idea of current momentum/state is made.
Discontinued signal line is inheriting that simple signal line idea and it is extending it : instead of having one signal line, more lines depending on the current value of the indicator.
"Signal" line is calculated the following way :
When a certain level is crossed into the desired direction, the EMA of that value is calculated for the desired signal line
When that level is crossed into the opposite direction, the previous "signal" line value is simply "inherited" and it becomes a kind of a level
This way it becomes a combination of signal lines and levels that are trying to combine both the good from both methods.
In simple terms, DSL uses the concept of a signal line and betters it by inheriting the previous signal line's value & makes it a level.
Included:
Bar coloring
Alerts
Signals
Loxx's Expanded Source Types

Gaussian Filter MACD [Loxx]Gaussian Filter MACD is a MACD that uses an 1-4 Pole Ehlers Gaussian Filter for its calculations. Compare this with Ehlers Fisher Transform.
What is Ehlers Gaussian filter?
This filter can be used for smoothing. It rejects high frequencies (fast movements) better than an EMA and has lower lag. published by John F. Ehlers in "Rocket Science For Traders". First implemented in Wealth-Lab by Dr René Koch.
A Gaussian filter is one whose transfer response is described by the familiar Gaussian bell-shaped curve. In the case of low-pass filters, only the upper half of the curve describes the filter. The use of gaussian filters is a move toward achieving the dual goal of reducing lag and reducing the lag of high-frequency components relative to the lag of lower-frequency components.
A gaussian filter with...
one pole is equivalent to an EMA filter.
two poles is equivalent to EMA ( EMA ())
three poles is equivalent to EMA ( EMA ( EMA ()))
and so on...
For an equivalent number of poles the lag of a Gaussian is about half the lag of a Butterworth filters: Lag = N * P / (2 * ¶2), where,
N is the number of poles, and
P is the critical period
Special initialization of filter stages ensures proper working in scans with as few bars as possible.
From Ehlers Book: "The first objective of using smoothers is to eliminate or reduce the undesired high-frequency components in the eprice data. Therefore these smoothers are called low-pass filters, and they all work by some form of averaging. Butterworth low-pass filtters can do this job, but nothing comes for free. A higher degree of filtering is necessarily accompanied by a larger amount of lag. We have come to see that is a fact of life."
References John F. Ehlers: "Rocket Science For Traders, Digital Signal Processing Applications", Chapter 15: "Infinite Impulse Response Filters"
Included
Loxx's Expanded Source Types
Signals, zero or signal crossing, signal crossing is very noisy
Alerts
Bar coloring
EMA 21 + MacD + RSI + Alma
Setting
EMA 21 = Green
EMA 9 = yellow
MacD = 5 35 5
RSI = 10
Alma 20 0.8 8
RULES
Long:
1. EMA 9 below 21
2. RSI above 50 from Oversold
3. Macd Solid green
4. SL @ ALMA
5. Conditional buy limit order @ top wick
6. 1:3 RR
Short:
1. EMA 9 above 21
2. RSI below 50 from Overbought
3. Macd Solid red
4. SL @ ALMA
5. Conditional sell limit order @ bottom wick
6. 1:3 RR
Stochastic MACDStochasticMACD (SMACD) is an oscillating momentum indicator. It is based on MACD but run through a stochastic oscillator.
This results in an indicator with all the same properties as MACD but with the benefit that the absolute levels can be compared to history values.

Data Trader Stoch | RSI | MACD Strategy IndicatorImplementation of Data Trader's strategy, described in the youtube video, "Highly Profitable Stochastic + RSI + MACD Trading Strategy (Proven 100x)"
Also see Algovibes' video, "Highly Profitable Stochastic + RSI + MACD Trading Strategy? Testing Data Traders strategy in Python"
Note: Despite the claims, it generates barely, if any, signals, certainly in the crypto markets
If there are any mistakes, give feedback in the comments, and I'll fix
### Strategy Summary ###
# Long Signals #
Stoch K and D are oversold
RSI above midline
MACD above signal line
# Short Signals #
Stoch K and D are overbought
RSI below midline
MACD below signal line
# Stop loss and Take Profit #
Stop loss
Longs: below last swing low
Shorts: above last swing high
Take profit at 1.5x stop loss
Forex scalper 2xEMA + SRSI + MACDThis is a forex scalping strategy designed for the most liquid pairs, like major forex pairs.
Its made of
1 EMA 50
1 EMA 100
Stochastic RSI
MACD
Rules
For long :close of the candle is above moving average 50, moving average 50> moving average 100, macd histogram is positive and cross over of stochastic rsi with the oversold level.
For short :close of the candle is below moving average 50, moving average 50 < moving average 100, macd histogram is negative and cross under of stochastic rsi with the overbought level.
Exit
For exit we have take profit and stop loss using fixed pip points.
For this example on EURUSD we use 20 pips for both tp and sl
IF you have any questions let me know !

RSI & MACDThis indicator presents standart RSI and MACD indicators in a single indicator. The appearances of these indicators have been modified a little bit and squeezed into one window. To overcome the scale problem the MACD values has expanded with 1000 and divided by the current price to use both indicators in the same scale. Original values could be determined from there. Original Tradingview codes have been used to get full control of graphs.
Bu indikatör RSI ve MACD gösterfgelerini tek bir indikatörde sunuyor. İndikatörlerin görünüşleri bir miktar modifiye edilip iki indikatörğn tek bir pencereden takip edilmesine olanak sağlanmıştır. İki indikatördeki farklı ölçek kullanımından ortaya çıkan ölçek sorunu MACD değerlerinin 1000 ile genişletilip, ürünün güncel fiyatına bölünmesiyle giderilmiştir. Her iki indikatiör için de orjinal Tradingview kodları kullanılmıştır.

rsi and macdRSI and MACD in the chart:
- small circles -> oversold/overbought
- big circles -> oversold/overbought rising/falling
- small diamonds -> macd over/under signal with macd over/under zero
Please comment if you have an idea to improve it ;)
ADX Momentum cross + MacD + HH LL + Buy/Sell Signals and alerts Hello, This is the first indicator I have made and would like to contribute to the community.
This strategy came from trying to replicate a previous ADX Cross Indicator that I loved on MT4 which I used successfully on EUR/USD on high and low time frames. Through the process of trying to replicate it I failed, I decided to take what I had written so far and create my own ADX cross strategy using the combination of 3 ADX's, their lag. Then also using Higher highs and lower lows with the MacD to further filter the signals.
There are two buy and two sell conditions , the difference between these are just the order in which the ADX crossing determines the entry. The MacD and higher highs and lower lows are the same for filtering the signal.
You can change the look back for HH and LL look back range, along with the DI Length & ADX Smoothing for all ADX's. The lag used for either the buy or sell strategy with the Lag_Buy/Lag_Sell inputs. Lag_mid setting will affect all 4 conditions.
From testing and based on the ADX cross logic you should follow this structure when changing the inputs for:
DI Length: Lowest DI value (I.E. 1)
DI Lengtha: Middle DI value (I.E. 2)
DI Lengthb: Highest DI value (I.E. 3)
ADX Smoothing: Lowest Smoothing value (I.E. 1)
ADX Smoothinga: Middle Smoothing value (I.E. 2)
ADX Smoothingb: Highest Smoothing value (I.E. 3)
I tested this on the EUR/USD, but mainly I have been using it on BTC/USDT(binance) and BTC/USDT Perpetual futures(binance) with the 5 minute chart. I suggest playing around with the settings depending on the Symbol and timeframe you use because the default settings are what I last found to be optimal for my self on the 5min BTC/USDT Perpetual futures(binance) chart.
A good starting point I found when using the indicator on other charts is to use the below values:
DI Length: 7
DI Lengtha: 14
DI Lengthb: 21
ADX Smoothing: 7
ADX Smoothinga: 14
ADX Smoothingb: 21
If you have any questions, suggestions, or requests for this indicator feel free contact me. You can either comment on here or Message me
If you like this indicator please like and comment where you found it useful.
