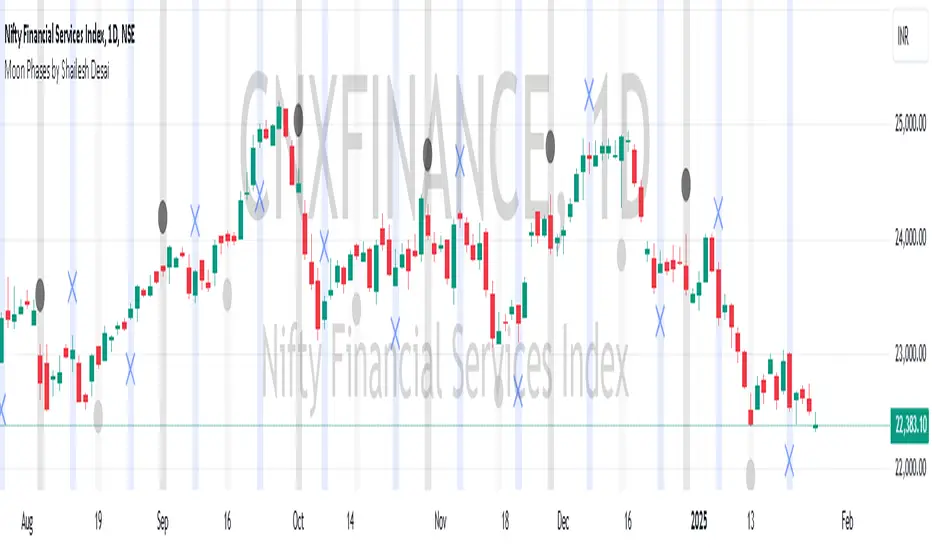
Moon Phases by Shailesh DesaiTrading Strategy Based on Lunar Phases
This custom trading indicator leverages the power of lunar cycles to provide unique market insights based on the four primary moon phases: New Moon, First Quarter, Full Moon, and Third Quarter. By aligning your trades with the natural rhythm of the moon, this strategy offers a different perspective to trading and can help enhance decision-making based on the cyclical nature of the market.
Key Features:
1. Moon Phase Identification:
o The indicator automatically identifies the current moon phase based on the user's selected timeframe and marks it on the chart.
o Each phase is visualized with a specific symbol and color to help traders easily recognize the current moon phase:
New Moon/Waxing Moon: Represented by a circle (colored as per user input).
First Quarter: Represented by a cross (colored as per user input).
Full Moon/Waning Moon: Represented by a circle (colored as per user input).
Third Quarter: Represented by a cross (colored as per user input).
2. Automatic Moon Phase Transition Detection:
o The indicator tracks and highlights when a phase change occurs. This feature ensures you are always aware of when the market moves from one phase to another.
o Moon phase changes are only visualized on the first bar of each new phase to avoid cluttering the chart.
3. Background Color Indicators:
o The background color dynamically changes according to the current moon phase, helping to reinforce the phase context for the trader. This feature makes it easy to see at a glance which phase the market is in.
4. Customizable Appearance:
o Customize the color of each moon phase to suit your preferences. Adjust the colors for the New Moon, First Quarter, Full Moon, and Third Quarter to align with your visual strategy.
5. Avoids Unsupported Timeframes:
o This indicator does not support monthly timeframes, ensuring that it operates smoothly only on timeframes that are compatible with the lunar cycle.
How to Use:
• The moon phases are thought to have an influence on human behavior and the market's psychology, making this indicator useful for traders who wish to integrate lunar cycles into their strategy.
• Traders can use the phase changes as an indicator of potential market momentum or reversal points. For example:
o New Moon may indicate the beginning of a new cycle, signaling a potential upward or downward move.
o Full Moon might suggest a peak or significant shift in market direction.
o First Quarter and Third Quarter phases may represent moments of consolidation or decision points.
Ideal for:
• Traders interested in cycle-based strategies or looking to experiment with new approaches.
• Those who believe in the influence of natural forces, including moon phases, on market movements.
• Technical analysts who want to add another layer of insights to their chart analysis.
Important Notes:
• The indicator uses precise astronomical calculations to identify the correct phase, ensuring accuracy.
• It’s important to understand that moon phase-based trading is not a standalone strategy but should ideally be combined with other technical analysis tools for maximum effectiveness.
在腳本中搜尋"Moon Phases"
Moon Phases Strategy [LuxAlgo]Trading moon phases has become quite popular among traders, believing that there exists a relationship between moon phases and market movements. This strategy is based on an estimate of moon phases with the possibility to use different methods to determine long/short positions based on moon phases.
Note that we assume moon phases are perfectly periodic with a cycle of 29.530588853 days (which is not realistically the case), as such there exists a difference between the detected moon phases by the strategy and the ones you would see. This difference becomes less important when using higher timeframes.
Settings
New Moon Reference Date: Date of a new moon to be used as starting point for the cycle calculation. Buy: Determine the condition to be used to open a long position Sell: Determine the condition to be used to open a short position
Description
The strategy can use different buy/sell conditions, these are determined in the Buy/Sell settings drop-down menu.
By default, the strategy goes long on a new moon and short on a full moon. This setup is common since full moons are said to be related to depressed mood. However, it is possible to use inverse conditions.
Users can also go long on higher moons (new moons or full moons occurring at a price that is higher than the previous one when a new/full moon occurred) and short on lower moons, this would return a trend following strategy, using the inverse conditions (buy lower moons/sell higher moons) would return a contrarian strategy.
The above chart displays the strategy using default conditions.
The above chart displays the strategy of going long on a higher moon and selling on a lower moon.
Quick Summary
We provide a quick summary of the strategy using default conditions (buy on a new moon, sell on a full moon) on various tickers using the 4h timeframe (note that using a lower timeframe would return a backtest executing a lower number of trades).
Constant position sizing is used and no frictional costs are considered.
BTCUSD
The moon phases strategy has been regularly tested with BTCUSD, with traders highlighting how moon phases tend to occur during tops/bottoms. We test the strategy from 2019-01-06 00:00.
Net Profit: $68544.86 Closed Trades : 67 % Profitability : 50.75 Max Drawdown : $18541.24 Max
TSLA
The strategy is tested from 2011-01-04 14:30
Net profit: $349.17 Closed Trades : 265 % Profitability : 54.34 Max Drawdown : $262.72
EURUSD
The strategy is tested from 2018-01-16 14:00.
Net profit: $-0.18 Closed Trades : 91 % Profitability : 50.55 Max Drawdown : 0.36

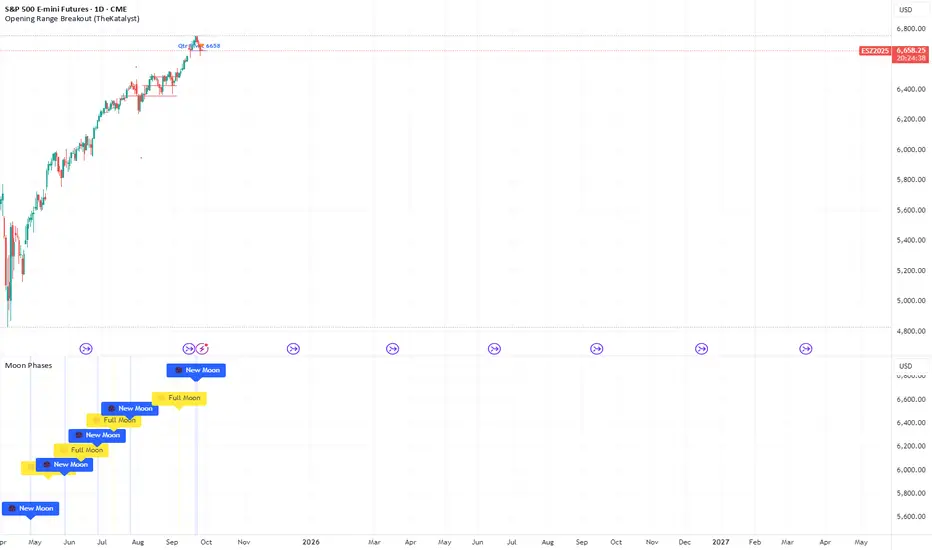
Moon Phases + Daily, Weekly, Monthly, Quarterly & Yearly Breaks█ Moon Phases
From LuxAlgo description.
Trading moon phases has become quite popular among traders, believing that there exists a relationship between moon phases and market movements.
This strategy is based on an estimate of moon phases with the possibility to use different methods to determine long/short positions based on moon phases.
Note that we assume moon phases are perfectly periodic with a cycle of 29.530588853 days (which is not realistically the case), as such there exists a difference between the detected moon phases by the strategy and the ones you would see. This difference becomes less important when using higher timeframes.
█ Daily, Weekly, Monthly, Quarterly & Yearly Breaks
This indicator marks the start of the selected periods with a vertical line that help with identifying cycles.
It allows to enable or disable independently the daily, weekly, monthly, quarterly and yearly session breaks.
This script is based on LuxAlgo and kaushi / icostan scripts.
Moon Phases Strategy
Year/Quarter/Month/Week/Day breaks
Month/week breaks

Moon Phases & Declinations - Chronos Capital [BETA]High-Precision Lunar Cycles: Moon Phases & Declinations (Swiss Ephemeris)
Overview
This indicator provides institutional-grade astronomical data directly on your chart. Unlike standard scripts that use basic sine-wave approximations, this tool implements the **Swiss Ephemeris algorithm**, the gold standard for high-precision celestial calculations.
By tracking the Moon’s phases and its **Maximum/Minimum Declinations**, traders can identify potential "turning points" or "energy shifts" in market volatility often associated with lunar cycles.
---
Key Features
Ultra-High Precision: Calculations are accurate to within *seconds* of time, ensuring that the visual plot aligns perfectly with astronomical reality.
Moon Phase Tracking: Distinct markers for New Moon, Full Moon, and Quarters.
Lunar Declination Peaks: Automatically identifies when the moon reaches its *Maximum North* and *Maximum South* points (Lunar Extremes).
Customizable Visuals: Toggle between background highlights, vertical lines, or plot signals to suit your trading style.
---
Technical Accuracy
This script is built using a ported version of the Swiss Ephemeris
Positional Accuracy: Within 0.1 arcseconds.
Time Accuracy: Within **~1-2 seconds** of official JPL data.
Algorithm: Integration of the *ELP2000-85* lunar theory for maximum reliability over decades of historical data.
---
### **How to Use**
1. **Reversal Zones:** Watch for the Moon’s *Max/Min Declination* points, which often coincide with local tops or bottoms in trending markets.
2. **Volatility Shifts:** Use the *New Moon* and *Full Moon* markers to anticipate periods of increased or decreased market liquidity and volume.
3. **Confluence:** Best used in combination with your existing price action or momentum indicators to add a "time-based" filter to your entries.
*Disclaimer: This tool is for educational and analytical purposes only. Lunar cycles are a study of time-based correlation, not a guaranteed financial signal.*

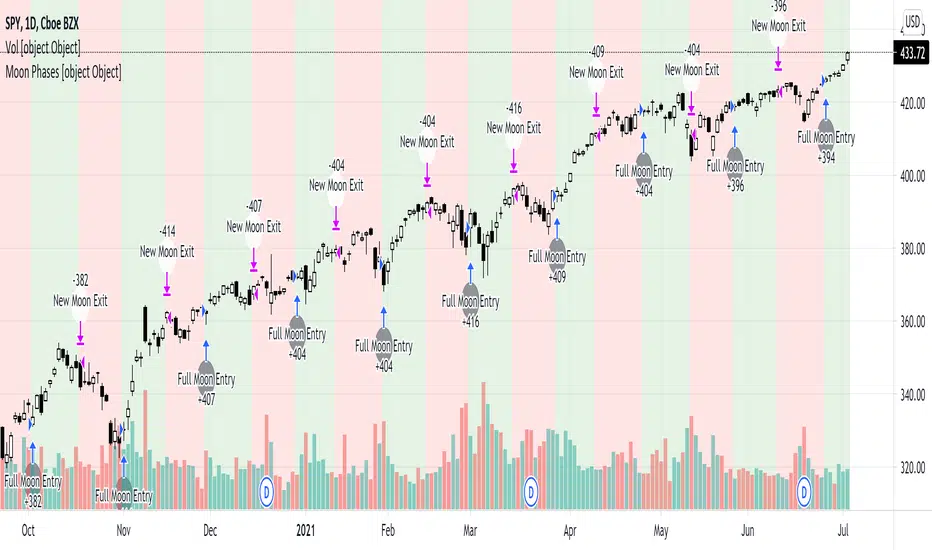
Moon Phases Strategy 2015 till 2021Moon Phases Strategy
Thank you to Author: Dustin Drummond for allowing me to use his Moon Phase strategy code and modify it. I wanted to test out the accuracy of the moon phase. And I could not have done it without his code
It was created to test the Moon Phase theory compared to just a buy and hold strategy.
It buys on full Moon and sells on the new moon. I also have added the ability to add stop loss and target profit if anyone wants to tinker with it. This strategy uses hard-coded dates from 1/1/2015 until 12/31/2021 only! Any dates outside of that range need to be added manually in the code or it will not work.
I may or may not update this so please don't be upset if it stops working after 12/31/2021.
Feel free to use any part of this code and please let me know if you can improve on this strategy.
Result:
50% accurate using data from 2015 till today.
I find a buy and hold strategy to have outperformed the moon phase.
It does have its value. It might be used as a confluence with other established indicators.

Moon Phases Long/Short StrategyThis is an experiment of Moon Phases, likely buy when full moon and sell when new moon with few changes, like it would buy a day ahead or sometimes sell a day post these events, with Stop loss and take profits, 50% profitable so sounds good to me
Long only good for bitcoin gold, both modes(L+S) better for stocks and alt coins

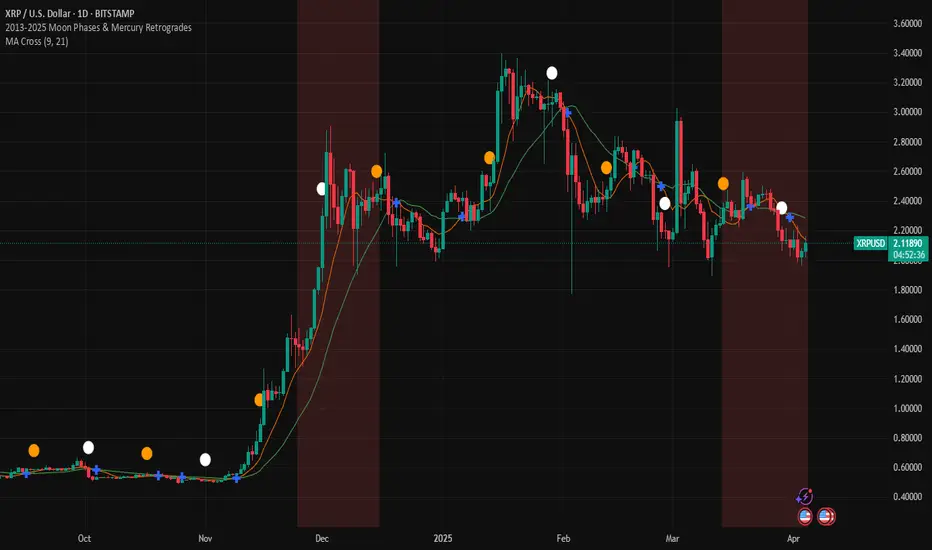
2013-2025 Moon Phases & Mercury RetrogradesIndicator Description: 2013-2025 Moon Phases & Mercury Retrogrades
This Pine Script (version 5) indicator overlays key astrological events on a TradingView chart, specifically tracking full moons, new moons, and Mercury retrograde periods from 2013 to 2025. It is designed to help traders and astrology enthusiasts visualize these celestial events alongside price action, potentially identifying correlations or patterns.
Features:
New Moons:
Visualization: Plotted as small white circles above the price bars.
Data: Includes 156 specific new moon dates from January 11, 2013, to December 20, 2025.
Purpose: Marks the start of the lunar cycle, often associated with new beginnings or shifts in energy.
Full Moons:
Visualization: Plotted as small orange circles above the price bars.
Data: Includes 157 specific full moon dates from January 27, 2013, to December 15, 2025.
Purpose: Highlights the peak of the lunar cycle, often linked to heightened emotions or market volatility in astrological analysis.
Mercury Retrogrades:
Visualization: Displayed as a light red background highlight across the chart.
Data: Covers 39 Mercury retrograde periods, with precise start and end timestamps from February 23, 2013, to November 29, 2025.
Purpose: Indicates periods traditionally associated with communication issues, delays, or reversals, which some traders monitor for potential market impacts.
Technical Details:
Overlay: The indicator is set to overlay=true, meaning it displays directly on the price chart rather than in a separate pane.
Date Matching: Uses a helper function is_date(y, m, d) to check if the current chart date matches any of the predefined event dates, leveraging TradingView's year, month, and dayofmonth variables.
Visualization Methods:
plotshape: Used for new moons (white circles) and full moons (orange circles), positioned above bars for clear visibility.
bgcolor: Used for Mercury retrograde periods, applying a semi-transparent red highlight (transparency level 85) to the background during active retrograde periods.
Time Range: Spans from January 2013 to December 2025, providing a comprehensive 13-year view of these astrological events.
Usage:
Add the script to your TradingView chart to see new moons, full moons, and Mercury retrograde periods overlaid on your chosen symbol and timeframe.
The white and orange circles appear on specific dates, while the red background highlights extend across the duration of each Mercury retrograde period.
Useful for traders incorporating astrology into their analysis or anyone interested in tracking these celestial events alongside financial data.
Notes:
The script assumes accurate date data as provided; users should verify dates against astronomical sources if precision is critical.
The transparency of the Mercury retrograde background can be adjusted by modifying the value in color.new(color.red, 85) (0 = fully opaque, 100 = fully transparent).
Best viewed on daily or higher timeframes for clarity, though it works on any timeframe supported by TradingView.
This indicator provides a visual tool to explore the potential influence of lunar phases and Mercury retrograde periods on market behavior, blending astrology with technical analysis in a clear, customizable format.
[astropark] Moon Phases [alarms]Dear Followers,
today I'm glad to present you an indicator which calculates Moon Phases and let's you set an alert over it.
This is a public free indicator based on the public one by @paaax:
I added my usual alert system logic, plus some more customization inputs for easy coloring.
The lower the timeframe you use it and set your alerts on, the more precise the alert value you get.
Here below the script for backtesting it:
Enjoy!
-- astropark

Simple Moon Phases StrategySimple Moon Phases Strategy
This strategy is very basic and needs some filters to improve results. It was created to test the Moon Phase theory compared to just a buy and hold strategy and it did not beat the buy and hold. However, if you flip the entry and exit signals to the opposite signals it performs a lot worse, so there might be some validity to the Moon Phases having an effect on the markets. I might try to add some filters and increase hold times with trailing stops in a separate version.
WARNING: This strategy uses hard-coded dates from 1/1/2015 until 12/31/2021 only! Any dates outside of that range need to be added manually in the code or it will not work. I may or may not update this so please don't be upset if it stops working after 12/31/2021.
Feel free to use any part of this code and please let me know if you can improve on this strategy.
[astropark] Moon Phases [strategy]Dear Followers,
today I'm glad to present you an indicator which calculates Moon Phases and let's you backtest the simplest strategy over it: buy/sell on full moon and do the opposite on new moon.
This is a public free indicator based on the public one by @paaax:
I added my usual backtesting logic, plus some more customization inputs for easy coloring.
The lower the timeframe you backtest on, the more backtesting data are effective.
Enjoy!
-- astropark

Moon Phases/Apogee & Perigee/Eclipses/North Node by BTThis script helps us to display date of different lunar properties on price chart. Simply following items could be used to see dates.
New moon
Full moon
Apogee
Perigee
North node
I've used following web site (fourmilab.ch) for obtaining exact dates, according to web site "All dates and times are Universal time (UTC); to convert to local time add or subtract the difference between your time zone and UTC"

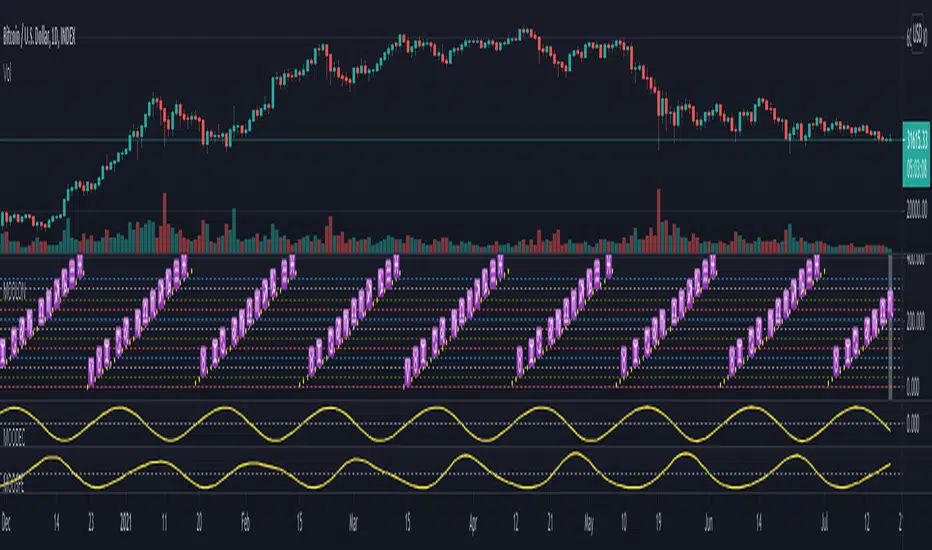
Gann Astronomical Turning PointsThis is a comprehensive Pine Script that implements W.D. Gann's astronomical theories to identify potential market turning points. Here's a detailed breakdown of the script:
Overview
The script identifies and displays astronomical events (sun angles, moon phases, and Mercury retrogrades) that Gann theorists believe correlate with market turning points. It also analyzes historical price performance following these events to provide statistical significance.
Key Components
1. Input Parameters
Date Range: Users can set the analysis period (start and end dates)
Display Options: Toggle visibility of different astronomical events and tables
Analysis Settings: Configure the lookback period for price change analysis (1-20 days)
2. Astronomical Calculations
The script includes several functions to calculate celestial positions:
getDaysSinceEpoch(t): Calculates days since January 1, 2000 (reference point)
getSunLongitude(t): Computes the Sun's position in the ecliptic (0-360°)
getMoonPhase(t): Determines the Moon's phase angle relative to the Sun
getMercuryLongitude(t): Calculates Mercury's position in the ecliptic
3. Gann Critical Angles (Sun Events)
The script identifies when the Sun reaches four critical angles that Gann considered significant:
0° Aries (Spring Equinox)
90° Cancer (Summer Solstice)
180° Libra (Fall Equinox)
270° Capricorn (Winter Solstice)
These are detected by tracking when the Sun's longitude crosses these specific angles.
4. Moon Phases
Four key moon phases are identified:
New Moon: Moon passes between Earth and Sun
First Quarter: Moon is 90° east of Sun
Full Moon: Moon is opposite the Sun
Last Quarter: Moon is 270° east of Sun
5. Mercury Retrograde Periods
The script detects when Mercury appears to move backward in its orbit:
Identifies start and end dates of retrograde motion
Displays these periods as highlighted zones on the chart
6. Price Change Analysis
For each astronomical event, the script:
Calculates the percentage price change over a user-defined lookback period
Categorizes changes as positive or negative
Stores this data for statistical analysis
7. Statistical Significance
The script calculates several metrics for each event type:
Average Price Change: Mean percentage change following events
Up/Down Ratio: Number of positive vs. negative changes
Accuracy Percentage: How often the dominant direction occurred
8. Visual Elements
The script includes multiple display components:
Event Labels
Sun Angles: Orange sun symbols displayed above price bars
Moon Phases: Moon phase emojis displayed below price bars
Mercury Retrograde: Red boxes highlighting the retrograde periods
Information Tables
Events Table: Shows upcoming and recent astronomical events
Significance Analysis Table: Displays statistical performance of each event type
Forecast Section: Identifies the next upcoming event and predicted direction
9. Forecasting Functionality
The script predicts market direction for the next astronomical event based on:
Historical average price change for that event type
Statistical accuracy of previous similar events
Color-coded forecast (green for bullish, red for bearish)
This script offers an interesting implementation of Gann's astronomical theories, but should be used as part of a broader analysis rather than as a standalone trading system.
Disclaimer: This indicator is for educational purposes only. Past performance does not guarantee future results. Always conduct your own research and risk assessment before trading.

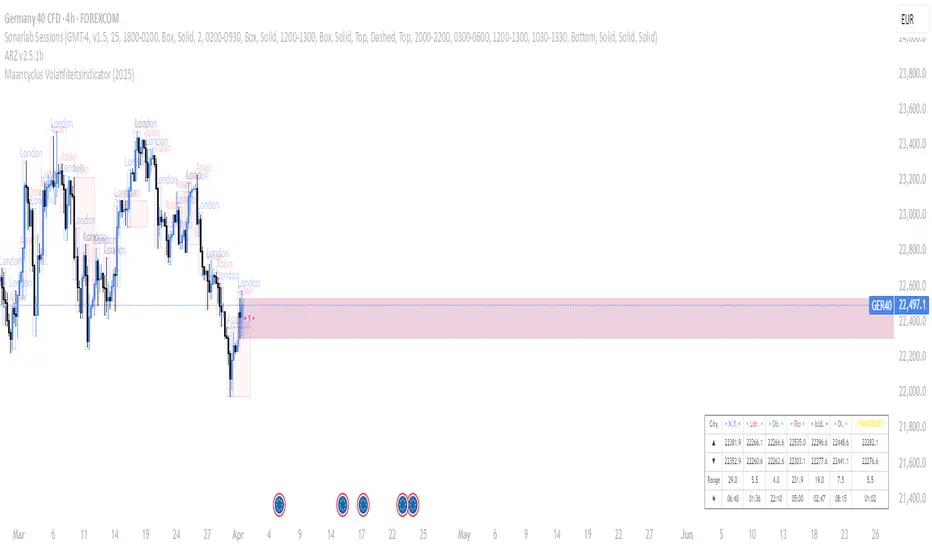
Maancyclus Volatiliteitsindicator (2025)This Moon Cycle Volatility Indicator for TradingView is designed to help traders track and analyze market volatility around specific lunar phases, namely the Full Moon and New Moon. The indicator marks the dates of these moon phases on the chart and measures volatility using the Average True Range (ATR) indicator, which gauges market price fluctuations.
Key Features:
Moon Phase Markers: The indicator marks the Full Moon and New Moon on the chart using labels. Blue labels are placed below bars for Full Moons, while red labels are placed above bars for New Moons. These markers are based on a manually curated list of moon phase dates for the year 2025.
Volatility Calculation: The indicator calculates market volatility using the ATR (14), which provides a sense of market movement and potential risk. Volatility is plotted as histograms, with blue histograms representing volatility around Full Moons and red histograms around New Moons.
Comparative Analysis: By comparing the volatility around these moon phases to the average volatility, traders can spot potential patterns or heightened market movements. This can inform trading strategies, such as anticipating increased market activity around specific lunar events.
In essence, this tool helps traders identify potential high-volatility periods tied to lunar cycles, which could impact market sentiment and price action.
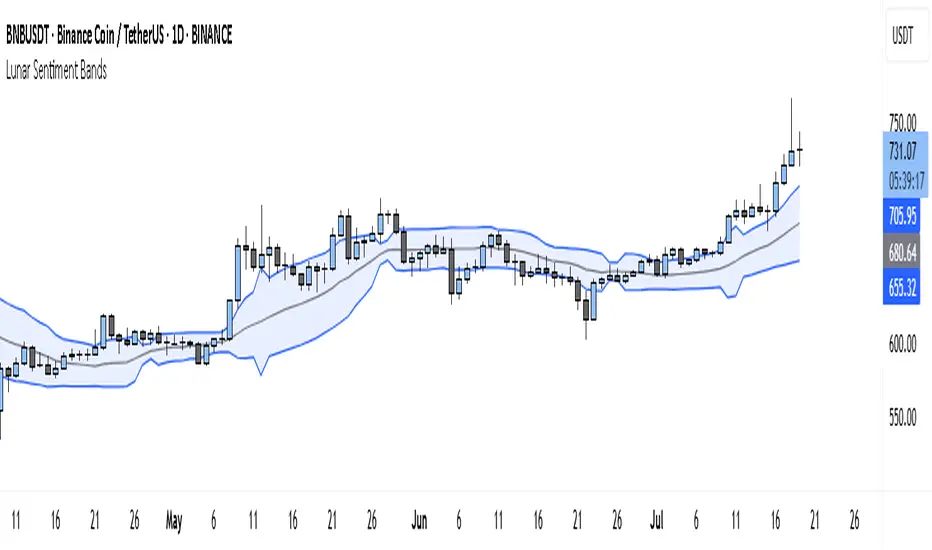
Lunar Sentiment BandsThe Lunar Sentiment Bands indicator is designed to combine simple price volatility analysis with the timing of moon phases. It's based on a moving average and two bands above and below it—similar to Bollinger Bands. But unlike regular bands, the width of these adjusts dynamically depending on two key conditions: the moon phase and market volume.
Around Full Moons, markets often show emotional or volatile behavior. If there's also a surge in trading volume during that time, the indicator automatically expands the bands. This tells you the market might be gearing up for a breakout or high-energy move.
Around New Moons, things are typically quieter. If there’s no significant volume, the indicator contracts the bands. This reflects a calmer environment or a potential “coil” where price is building up energy.
Traders can use this shifting bandwidth to guide decisions. Wide bands suggest breakout potential—either to join the move or to stand back until direction becomes clearer. Narrow bands suggest you may want to trade reversals, or simply wait for volatility to return before entering a position.
This approach doesn't try to predict direction. Instead, it gives you a sense of when the market is most likely to become active or stay quiet, using the rhythm of the moon and real-time volume to shape that view.
Financial Astrology Moon LongitudeMoon energy represent the masses, crowds, public places, children and emotions. The transit of the Moon through the zodiacal signs will color the crowd emotional responses that fluctuate based on the elemental qualities of the signs: fire (energetic and impulsive), earth (rigid, static, patient), water (assimilation, transformation, humor fluctuations), air (expansion, fervent, germination).
The daily average speed of the Moon is 13 degrees, for this reason the emotional elemental energy is transforming in average every 2 days and few hours, this mood fluctuations produces the short term instinctive and emotional actions performed by traders that forget the precise mathematical / statistical approach in favor of irrational and emotional impulses.
Based on statistical buy/sell frequency analysis we discovered that for BTC-USD, the Moon is usually bullish in zodiac signs: Aries, Libra, Scorpio, Aquarius and Pisces, the most relevant bullish sign is "Aquarius", from 206 observations in all the BTC-USD price history where Moon was in this sign the 60% of those days the price increased compared to the previous day. The bearish zodiac signs for BTC-USD are: Taurus, Cancer, Leo, Sagittarius and Capricorn, the most relevant bearish sign is "Capricorn".
Interestingly this zodiac sign locations tends to fluctuate during some periods of time and from the last 10 observations of the Moon transiting through Aries we noted that 7 of the 10 observations coincide with a dip, sometimes the Moon in Aries indicate the reversal of the short term trend, this is kind of expected considering that when Moon approaches Taurus the fall becomes more likely due to the fact that Moon in Taurus is a bearish signal.
With this indicator there is unlimited possibilities to explore across different markets and complementing with Moon phases this may be the perfect financial astrology indicator for those intraday traders that keep positions only for few hours.
We encourage you to analyze the Moon zodiac sign cycles in different markets and share with us your observations, leave us a comment with your research outcomes. Happy trading!
Note: The Moon longitude indicator is based on an ephemeris array that covers years 2010 to 2030, prior or after this years the longitude is not available, this daily ephemeris are based on UTC time so in order to align properly with the price bars times you should set UTC as your chart reference timezone.
Gamification IndicatorDo you want your charts to look like a video game? Look no further! Would you rather be an alien racing through a lava tube, a surfer with great white sharks, an airplane flying through the clouds, or some other custom emoji setup of your choice? Traders can choose their own custom player emoji, trend indicator, obstacle emoji, and celestial emoji. This indicator is just for fun and is not intended to be used when making trading decisions. Enjoy!
This indicator also contains a live sun/moon emoji that should accurately reflect day/night and can give information about the current moon phases.
Shoutout to @citlacom for the public Moon Ephemeris and calculations. Building this indicator was a useful & fun introduction to financial astrology in Pinescript.

Lunar Cycles Projected Forward; Moon phases into futureProjecting Lunar Cycles/ half-cycles forward in time
User sets the recent Full moon in history to anchor from; Indicator projects 1/2 cycles forward in time
//inputs//
-input number of full lunar cycles to project forward from input full moon time
-choose color/opacity/border color/text display
