BTC CME Gap – detector & single signals# BTC CME Gap — Detector & Single Signals (Pine v5)
**What it does**
This indicator finds the **weekend gap** on **CME Bitcoin futures** and turns it into a clean, tradable object:
* Draws a **gap zone** (Friday close ↔ Monday open) as a right-extending box.
* Fires **one-time signals** per gap:
* **ENTER** – first touch of the gap zone by price.
* **FILL** – gap is considered filled when price tags **Friday’s close**.
It works on any BTC chart (spot or futures). The gap itself is calculated from **CME\:BTC1!** daily data.
---
## How it works
1. Pulls **daily** `open`/`close` from `CME:BTC1!` (`request.security`, no lookahead).
2. On **Monday**, compares Monday **open** with previous **Friday close**:
* If different → a **gap** exists.
3. Defines the zone:
* `gapTop = max(MonOpen, FriClose)`
* `gapBot = min(MonOpen, FriClose)`
4. Renders a box + boundary lines, **extending right** until price action resolves it.
5. Signals:
* **ENTER**: the first bar that **enters** the gap zone.
* **FILL**: first bar that **touches Friday close** (gap completion).
6. Each new Monday gap **replaces** the previous box and signals.
---
## Inputs
* **CME symbol** (default `CME:BTC1!`)
* **Gap timeframe** (default `D`)
* **Colors** for the box and edges
---
## Plot & Signals
* **Box** = visual gap zone (transparent fill, outlined).
* **ENTER** = triangle up below bar.
* **FILL** = triangle down above bar.
* Optional label prints **Top / Bottom / Fill** levels.
---
## Notes on behavior
* Uses `barmerge.lookahead_off` and daily aggregation, so the gap definition **does not repaint** once Monday’s daily bar is confirmed.
* Signals are **single-shot** per gap (no clutter).
* Works on any chart timeframe; the gap logic always references **CME daily**.
---
## Practical use
* Track obvious **“magnets”** for mean-reversion, stop-runs, or liquidity grabs.
* Combine with your higher-timeframe bias (e.g., **1D trend filter**) and execution on **4H/1H**.
* Typical outcomes: quick Monday fill, staged fill after partial rejection, or delayed fill during later consolidation.
---
## Customization ideas
* Add `alertcondition(enterSignal, …)` / `alertcondition(fillSignal, …)` for automation.
* Gate trades with trend filters (EMA/SMA, Kernel regression, ADX) or session tools (VWAP/POC).
* Persist multiple historical gap boxes if you want to track **unfilled** gaps.
---
**Credits**: Built for BTC CME weekend gaps; minimal, publication-ready visualization with single-event signals to keep charts clean.
在腳本中搜尋"N+credit最新动态"

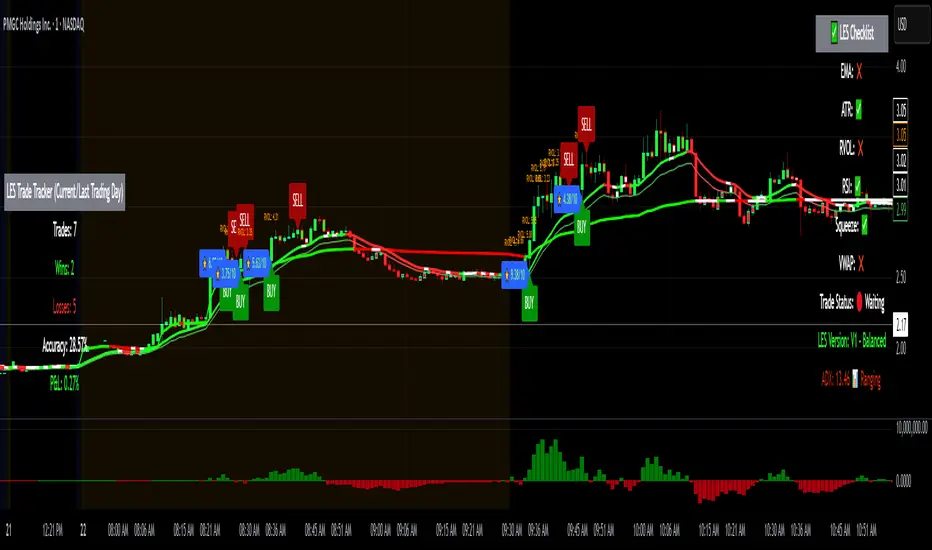
Long Elite Squeeze (LES) — H.H 22 Lindsay (AI)LES (Long Elite Squeeze)
LES (Long Elite Squeeze) is a trading framework designed to capture the highest-probability long setups. It’s not just another signal script — it’s a structured system built to filter noise, manage risk, and keep you aligned with real momentum.
🔹 Core Logic
Breakout Confirmation – Ensures moves have structure, not just random spikes.
Relative Volume (RVOL) – Confirms participation and fuel behind the move.
RSI Alignment – Avoids overextended traps and fakeouts.
Squeeze Momentum – The backbone of LES. Signals fire only after a defined squeeze pattern shift (6+ dark green bars followed by a light green bar).
🔹 Trade Management Built In
Automated Sell Signals – Trigger on either:
2 consecutive dark green bars on Squeeze Momentum
WaveTrend cross down
(only valid after a Buy signal — no random shorts)
HUD Entry Checklist – Live conditions shown on chart.
Status Tracker HUD – Flips between “Waiting for Entry” and “In Trade” for clear context.
🔹 Flexibility
3 switchable squeeze versions (V1, V2, V3) for different market conditions.
Customizable EMA & ATR settings (with color options).
Session-aware logic — filter signals to prime trading hours.
🔹 Blueprint & Credits
LES is a fusion of proven concepts, standing on the shoulders of respected creators:
-Squeeze Momentum – LazyBear
-WaveTrend Oscillator – LazyBear
-Relative Volume – LonesomeTheBlue
Breakout/structural logic – refined from classic frameworks
Their work laid the foundation — LES expands and integrates them into a complete trading system.
⚡ Why LES Stands Out
LES wasn’t coded overnight. It’s the result of countless hours of live testing, rebuilding, and refining. Every feature earned its place by proving value in real trading, not theory.
LES is more than an indicator. It’s a disciplined framework — crafted to turn chaos into structure, randomness into probability, and noise into clarity.
⚠️ Disclaimer: This is a trading framework, not financial advice. Performance depends on trader discipline, risk management, and market conditions.
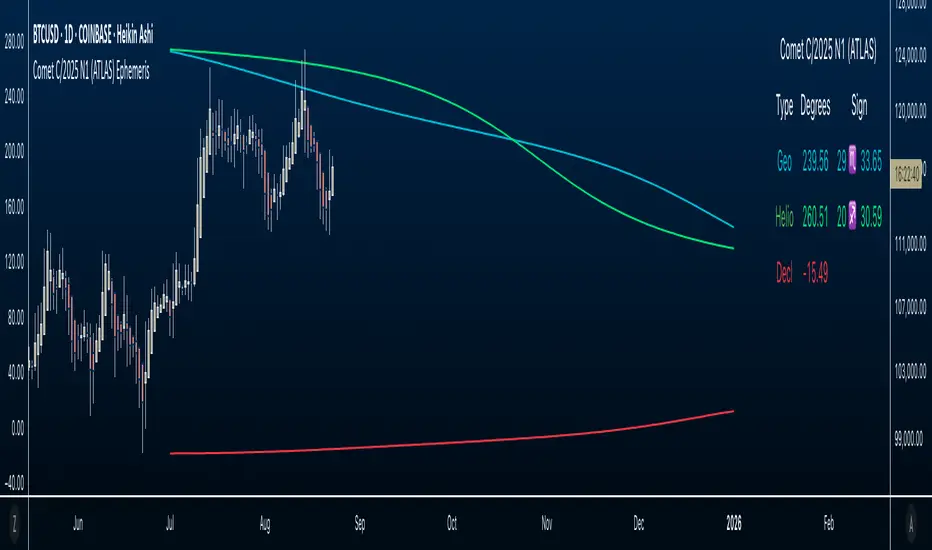
Comet C/2025 N1 (ATLAS) Ephemeris☄️ Ephemeris How-To: Plot JPL Horizons Data on TradingView (Educational)
Overview
This open-source Pine Script™ v6 indicator demonstrates how to bring external astronomical ephemeris into TradingView and plot it on a daily chart. Using Comet C/2025 N1 (ATLAS) as an example dataset, it shows the mechanics of structuring arrays, indexing by date, and drawing past and forward ( future projections ) values—strictly as an educational visualization of celestial motion.
Why This Approach
Data is generated from NASA JPL Horizons, a mission-grade, publicly available ephemeris service ( (ssd.jpl.nasa.gov)). On the daily timeframe, Horizons provides high-precision positions you can regenerate whenever solutions update—useful for educational accuracy in exploring orbital data.
What’s Plotted
- Geocentric ecliptic longitude (Earth-view)
- Heliocentric ecliptic longitude (Sun-centered)
- Declination (deg from celestial equator)
Features
- Simple arrays + date indexing (no per-row timestamps)
- Circles for historical/current bars; polylines to connect forward points, emphasizing future projections
- Toggle any series on/off via inputs
- Daily timeframe enforced (runtime error if not 1D)
- Optional table with zodiac conversion (AstroLib by BarefootJoey)
Data & Updates
The example arrays span 2025-07-01 (discovery date) → 2026-01-01. You can refresh them anytime from JPL Horizons (Observer: Geocentric; daily step; include ecliptic lon/lat and declination) and paste the new values into the script.
How we pulled the ephemeris from JPL Horizons (quick guide):
0) Open ssd.jpl.nasa.gov System
1. Ephemeris Type: Observer Table
2. Target Body: C/2025 N1 (ATLAS) (or any object you want)
3. Observer Location: Geocentric
4. Time Specification: set Start, Stop, Step = 1 day
5. Table Settings → Quantities:
* Astrometric RA & Dec
* Heliocentric ecliptic longitude & latitude
* Observer (geocentric) ecliptic longitude & latitude
6. Additional Table Settings:
* Calendar format: Gregorian
* Date/Time: calendar (UTC), Hours & Minutes (HH:MM)
* Angle format: Decimal degrees
* Refraction model: No refraction / airless
* Range units: Astronomical units (au)
7. Generate → Download results (CSV or text).
8. Use AI or a small script to parse columns (e.g., Obs ecliptic lon, Helio ecliptic lon, Declination) into arrays, then paste them into your Pine script.
Educational Note
This indicator’s goal is to show how to prepare and plot ephemeris—so you can adapt the method for other comets or celestial bodies, or swap in data from existing astro libraries, for learning about astronomical projections using JPL daily data.
Credits & License
- Ephemeris: Solar System Dynamics Group, Horizons On-Line Ephemeris System, 4800 Oak Grove Drive, Jet Propulsion Laboratory, Pasadena, CA 91109, USA.
- Zodiac conversion: AstroLib by BarefootJoey
- License: MIT
- For educational use only.
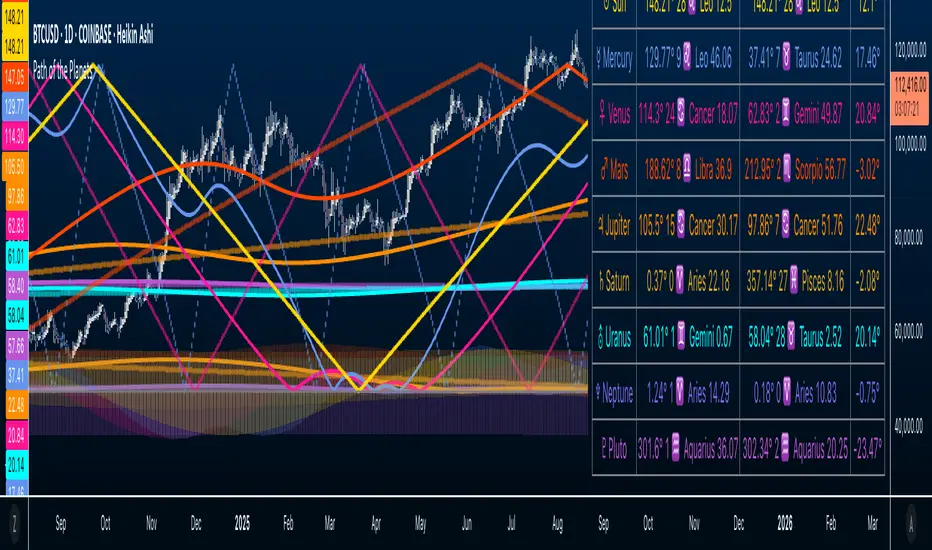
Path of the Planets🪐 Path of the Planets
Path of the Planets is an open-source Pine Script™ v6 indicator. It is inspired by W.D. Gann’s Path of Planets chart, specifically the Chart 5-9 artistic replica by Patrick Mikula "shown below". The script visualizes planetary positions so you can explore possible correlations with price. It overlays geocentric and heliocentric longitudes and declinations using the AstroLib library and includes an optional positions table that shows, at a glance, each body’s geocentric longitude, heliocentric longitude, and declination. This is an educational tool only and not trading advice.
Key Features
Start point: Choose a date and time to begin plotting so studies can align with market events.
Adjustments: Mirror longitudes and shift by 360° multiples to re-frame cycles.
Planets: Toggle geocentric and heliocentric longitudes and declinations for Sun, Mercury, Venus, Earth, Mars, Jupiter, Saturn, Uranus, Neptune, and Pluto. Moon declination is available.
Positions table: Optional color-coded table (bottom-right) with three columns labeled Geo, Helio, and Dec. Values show degrees with the zodiac sign for the longitudes and degrees for declinations.
Visualization: Solid lines for geocentric longitudes, circles for heliocentric longitudes, and columns for declinations. Includes a zero-declination reference line.
How It Works
Converts bar timestamps to Julian days via AstroLib.
Fetches positions with AstroLib types: geocentric (0), heliocentric (1), and declination (3).
Normalizes longitudes to the −180° to +180° range, applies optional mirroring and 360° shifts, and converts longitudes to zodiac sign labels for the table.
Plots and the table update only on and after the selected start time.
Usage Tips
Apply on daily or higher timeframes when studying broader cycles. For degrees, use the left scale.
Limitations at the moment: default latitude, longitude, and timezone are set to 0; aspects and retrogrades are not included; the focus is on raw paths.
License and Credits
Dependency: @BarefootJoey Astrolib
Contributions and observations are welcome.
Advanced RSI — Mark 4 RSI was introduced by J. Welles Wilder Jr. in 1978 in New Concepts in Technical Trading Systems. It measures the velocity of gains vs. losses on a bounded 0–100 scale and popularized the 14-period lookback with 70/30 guide rails for overbought/oversold. Over time, traders added variations (different lengths, thresholds, smoothing, adaptive levels), but the core idea stayed the same: momentum turns often precede price turns.
and i initially started to make minor adjustments for personal use like changing the default to 17 , and using Tradingviews official RSI which comes with a MA embedded. but it was not enough. especially the visuals.
so, for this public release Mark 4 i enhanced RSI by incorporating :
1. Dual-Length Fusion
Two RSI periods (default 17 + 21) blended then lightly smoothed (TEMA by default) → steadier
line without dulling turns.
2. Adaptive OB/OS (ATR-aware) for fewer whipsaws.
3. OB/OS alt solution:
Brief yellow segments appear only at local extremes (default: >72 tops, <32 bottoms) to
emphasize exhaustion without repainting the whole line.
4. Signals you can actually see
Triangle markers for:
Bullish: RSI crossing up through adaptive OS (and still <40 at the cross).
Bearish: RSI crossing down through adaptive OB (and still >60 at the cross).
“Strong Bull/Bear” background nudges appear when momentum is pushing beyond the
bands.
Optional Divergence Tags
and
Tiny diamonds to flag potential bullish/bearish divergences (look-back based).
Info Table (can be hidden)
my Fav feature i included 5 colorways with modern themes.(pls check under INPUTS)
and i made all that to make the indicator visualization look awesome on high end displays.
Credits & acknowledgment
Inspired by the original RSI by J. Welles Wilder Jr. (1978).
Built to be modern, focused, and comfortable for long sessions—especially on dark/OLED displays.
THIS INDICATOR IS MORE THAN ENOUGH BUT I DO HAVE PRIVATE INDICATORS WITH DIFFERENT LOGIC FUNCTIONS.
I'm open for feedback/collaboration.
drsamc.

Relative Volatility Mass [SciQua]The ⚖️ Relative Volatility Mass (RVM) is a volatility-based tool inspired by the Relative Volatility Index (RVI) .
While the RVI measures the ratio of upward to downward volatility over a period, RVM takes a different approach:
It sums the standard deviation of price changes over a rolling window, separating upward volatility from downward volatility .
The result is a measure of the total “volatility mass” over a user-defined period, rather than an average or normalized ratio.
This makes RVM particularly useful for identifying sustained high-volatility conditions without being diluted by averaging.
────────────────────────────────────────────────────────────
╭────────────╮
How It Works
╰────────────╯
1. Standard Deviation Calculation
• Computes the standard deviation of the chosen `Source` over a `Standard Deviation Length` (`stdDevLen`).
2. Directional Separation
• Volatility on up bars (`chg > 0`) is treated as upward volatility .
• Volatility on down bars (`chg < 0`) is treated as downward volatility .
3. Rolling Sum
• Over a `Sum Length` (`sumLen`), the upward and downward volatilities are summed separately using `math.sum()`.
4. Relative Volatility Mass
• The two sums are added together to get the total volatility mass for the rolling window.
Formula:
RVM = Σ(σ up) + Σ(σ down)
where σ is the standard deviation over `stdDevLen`.
╭────────────╮
Key Features
╰────────────╯
Directional Volatility Tracking – Differentiates between volatility during price advances vs. declines.
Rolling Volatility Mass – Shows the total standard deviation accumulation over a given period.
Optional Smoothing – Multiple MA types, including SMA, EMA, SMMA (RMA), WMA, VWMA.
Bollinger Band Overlay – Available when SMA is selected, with adjustable standard deviation multiplier.
Configurable Source – Apply RVM to `close`, `open`, `hl2`, or any custom source.
╭─────╮
Usage
╰─────╯
Trend Confirmation: High RVM values can confirm strong trending conditions.
Breakout Detection: Spikes in RVM often precede or accompany price breakouts.
Volatility Cycle Analysis: Compare periods of contraction and expansion.
RVM is not bounded like the RVI, so absolute values depend on market volatility and chosen parameters.
Consider normalizing or using smoothing for easier visual comparison.
╭────────────────╮
Example Settings
╰────────────────╯
Short-term volatility detection: `stdDevLen = 5`, `sumLen = 10`
Medium-term trend volatility: `stdDevLen = 14`, `sumLen = 20`
Enable `SMA + Bollinger Bands` to visualize when volatility is unusually high or low relative to recent history.
╭───────────────────╮
Notes & Limitations
╰───────────────────╯
Not a directional signal by itself — use alongside price structure, volume, or other indicators.
Higher `sumLen` will smooth short-term fluctuations but reduce responsiveness.
Because it sums, not averages, values will scale with both volatility and chosen window size.
╭───────╮
Credits
╰───────╯
Based on the Relative Volatility Index concept by Donald Dorsey (1993).
TradingView
SciQua - Joshua Danford

Quantum Range Filter by MRKcoin### Quantum Range Filter by MRKcoin
**Overview**
This indicator is a sophisticated range detection tool designed based on the principles of quantitative multi-factor models. Instead of relying on a single condition, it assesses the market from three different dimensions to provide a more robust and reliable identification of range-bound (sideways) markets.
When the background is highlighted in red, it indicates that the market is likely in a range phase, suggesting that trend-following strategies may be less effective, and mean-reversion (range trading) strategies could be more suitable.
---
**Core Logic: A Multi-Factor Approach**
The filter evaluates the market state using the following three independent factors:
1. **Momentum Volatility (RSI Bollinger Bandwidth):**
* **Question:** Is the momentum of the market contracting?
* **Method:** It measures the width of the Bollinger Bands applied to the RSI. A narrow bandwidth suggests that momentum is consolidating, which is a common characteristic of a range market.
2. **Price Volatility (ATR Ratio):**
* **Question:** Is the actual price movement shrinking?
* **Method:** It calculates the Average True Range (ATR) as a percentage of the closing price. A low ratio indicates that the price volatility itself is low, reinforcing the case for a range environment.
3. **Absence of Trend (ADX):**
* **Question:** Is there a lack of a clear directional trend?
* **Method:** It uses the Average Directional Index (ADX), a standard tool for measuring trend strength. A low ADX value provides active confirmation that the market is not in a trending phase.
---
**How to Use**
1. **Range Detection:** The primary use is to identify ranging markets. The red highlighted background serves as a visual cue.
2. **Strategy Selection:**
* **Inside the Red Zone:** Consider using range-trading strategies (e.g., buying at support, selling at resistance, using oscillators like RSI or Stochastics for overbought/oversold signals). Avoid using trend-following indicators like moving average crossovers, as they are prone to generating false signals in these conditions.
* **Outside the Red Zone:** The market is likely trending. Trend-following strategies are more appropriate.
3. **Parameter Tuning (In Settings):**
* **This is the key to adapting the filter to any market or timeframe.** Different assets (like BTC vs. ETH) and different timeframes have unique volatility characteristics. Don't hesitate to adjust the parameters to fit the specific chart you are analyzing.
* **Range Detection Score:** This is the most important setting. It determines how many of the three factors must agree to classify the market as a range. The default is `2`, which provides a good balance.
* If the filter seems **too sensitive** (highlighting too often), increase the score to `3`.
* If the filter seems **not sensitive enough** (missing obvious ranges), decrease the score to `1`.
* **Factor Thresholds:** For fine-tuning, adjust the thresholds for each factor.
* **`RSI BB Width Threshold`:** If you want to detect even tighter momentum consolidations, *decrease* this value.
* **`ATR Ratio Threshold`:** If you want to be stricter about price volatility, *decrease* this value.
* **`ADX Threshold`:** To be more lenient on what constitutes a "trendless" market, *increase* this value (e.g., to 30). To be stricter, *decrease* it (e.g., to 20).
* **Pro Tip:** Use the Debug Table (uncomment it in the script's code) to see the live values of each factor. This will give you a clear idea of how to set the thresholds for the specific asset you are trading.
**Disclaimer**
This indicator is a tool to assist in market analysis and should not be used as a standalone signal for making financial decisions. Always use it in conjunction with your own trading strategy, risk management, and analysis. Past performance is not indicative of future results.
**Credits**
* **Concept & Vision:** MRKcoin

Benford's Law Actual [Tagstrading]Benford’s Law Chart — First Digit Analysis of Percentage Price Drops
This script visualizes the distribution of the leading digit in the percentage change of price drops, and compares it to the theoretical distribution expected by Benford’s Law.
It helps traders, analysts, and quants to detect anomalies, unnatural behavior, or price manipulation in any asset or timeframe.
How to Use
Add to any chart or symbol (stocks, crypto, FX, etc.) and select the timeframe you wish to analyze.
Set the “Number of Bars to Analyze” input (default: 500) to control the length of the historical window.
The chart will display, for the latest window:
A blue line: the actual leading-digit distribution for percentage price changes between bars.
A red line: the expected distribution per Benford’s Law.
Labels below and above: digit markers and the expected (theoretical) percentages.
Summary panel on the right: frequency counts and actual vs. theoretical % for each digit.
Interpretation:
If your actual (blue) curve or digit counts are significantly different from the red Benford’s Law curve, it could indicate unnatural price action, fraud, bot activity, or structural anomalies.
Why is this useful for TradingView?
Financial forensics: Benford’s Law is a classic tool for detecting data manipulation and fraud in accounting. On charts, it can reveal if price movements are statistically “natural.”
Transparency and confidence: Helps communities audit markets, brokers, or exchanges for irregularities.
Adaptable: Works on any market, any timeframe.
What makes this script unique?
Focuses on % price changes, not raw prices.
This provides a fair comparison across assets, symbols, and timeframes.
Measures only the direction and magnitude of drops/rises — more suitable for detecting manipulation in active markets.
Clear and customizable visualization:
The Benford line, actual data, and summary are all visible and readable in one glance.
Optimized for speed and clarity (runs efficiently on all major charts).
How is it different from stg44’s Benford’s Law script?
This script analyzes the leading digit of percentage price changes (i.e., how much the price drops or rises in %),
while the original by stg44 analyzes the leading digit of price itself.
Results are less sensitive to price scale and more comparable across volatile and non-volatile assets.
The summary panel clearly shows ( ) for actual and for Benford theoretical values.
Full code is commented and open for the community.
Credits and Inspiration
This script was inspired by “Benford’s Law” by stg44:
Thanks to the TradingView community for sharing powerful visual ideas.
—
By tags trading

Ratio-Adjusted McClellan Summation Index RASI NASIRatio-Adjusted McClellan Summation Index (RASI NASI)
In Book "The Complete Guide to Market Breadth Indicators" Author Gregory L. Morris states
"It is the author’s opinion that the McClellan indicators, and in particular, the McClellan Summation Index, is the single best breadth indicator available. If you had to pick just one, this would be it."
What It Does: The Ratio-Adjusted McClellan Summation Index (RASI) is a market breadth indicator that tracks the cumulative strength of advancing versus declining issues for a user-selected exchange (NASDAQ, NYSE, or AMEX). Derived from the McClellan Oscillator, it calculates ratio-adjusted net advances, applies 19-day and 39-day EMAs, and sums the oscillator values to produce the RASI. This indicator helps traders assess market health, identify bullish or bearish trends, and detect potential reversals through divergences.
Key features:
Exchange Selection : Choose NASDAQ (USI:ADVN.NQ, USI:DECL.NQ), NYSE (USI:ADVN.NY, USI:DECL.NY), or AMEX (USI:ADVN.AM, USI:DECL.AM) data.
Trend-Based Coloring : RASI line displays user-defined colors (default: black for uptrend, red for downtrend) based on its direction.
Customizable Moving Average: Add a moving average (SMA, EMA, WMA, VWMA, or RMA) with user-defined length and color (default: EMA, 21, green).
Neutral Line at Zero: Marks the neutral level for trend interpretation.
Alerts: Six custom alert conditions for trend changes, MA crosses, and zero-line crosses.
How to Use
Add to Chart: Apply the indicator to any TradingView chart. Ensure access to advancing and declining issues data for the selected exchange.
Select Exchange: Choose NASDAQ, NYSE, or AMEX in the input settings.
Customize Settings: Adjust EMA lengths, RASI colors, MA type, length, and color to match your trading style.
Interpret the Indicator :
RASI Line: Black (default) indicates an uptrend (RASI rising); red indicates a downtrend (RASI falling).
Above Zero: Suggests bullish market breadth (more advancing issues).
Below Zero : Indicates bearish breadth (more declining issues).
MA Crosses: RASI crossing above its MA signals bullish momentum; crossing below signals bearish momentum.
Divergences: Compare RASI with the market index (e.g., NASDAQ Composite) to identify potential reversals.
Large Moves : A +3,600-point move from a low (e.g., -1,550 to +1,950) may signal a significant bull run.
Set Alerts:
Add the indicator to your chart, open the TradingView alert panel, and select from six conditions (see Alerts section).
Configure notifications (e.g., email, webhook, or popup) for each condition.
Settings
Market Selection:
Exchange: Select NASDAQ, NYSE, or AMEX for advancing/declining issues data.
EMA Settings:
19-day EMA Length: Period for the shorter EMA (default: 19).
39-day EMA Length: Period for the longer EMA (default: 39).
RASI Settings:
RASI Uptrend Color: Color for rising RASI (default: black).
RASI Downtrend Color: Color for falling RASI (default: red).
RASI MA Settings:
MA Type: Choose SMA, EMA, WMA, VWMA, or RMA (default: EMA).
MA Length: Set the MA period (default: 21).
MA Color: Color for the MA line (default: green).
Alerts
The indicator uses alertcondition() to create custom alerts. Available conditions:
RASI Trend Up: RASI starts rising (based on RASI > previous RASI, shown as black line).
RASI Trend Down: RASI starts falling (based on RASI ≤ previous RASI, shown as red line).
RASI Above MA: RASI crosses above its moving average.
RASI Below MA: RASI crosses below its moving average.
RASI Bullish: RASI crosses above zero (bullish market breadth).
RASI Bearish: RASI crosses below zero (bearish market breadth).
To set alerts, add the indicator to your chart, open the TradingView alert panel, and select the desired condition.
Notes
Data Requirements: Requires access to advancing/declining issues data (e.g., USI:ADVN.NQ, USI:DECL.NQ for NASDAQ). Some symbols may require a TradingView premium subscription.
Limitations: RASI is a medium- to long-term indicator and may lag in volatile or range-bound markets. Use alongside other technical tools for confirmation.
Data Reliability : Verify the selected exchange’s data accuracy, as inconsistencies can affect results.
Debugging: If no data appears, check symbol validity (e.g., try $ADVN/Q, $DECN/Q for NASDAQ) or contact TradingView support.
Credits
Based on the Ratio-Adjusted McClellan Summation Index methodology by McClellan Financial Publications. No external code was used; the implementation is original, inspired by standard market breadth concepts.
Disclaimer
This indicator is for informational purposes only and does not constitute financial advice. Past performance is not indicative of future results. Conduct your own research and combine with other tools for informed trading decisions.

Crypto DanR 1.4.2 PC-Roye Edition📜 Crypto DanR 1.4.2 — PC Roye Edition (Open Source)
This indicator combines Smart Money Concepts (SMC), Liquidity Analysis, and Trend Filtering to provide traders with a high-quality tool for intraday and swing trading on assets like XRP/USDT.
✅ What This Script Does
Crypto DanR 1.4.2 integrates the following advanced features:
Break of Structure (BOS) & Change of Character (CHoCH):
Detects key shifts in market structure
Helps confirm trend direction and reversal points
Fair Value Gaps (FVG):
Displays unmitigated liquidity voids using a style inspired by LuxAlgo
Highlights potential retracement zones where smart money may re-enter
Equal Highs / Equal Lows (EQH/EQL):
Marks liquidity zones that institutions often target before reversals
Order Blocks (OB):
Identifies potential institutional demand/supply zones
Option to filter by wick, body, or mitigation logic
Fibonacci Volatility Bands (based on BigBeluga’s logic):
Detects potential price extremes using Fib extensions on volatility
10 Moving Averages in One (inspired by hiimannshu's script):
Supports 10 custom MAs (SMA, EMA, RMA, HMA, VWMA, etc.) with adjustable source and timeframe
Ideal for trend filtering or dynamic support/resistance
Vector Candles (TradersReality / PVSRA):
Color-coded candles showing real-time volume pressure and trend bias
Visual Trade Plan:
Optional overlay for entry, stop-loss, and take-profit planning
Displays risk-to-reward ratio and potential % gain/loss live
🧠 How It Works
The script uses a price-action-first approach, built around concepts from Smart Money Theory. CHoCH and BOS detect structural shifts, while FVGs and OBs help forecast likely reaction zones. The multiple moving averages act as a trend filter to avoid entering against momentum.
This combination allows traders to:
Enter on mitigations or breakouts
Set stops outside liquidity zones
Manage trades visually with dynamic risk/reward levels
📊 Best Use Cases
15m or 1h scalping (ideal)
Swing trading on 4h
Works well on crypto, FX, and indices
🙏 Credits
TradersReality for PVSRA logic via public library
LuxAlgo for FVG inspiration
hiimannshu for 10-in-1 MA logic
BigBeluga for Fibonacci Bands methodology
All reused logic is significantly modified and part of a broader framework.
📌 Notes
Script is open-source to promote transparency and collaboration
Please do not copy-paste and republish without adding meaningful improvements
Feedback and suggestions welcome!

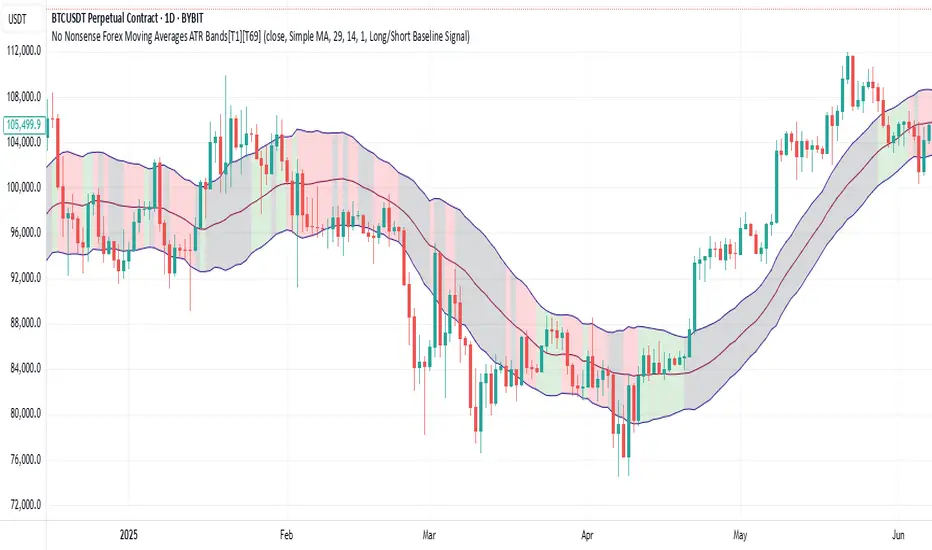
No Nonsense Forex Moving Averages ATR Bands[T1][T69]🔍 Overview
This indicator implements a No Nonsense Forex-style Baseline combined with ATR Bands, built using the moving_averages_library by Teyo69. It plots a configurable moving average and dynamically adjusts upper/lower ATR bands for trade zone detection and baseline confirmation.
✨ Features
30+ Moving Average types
ATR bands to define dynamic trade zones
Visual background highlighting for trade signals
Supports both "Within Range" and "Baseline Bias" display modes
Clean, minimal overlay with effective zone coloring
⚙️ How to Use
Choose MA Type: Select the baseline logic (SMA, EMA, HMA, etc.)
Configure ATR Bands: Adjust the ATR length and multiplier
Select Background Mode:
Within Range: Yellow = price inside band, Gray = outside
Long/Short Baseline Signal: Green = price above baseline, Red = below
Trade Setup:
Use the baseline for trend direction
Wait for confirmation or avoidance when price is outside the band
🛠 Configuration
Source: Price source for MA
MA Type: Any supported MA from the library
MA Length: Number of bars for smoothing
ATR Length: Period for Average True Range
ATR Multiplier: Width of the bands
Background Signal Mode: Choose visual signal type
⚠️ Limitations
Works with one MA at a time
Requires the moving_averages_library imported
Does not include confirmation or exit logic — use with full NNFX stack
💡 Tips
Combine with Volume or Confirmation indicators for NNFX strategy
Use adaptive MAs like KAMA, JMA, or VIDYA for dynamic baselines
Adjust ATR settings based on asset volatility
📘 Credits
Library: Teyo69/moving_averages_library/1
Inspired by: No Nonsense Forex (VP) Baseline + ATR Band methodology & MigthyZinger
🧪 Yuri Garcia Smart Money Strategy FULL (Slope Divergence))📣 Yuri Garcia – Smart Money Strategy FULL
This is my private Smart Money Concept strategy, designed for my family and community to learn, trade, and grow sustainably.
🔑 How it works:
✅ Volume Cluster Zones: Automatically detects areas where strong buyers or sellers concentrate, acting as dynamic S/R levels.
✅ HTF Institutional Zones (4H): Higher timeframe trend filter ensures you’re always trading in the direction of major flows.
✅ Wick Pullback Filter: Confirms price rejects the zone, catching smart money traps and reversals.
✅ Cumulative Delta (CVD): Confirms whether buyers or sellers are truly in control.
✅ Slope-Based Divergence: Optional hidden divergence between price & CVD to spot reversals others miss.
✅ ATR Dynamic SL/TP: Adapts stop loss and take profit to live volatility with adjustable risk/reward.
🧩 Visual Markers Explained:
🟦 Blue X: Price inside HTF zone
🟨 Yellow X: Price inside Volume Cluster zone
🟧 Orange Circle: Wick pullback detected
🟥 Red Square: CVD confirms order flow strength
🔼 Aqua Triangle Up: Bullish slope divergence
🔽 Purple Triangle Down: Bearish slope divergence
🟢 Green Triangle Up: Final Long Entry confirmed
🔴 Red Triangle Down: Final Short Entry confirmed
⚡ Who is this for?
This strategy is best suited for traders who understand smart money concepts, order flow, and want an adaptive framework to trade major assets like BTC, Gold, SP500, NASDAQ, or FX pairs.
🔒 Important
Use responsibly, backtest extensively, and combine with solid risk management. This is for educational purposes only.
✨ Credits
Built with ❤️ by Yuri Garcia – dedicated to my family & community.
✅ How to use it
1️⃣ Add to chart
2️⃣ Adjust inputs for your asset & timeframe
3️⃣ Enable/disable slope divergence filter to match your style
4️⃣ Set your alerts with built-in conditions

Weekly Range ProjectionsWeekly Range Projections
Inspired by toodegrees' excellent "ICT Friday's Asian Range" indicator
This indicator is a modified and enhanced version of the original Friday's Asian Range indicator created by toodegrees. While studying their brilliant work, I realized the concept could be expanded beyond just Friday's Asian session to create a more versatile tool for weekly price projections.
What's New?
I've transformed the original concept into a fully customizable range projection tool that allows traders to:
Select Any Day of the Week - Not limited to just Fridays anymore
Define Custom Time Ranges - Set your own start and end times to capture any session (Asian, London, New York, or custom ranges)
Flexible Deviation Levels - Choose between 1-9 standard deviations instead of the fixed 5
Toggle Body/Wick Ranges - Show or hide body and wick projections independently
Updated to Pine Script v6 - Taking advantage of the latest Pine Script features
How It Works
The indicator captures the price range (body and/or wick) during your specified time window on your chosen day, then projects standard deviation levels from that range. These levels often act as significant support/resistance throughout the week.
Use Cases
Weekly Opening Range - Capture Monday's opening range for week-long projections
Session-Based Analysis - Define any session on any day for targeted analysis
Multi-Timeframe Projections - Create different instances for various time ranges
ICT Concepts - Perfect for traders following ICT methodologies with customizable ranges
Credits
Huge thanks to toodegrees for creating the original Friday's Asian Range indicator and sharing it with the community. Their clean code structure and innovative approach to range projections inspired this modification. The core logic and visual presentation style remain true to their original vision, with added flexibility for broader applications.
If you find this useful, please also check out toodegrees' original indicators - they create fantastic tools for the TradingView community!
Settings Guide
Range Settings - Choose your day and define start/end times
Range Type - Toggle body and/or wick ranges
Deviations - Select how many standard deviation levels to display
Styling - Customize colors and line styles for both range types
Alerts - Set up alerts for price crossing specific deviation levels
Remember to use this on 5-minute or 15-minute charts as intended by the original design.
Note: This indicator follows the Mozilla Public License 2.0

TextLibrary "Text"
library to format text in different fonts or cases plus a sort function.
🔸 Credits and Usage
This library is inspired by the work of three authors (in chronological order of publication date):
Unicode font function - JD - Duyck
UnicodeReplacementFunction - wlhm
font - kaigouthro
🔹 Fonts
Besides extra added font options, the toFont(fromText, font) method uses a different technique. On the first runtime bar (whether it is barstate.isfirst , barstate.islast , or between) regular letters and numbers and mapped with the chosen font. After this, each character is replaced using the build-in key - value pair map function .
Also an enum Efont is included.
Note: Some fonts are not complete, for example there isn't a replacement for every character in Superscript/Subscript.
Example of usage (besides the included table example):
import fikira/Text/1 as t
i_font = input.enum(t.Efont.Blocks)
if barstate.islast
sentence = "this sentence contains words"
label.new(bar_index, 0, t.toFont(fromText = sentence, font = str.tostring(i_font)), style=label.style_label_lower_right)
label.new(bar_index, 0, t.toFont(fromText = sentence, font = "Circled" ), style=label.style_label_lower_left )
label.new(bar_index, 0, t.toFont(fromText = sentence, font = "Wiggly" ), style=label.style_label_upper_right)
label.new(bar_index, 0, t.toFont(fromText = sentence, font = "Upside Latin" ), style=label.style_label_upper_left )
🔹 Cases
The script includes a toCase(fromText, case) method to transform text into snake_case, UPPER SNAKE_CASE, kebab-case, camelCase or PascalCase, as well as an enum Ecase .
Example of usage (besides the included table example):
import fikira/Text/1 as t
i_case = input.enum(t.Ecase.camel)
if barstate.islast
sentence = "this sentence contains words"
label.new(bar_index, 0, t.toCase(fromText = sentence, case = str.tostring(i_case)), style=label.style_label_lower_right)
label.new(bar_index, 0, t.toCase(fromText = sentence, case = "snake_case" ), style=label.style_label_lower_left )
label.new(bar_index, 0, t.toCase(fromText = sentence, case = "PascalCase" ), style=label.style_label_upper_right)
label.new(bar_index, 0, t.toCase(fromText = sentence, case = "SNAKE_CASE" ), style=label.style_label_upper_left )
🔹 Sort
The sort(strings, order, sortByUnicodeDecimalNumbers) method returns a sorted array of strings.
strings: array of strings, for example words = array.from("Aword", "beyond", "Space", "salt", "pepper", "swing", "someThing", "otherThing", "12345", "_firstWord")
order: "asc" / "desc" (ascending / descending)
sortByUnicodeDecimalNumbers: true/false; default = false
_____
• sortByUnicodeDecimalNumbers: every Unicode character is linked to a Unicode Decimal number ( wikipedia.org/wiki/List_of_Unicode_characters ), for example:
1 49
2 50
3 51
...
A 65
B 66
...
S 83
...
_ 95
` 96
a 97
b 98
...
o 111
p 112
q 113
r 114
s 115
...
This means, if we sort without adjusting ( sortByUnicodeDecimalNumbers = true ), in ascending order, the letter b (98 - small) would be after S (83 - Capital).
By disabling sortByUnicodeDecimalNumbers , Capital letters are intermediate transformed to str.lower() after which the Unicode Decimal number is retrieved from the small number instead of the capital number. For example S (83) -> s (115), after which the number 115 is used to sort instead of 83.
Example of usage (besides the included table example):
import fikira/Text/1 as t
if barstate.islast
aWords = array.from("Aword", "beyond", "Space", "salt", "pepper", "swing", "someThing", "otherThing", "12345", "_firstWord")
label.new(bar_index, 0, str.tostring(t.sort(strings= aWords, order = 'asc' , sortByUnicodeDecimalNumbers = false)), style=label.style_label_lower_right)
label.new(bar_index, 0, str.tostring(t.sort(strings= aWords, order = 'desc', sortByUnicodeDecimalNumbers = false)), style=label.style_label_lower_left )
label.new(bar_index, 0, str.tostring(t.sort(strings= aWords, order = 'asc' , sortByUnicodeDecimalNumbers = true )), style=label.style_label_upper_right)
label.new(bar_index, 0, str.tostring(t.sort(strings= aWords, order = 'desc', sortByUnicodeDecimalNumbers = true )), style=label.style_label_upper_left )
🔸 Methods/functions
method toFont(fromText, font)
toFont : Transforms text into the selected font
Namespace types: series string, simple string, input string, const string
Parameters:
fromText (string)
font (string)
Returns: `fromText` transformed to desired `font`
method toCase(fromText, case)
toCase : formats text to snake_case, UPPER SNAKE_CASE, kebab-case, camelCase or PascalCase
Namespace types: series string, simple string, input string, const string
Parameters:
fromText (string)
case (string)
Returns: `fromText` formatted to desired `case`
method sort(strings, order, sortByUnicodeDecimalNumbers)
sort : sorts an array of strings, ascending/descending and by Unicode Decimal numbers or not.
Namespace types: array
Parameters:
strings (array)
order (string)
sortByUnicodeDecimalNumbers (bool)
Returns: Sorted array of strings

MACD Liquidity Tracker Strategy [Quant Trading]MACD Liquidity Tracker Strategy
Overview
The MACD Liquidity Tracker Strategy is an enhanced trading system that transforms the traditional MACD indicator into a comprehensive momentum-based strategy with advanced visual signals and risk management. This strategy builds upon the original MACD Liquidity Tracker System indicator by TheNeWSystemLqtyTrckr , converting it into a fully automated trading strategy with improved parameters and additional features.
What Makes This Strategy Original
This strategy significantly enhances the basic MACD approach by introducing:
Four distinct system types for different market conditions and trading styles
Advanced color-coded histogram visualization with four dynamic colors showing momentum strength and direction
Integrated trend filtering using 9 different moving average types
Comprehensive risk management with customizable stop-loss and take-profit levels
Multiple alert systems for entry signals, exits, and trend conditions
Flexible signal display options with customizable entry markers
How It Works
Core MACD Calculation
The strategy uses a fully customizable MACD configuration with traditional default parameters:
Fast MA : 12 periods (customizable, minimum 1, no maximum limit)
Slow MA : 26 periods (customizable, minimum 1, no maximum limit)
Signal Line : 9 periods (customizable, now properly implemented and used)
Cryptocurrency Optimization : The strategy's flexible parameter system allows for significant optimization across different crypto assets. Traditional MACD settings (12/26/9) often generate excessive noise and false signals in volatile crypto markets. By using slower, more smoothed parameters, traders can capture meaningful momentum shifts while filtering out market noise.
Example - DOGE Optimization (45/80/290 settings) :
• Performance : Optimized parameters yielding exceptional backtesting results with 29,800% PnL
• Why it works : DOGE's high volatility and social sentiment-driven price action benefits from heavily smoothed indicators
• Timeframes : Particularly effective on 30-minute and 4-hour charts for swing trading
• Logic : The very slow parameters filter out noise and capture only the most significant trend changes
Other Optimizable Cryptocurrencies : This parameter flexibility makes the strategy highly effective for major altcoins including SUI, SEI, LINK, Solana (SOL) , and many others. Each crypto asset can benefit from custom parameter tuning based on its unique volatility profile and trading characteristics.
Four Trading System Types
1. Normal System (Default)
Long signals : When MACD line is above the signal line
Short signals : When MACD line is below the signal line
Best for : Swing trading and capturing longer-term trends in stable markets
Logic : Traditional MACD crossover approach using the signal line
2. Fast System
Long signals : Bright Blue OR Dark Magenta (transparent) histogram colors
Short signals : Dark Blue (transparent) OR Bright Magenta histogram colors
Best for : Scalping and high-volatility markets (crypto, forex)
Logic : Leverages early momentum shifts based on histogram color changes
3. Safe System
Long signals : Only Bright Blue histogram color (strongest bullish momentum)
Short signals : All other colors (Dark Blue, Bright Magenta, Dark Magenta)
Best for : Risk-averse traders and choppy markets
Logic : Prioritizes only the strongest bullish signals while treating everything else as bearish
4. Crossover System
Long signals : MACD line crosses above signal line
Short signals : MACD line crosses below signal line
Best for : Precise timing entries with traditional MACD methodology
Logic : Pure crossover signals for more precise entry timing
Color-Coded Histogram Logic
The strategy uses four distinct colors to visualize momentum:
🔹 Bright Blue : MACD > 0 and rising (strong bullish momentum)
🔹 Dark Blue (Transparent) : MACD > 0 but falling (weakening bullish momentum)
🔹 Bright Magenta : MACD < 0 and falling (strong bearish momentum)
🔹 Dark Magenta (Transparent) : MACD < 0 but rising (weakening bearish momentum)
Trend Filter Integration
The strategy includes an advanced trend filter using 9 different moving average types:
SMA (Simple Moving Average)
EMA (Exponential Moving Average) - Default
WMA (Weighted Moving Average)
HMA (Hull Moving Average)
RMA (Running Moving Average)
LSMA (Least Squares Moving Average)
DEMA (Double Exponential Moving Average)
TEMA (Triple Exponential Moving Average)
VIDYA (Variable Index Dynamic Average)
Default Settings : 50-period EMA for trend identification
Visual Signal System
Entry Markers : Blue triangles (▲) below candles for long entries, Magenta triangles (▼) above candles for short entries
Candle Coloring : Price candles change color based on active signals (Blue = Long, Magenta = Short)
Signal Text : Optional "Long" or "Short" text inside entry triangles (toggleable)
Trend MA : Gray line plotted on main chart for trend reference
Parameter Optimization Examples
DOGE Trading Success (Optimized Parameters) :
Using 45/80/290 MACD settings with 50-period EMA trend filter has shown exceptional results on DOGE:
Performance : Backtesting results showing 29,800% PnL demonstrate the power of proper parameter optimization
Reasoning : DOGE's meme-driven volatility and social sentiment spikes create significant noise with traditional MACD settings
Solution : Very slow parameters (45/80/290) filter out social media-driven price spikes while capturing only major momentum shifts
Optimal Timeframes : 30-minute and 4-hour charts for swing trading opportunities
Result : Exceptionally clean signals with minimal false entries during DOGE's characteristic pump-and-dump cycles
Multi-Crypto Adaptability :
The same optimization principles apply to other major cryptocurrencies:
SUI : Benefits from smoothed parameters due to newer coin volatility patterns
SEI : Requires adjustment for its unique DeFi-related price movements
LINK : Oracle news events create price spikes that benefit from noise filtering
Solana (SOL) : Network congestion events and ecosystem developments need smoothed detection
General Rule : Higher volatility coins typically benefit from very slow MACD parameters (40-50 / 70-90 / 250-300 ranges)
Key Input Parameters
System Type : Choose between Fast, Normal, Safe, or Crossover (Default: Normal)
MACD Fast MA : 12 periods default (no maximum limit, consider 40-50 for crypto optimization)
MACD Slow MA : 26 periods default (no maximum limit, consider 70-90 for crypto optimization)
MACD Signal MA : 9 periods default (now properly utilized, consider 250-300 for crypto optimization)
Trend MA Type : EMA default (9 options available)
Trend MA Length : 50 periods default (no maximum limit)
Signal Display : Both, Long Only, Short Only, or None
Show Signal Text : True/False toggle for entry marker text
Trading Applications
Recommended Use Cases
Momentum Trading : Capitalize on strong directional moves using the color-coded system
Trend Following : Combine MACD signals with trend MA filter for higher probability trades
Scalping : Use "Fast" system type for quick entries in volatile markets
Swing Trading : Use "Normal" or "Safe" system types for longer-term positions
Cryptocurrency Trading : Optimize parameters for individual crypto assets (e.g., 45/80/290 for DOGE, custom settings for SUI, SEI, LINK, SOL)
Market Suitability
Volatile Markets : Forex, crypto, indices (recommend "Fast" system or smoothed parameters)
Stable Markets : Stocks, ETFs (recommend "Normal" or "Safe" system)
All Timeframes : Effective from 1-minute charts to daily charts
Crypto Optimization : Each major cryptocurrency (DOGE, SUI, SEI, LINK, SOL, etc.) can benefit from custom parameter tuning. Consider slower MACD parameters for noise reduction in volatile crypto markets
Alert System
The strategy provides comprehensive alerts for:
Entry Signals : Long and short entry triangle appearances
Exit Signals : Position exit notifications
Color Changes : Individual histogram color alerts
Trend Conditions : Price above/below trend MA alerts
Strategy Parameters
Default Settings
Initial Capital : $1,000
Position Size : 100% of equity
Commission : 0.1%
Slippage : 3 points
Date Range : January 1, 2018 to December 31, 2069
Risk Management (Optional)
Stop Loss : Disabled by default (customizable percentage-based)
Take Profit : Disabled by default (customizable percentage-based)
Short Trades : Disabled by default (can be enabled)
Important Notes and Limitations
Backtesting Considerations
Uses realistic commission (0.1%) and slippage (3 points)
Default position sizing uses 100% equity - adjust based on risk tolerance
Stop-loss and take-profit are disabled by default to show raw strategy performance
Strategy does not use lookahead bias or future data
Risk Warnings
Past performance does not guarantee future results
MACD-based strategies may produce false signals in ranging markets
Consider combining with additional confluences like support/resistance levels
Test thoroughly on demo accounts before live trading
Adjust position sizing based on your risk management requirements
Technical Limitations
Strategy does not work on non-standard chart types (Heikin Ashi, Renko, etc.)
Signals are based on close prices and may not reflect intraday price action
Multiple rapid signals in volatile conditions may result in overtrading
Credits and Attribution
This strategy is based on the original "MACD Liquidity Tracker System" indicator created by TheNeWSystemLqtyTrckr . This strategy version includes significant enhancements:
Complete strategy implementation with entry/exit logic
Addition of the "Crossover" system type
Proper implementation and utilization of the MACD signal line
Enhanced risk management features
Improved parameter flexibility with no artificial maximum limits
Additional alert systems for comprehensive trade management
The original indicator's core color logic and visual system have been preserved while expanding functionality for automated trading applications.

RSI Mansfield +RSI Mansfield+ – Adaptive Relative Strength Indicator with Divergences
Overview
RSI Mansfield+ is an advanced relative strength indicator that compares your instrument’s performance against a configurable benchmark index or asset (e.g., Bitcoin Dominance, S&P 500). It combines Mansfield normalization, adaptive smoothing techniques, and automatic detection of bullish and bearish divergences (regular and hidden), delivering a comprehensive tool for assessing relative strength across any market and timeframe.
Originality and Motivation
Unlike traditional relative strength scripts, this indicator introduces several distinctive improvements:
Mansfield Normalization: Scales the ratio between the asset and the benchmark relative to its moving average, transforming it into a normalized oscillator that fluctuates around zero, making it easier to spot outperformance or underperformance.
Adaptive Smoothing: Automatically selects whether to use EMA or SMA based on the market type (crypto or stocks) and timeframe (intraday, daily, weekly, monthly), avoiding manual configuration and providing more robust results under varying volatility conditions.
Divergence Detection: Identifies four types of divergences in the Mansfield oscillator to help anticipate potential reversal points or trend confirmations.
Multi-Market Support: Offers benchmark selection among major crypto and global stock indices from a single input.
These enhancements make RSI Mansfield+ more practical and powerful than conventional relative strength scripts with static benchmarks or without divergence capabilities.
Core Concepts
Relative Strength (RS): Compares price evolution between your asset and the selected benchmark.
Mansfield Normalization: Measures how much the RS deviates from its historical moving average, expressed as a scaled oscillator.
Divergences: Detects regular and hidden bullish or bearish divergences within the Mansfield oscillator.
Timeframe Adaptation: Dynamically adjusts moving average lengths based on timeframe and market type.
How It Works
Benchmark Selection
Choose among over 10 indices or market domains (BTC Dominance, ETH Dominance, S&P 500, European indices, etc.).
Ratio Calculation
Computes the price-to-benchmark ratio and smooths it with the adaptive moving average.
Normalization and Scaling
Transforms deviations into a Mansfield oscillator centered around zero.
Dynamic Coloring
Green indicates relative outperformance, red signals underperformance.
Divergence Detection
Automatically identifies bullish and bearish (regular and hidden) divergences by comparing oscillator pivots against price pivots.
Baseline Reference
A clear zero line helps interpret relative strength trends.
Usage Guidelines
Benchmark Comparison
Ideal for traders analyzing whether an asset is outperforming or lagging its sector or market.
Divergence Analysis
Helps detect potential reversal or continuation signals in relative strength.
Multi-Timeframe Compatibility
Can be applied to intraday, daily, weekly, or monthly charts.
Interpretation
Oscillator >0 and green: outperforming the benchmark.
Oscillator <0 and red: underperforming.
Bullish divergences: potential relative strength reversal to the upside.
Bearish divergences: possible loss of momentum or reversal to the downside.
Credits
The concept of Mansfield Relative Strength is based on Stan Weinstein’s original work on relative performance analysis. This script was built entirely from scratch in TradingView Pine Script v6, incorporating original logic for adaptive smoothing, normalized scaling, and divergence detection, without reusing any external open-source code.

Adaptive Squeeze Momentum +Adaptive Squeeze Momentum+ (Auto-Timeframe Version)
Overview
Adaptive Squeeze Momentum+ is an enhanced volatility and momentum indicator designed to identify compression and expansion phases in price action. It is inspired by the classic Squeeze Momentum Indicator by LazyBear but introduces automatic parameter adaptation to any timeframe, making it simpler to use across different markets without manual configuration.
Concepts and Methodology
The script combines Bollinger Bands (BB) and Keltner Channels (KC) to detect periods when volatility contracts (squeeze) or expands (release).
A squeeze occurs when BB are inside KC, suggesting low volatility and potential breakout scenarios.
A squeeze release is detected when BB expand outside KC.
Momentum is derived using a linear regression applied to the difference between price and a midrange reference level.
Original Improvements
Compared to the original Squeeze Momentum Indicator, this version offers several enhancements:
Automatic Adaptation: BB and KC lengths and multipliers are dynamically adjusted based on the chart’s timeframe (from 1 minute up to 1 month), removing the need for manual tuning.
Simplified Visualization: A clean, minimalist histogram and clear squeeze state cross markers allow for faster interpretation.
Flexible Application: Designed to work consistently on intraday, daily, and higher timeframes across crypto, forex, stocks, and indices.
Features
Dynamic Squeeze Detection:
Gray Cross: Neutral (no squeeze detected)
Blue Cross: Active squeeze
Yellow Cross: Squeeze released
Momentum Histogram:
Positive/negative momentum shown with slope-based coloring.
Timeframe-Aware Parameters:
Automatically sets optimal BB/KC configurations.
Usage
Watch for blue crosses indicating an active squeeze phase that may precede a directional move.
Use the histogram color and slope to gauge momentum strength and direction.
Combine squeeze release signals with momentum confirmation for potential entries or exits.
Credits and Licensing
This script was inspired by LazyBear’s OLD “Squeeze Momentum Indicator” (). The implementation here significantly expands upon the original by introducing auto-adaptive parameters, restructured logic, and a new visualization approach. Published under the Mozilla Public License 2.0.
Disclaimer
This indicator is for educational purposes only and does not constitute financial advice. Use at your own risk.

The Great Anchors: Dual AVWAP Powered by RSI
The Great Anchors
*Dual Anchored Volume Weighted Average Price Powered by RSI*
---
📌 Overview
The Great Anchors is a dual AVWAP-based indicator that resets dynamically using RSI extremes — either from the current asset or a master symbol (e.g., BTCUSDT). It identifies meaningful shifts in price structure and momentum using these "anchored" levels.
It’s designed to help traders spot trend continuations, momentum inflection points, and entry signals aligned with overbought/oversold conditions — but only when the market confirms through volume-weighted price direction.
---
🛠 Core Logic
• AVWAP 1 (favwap): Anchored when RSI reaches overbought levels (top anchor)
• AVWAP 2 (savwap): Anchored when RSI reaches oversold levels (bottom anchor)
• AVWAPs are recalculated each time a new OB/OS condition is triggered — acting like "fresh anchors" at key market turning points.
---
⚙️ Key Features
🔁 Auto or Manual RSI Thresholds
→ Automatically determines dynamic RSI OB/OS levels based on past peaks and troughs, or lets you set fixed levels.
🧠 Master Symbol Control
→ Use the RSI of a separate asset (like BTCUSDT, ETHUSDT, SOLUSDT, BNBUSDT, SUPRAUSDT) or indices (like TOTAL, TOTAL2, BFR) to control resets — ideal for tracking how BTC/major coins impacts altcoins/others.
🔍 Trend-Filtering Signal Logic
→ Signals are filtered for less noise and are triggered when:
- Both AVWAPs are rising (bullish) or falling (bearish)
- Price action confirms the structure
🎯 Visual Markers & Alerts
→ "💥" for bullish signals and "🔥" for bearish ones. Alerts included for automation or push notifications.
---
🎯 How to Use It
1. Add the indicator to your chart.
2. Choose whether to use RSI from the current symbol or a master symbol (e.g., BTC).
3. Select auto-adjusted or manual OB/OS levels.
4. Watch for:
- AVWAP(s) making a significant change (at this point it's one of the AVWAPs resetting)
- Check if price flip it upwards or downwards
- If price goes above both AVWAPs thats a likely bullish trend
- If price can't go above both AVWAPs up and fall bellow both that's a likely bearish trend
- Price retesting upper AVWAP and bounce
- likely bullish continuation
- Price retesting lower AVWAP and dip
- likely bearish continuation
- Signal icons on chart ("💥 - Bullish" or "🔥- Bearish")
Best suited for:
• Swing traders
• Momentum traders
• Traders timing altcoin entries using BTC/Major asset's RSI
---
🔔 Signal Explanation
💥 Bullish Signal =
• Both AVWAPs rising
• Higher lows in price structure
• Bullish candle close
• Triggered from overbought RSI reset
🔥 Bearish Signal =
• Both AVWAPs falling
• Lower highs in price structure
• Bearish candle close
• Triggered from oversold RSI reset
Signals reset by opposite signals to prevent noise or overfitting.
---
⚠️ Tips & Notes
• Use AVWAPs as dynamic support/resistance, even without signal triggers
• Pair with volume or divergence tools for stronger confirmation
---
🧩 Credits & Philosophy
This tool is built with a simple philosophy:
"Anchor your trades to meaningful moments in price — not arbitrary time."
The dual AVWAP concept helps you see how price reacts after momentum peaks, giving you a cleaner bias and more precise trade setups.
---

Delta Spike Detector [GSK-VIZAG-AP-INDIA]📌 Delta Spike Detector – Volume Imbalance Ratio
By GSK-VIZAG-AP-INDIA
📘 Overview
This indicator highlights aggressive buying or selling activity by analyzing the imbalance between estimated Buy and Sell volume per candle. It flags moments when one side dominates the other significantly — defined by user-selectable volume ratio thresholds (10x, 15x, 20x, 25x).
📊 How It Works
Buy/Sell Volume Estimation
Approximates buyer and seller participation using candle structure:
Buy Volume = Proximity of close to low
Sell Volume = Proximity of close to high
Delta & Delta Ratio
Delta = Buy Volume − Sell Volume
Delta Ratio = Ratio of dominant volume side to the weaker side
When this ratio exceeds a threshold, it’s classified as a spike.
Spike Labels
Labels are plotted on the chart:
10x B, 15x B, 20x B, 25x B → Buy Spike Labels (below candles)
10x S, 15x S, 20x S, 25x S → Sell Spike Labels (above candles)
The color of each label reflects the spike strength.
⚙️ User Inputs
Enable/Disable Buy or Sell Spikes
Set custom delta ratio thresholds (default: 10x, 15x, 20x, 25x)
🎯 Use Cases
Spotting sudden aggressive activity (e.g. smart money moves, traps, breakouts)
Identifying short-term market exhaustion or momentum bursts
Complementing other trend or volume-based tools
⚠️ Important Notes
The script uses approximated Buy/Sell Volume based on price position, not actual order flow.
This is not a buy/sell signal generator. It should be used in context with other confirmation indicators or market structure.
✍️ Credits
Developed by GSK-VIZAG-AP-INDIA
For educational and research use only.

UT Bot + LinReg Candles (Dual Sensitivity)
Script Description:
This indicator combines the popular UT Bot Alerts system with Linear Regression Candles (open source) for enhanced trend detection and trading signals in one singel script. The UT Bot features independent, then 2 x ATR sensitivity and periods controls for buy and sell signals, allowing you to fine-tune entries and exits to match your strategy. The script also overlays colored Linear Regression Candles with an optional signal line, helping you visually identify trend strength and direction. All calculations are performed on standard chart prices (no Heikin Ashi). Suitable for all asset classes and timeframes.
Eample setting for usdjpy 5 min chart for repeated buy and sell singnals based on trend:
BUY ATR period 300 multiplier 1
SELL ATR period 1 multiplier 2
Disclaimer:
This script is for informational and educational purposes only. It is not financial advice. Use at your own risk; the author assumes no responsibility for any trading results or losses.
Credits goes to to Ugurvu for linreg candles and quantnomad for UT Bot alerts that make this script possible.
Author: Patrick

ITM 2x15// © 2025 Intraday Trading Machine
// This script is open-source. You may use and modify it, but please give credit.
// Colors the current 15-minute candle body green or red if the two previous candles were both bullish or bearish.
This script is designed for traders using the Scalping Intraday Trading Machine technique. It highlights when two consecutive 15-minute candles close in the same direction — either both bullish or both bearish.
For example, if you see two consecutive bearish candles, you might look for a long entry on a break above the high of the first bearish candle. This tool helps you visually identify these setups with clean, directional candle coloring — no clutter.
IDKFAIDKFA - Advanced Order Blocks & Volume Profile with Market Structure Analysis
Why IDKFA?
Named after the legendary DOOM cheat code that gives players "all weapons and full ammo," IDKFA provides traders with a comprehensive arsenal of market analysis tools. Just as the cheat code arms players with everything needed for combat, this indicator equips traders with essential market structure tools: Order Blocks, Volume Profile, LVN/HVN areas, Fibonacci retracements, and intelligent buy/sell signals - all in one unified system.
Core Features
Order Blocks Detection
Automatically identifies institutional order blocks using pivot high/low analysis
Extends blocks dynamically until price interaction occurs
Bullish blocks (demand zones) and bearish blocks (supply zones)
Customizable opacity and extend functionality
Advanced Volume Profile
Real-time volume profile calculation for multiple session types
Point of Control (POC), Value Area High (VAH), and Value Area Low (VAL)
Mode 1: Side-by-side bull/bear volume display
Mode 2: Overlapped volume display with percentage analysis
Shows buying vs selling pressure at each price level
LVN/HVN Area Detection
Low Volume Nodes (LVN): Areas below VAL where price moves quickly
High Volume Nodes (HVN): Areas above VAH with strong resistance
NPOC (Naked Point of Control): Single print areas within Value Area
Volume-based gradient coloring shows relative activity levels
Smart Fibonacci Retracements
Auto-detects trend direction for proper fibonacci orientation
Dynamic color coding: Red levels in uptrends, Gold in downtrends
Special 88.6% level turns lime green in downtrends
Key levels: 23.6%, 38.2%, 50%, 61.8%, 65%, 78.6%, 88.6%
Intelligent Signal System
Works best on higher timeframes
Identifies high-probability reversal setups at key levels
Buy signals: Large bearish rejection followed by bullish reclaim
Sell signals: Large bullish rejection followed by bearish breakdown
Signals only trigger near significant support/resistance areas
Signal Analysis & Usage Guidelines
Buy Signal Mechanics
The buy signal triggers when:
Previous candle shows significant bearish movement (minimum ATR multiplier)
Current candle reclaims a configurable percentage of the previous candle's range
Price is near a key support level (order blocks, fibonacci, volume levels)
Sell Signal Mechanics
The sell signal triggers when:
Previous candle shows significant bullish movement (minimum ATR multiplier)
Current candle rejects below a configurable percentage of the previous candle's range
Price is near a key resistance level (order blocks, fibonacci, volume levels)
When to TAKE Signals
High Probability Buy Signals:
Signal appears AT or BELOW the VAL (Value Area Low)
Signal occurs at bullish order block confluence
Price is in LVN area below VAL (momentum acceleration zone)
Signal aligns with fibonacci 61.8% or 78.6% support
Multiple session POC levels provide support confluence
Previous session's VAL acting as current support
High Probability Sell Signals:
Signal appears AT or ABOVE the VAH (Value Area High)
Signal occurs at bearish order block confluence
Price is in HVN area above VAH (heavy resistance zone)
Signal aligns with fibonacci 61.8% or 78.6% resistance
Multiple session POC levels provide resistance confluence
Previous session's VAH acting as current resistance
When to AVOID Signals
Avoid Buy Signals When:
Signal appears ABOVE the VAH (buying into resistance)
Price is in HVN red zones (high volume resistance areas)
No clear support structure below current price
Volume profile shows heavy selling pressure (high bear percentages)
Signal occurs during low-volume periods between major sessions
Multiple bearish order blocks exist below current price
Avoid Sell Signals When:
Signal appears BELOW the VAL (selling into support)
Price is in LVN green zones (momentum could continue)
No clear resistance structure above current price
Volume profile shows heavy buying pressure (high bull percentages)
Signal occurs during Asian session ranges without clear direction
Multiple bullish order blocks exist above current price
Volume Profile Context for Signals
Understanding Bull/Bear Percentages:
70%+ Bull dominance at a level = Strong support expected
70%+ Bear dominance at a level = Strong resistance expected
50/50 Split = Neutral zone, less predictable
Use percentages to gauge conviction behind moves
POC (Point of Control) Interactions:
Signals above POC in uptrend = Higher probability
Signals below POC in downtrend = Higher probability
Signals against POC bias require extra confirmation
POC often acts as magnetic level for price return
Trading Strategies
Strategy 1: VAL/VAH Bounce Strategy
Wait for price to approach VAL (support) or VAH (resistance)
Look for signal confirmation at these critical levels
Enter with tight stops beyond the Value Area
Target opposite boundary or next session's levels
Strategy 2: Order Block + Volume Confluence
Identify order block alignment with VAL/VAH
Wait for signal within the confluence zone
Enter on signal with stop beyond order block
Use LVN areas as acceleration zones for targets
Strategy 3: LVN/HVN Strategy
LVN (Green) Areas: "Go Zones" - expect quick price movement through low volume
HVN (Red) Areas: "Stop Zones" - expect resistance and potential reversals
NPOC Areas: "Fill Zones" - price often returns to fill single print gaps
Strategy 4: Multi-Session Analysis
Use Daily/Weekly for major structure context
Use 4H for intermediate levels
Use 1H for precise entry timing
Ensure all timeframes align before taking signals
Strategy 5: Fibonacci + Volume Profile
Buy signals at 61.8% or 78.6% fibonacci near VAL
Sell signals at 61.8% or 78.6% fibonacci near VAH
Use 88.6% level as final support/resistance before major moves
50% level often aligns with POC for confluence
Signal Quality Assessment
Grade A Signals (Highest Probability):
Signal at VAL/VAH with order block confluence
Fibonacci level alignment (61.8%, 78.6%)
Volume profile shows 70%+ dominance in signal direction
Multiple timeframe structure alignment
Signal occurs during high-volume sessions (London/NY)
Grade B Signals (Moderate Probability):
Signal near POC with some confluence
Fibonacci 50% or 38.2% alignment
Mixed volume profile readings (50-70% dominance)
Some timeframe alignment present
Signal during overlap sessions
Grade C Signals (Lower Probability):
Signal with minimal confluence
Weak fibonacci alignment or none
Volume profile neutral or against signal
Conflicting timeframe signals
Signal during low-volume periods
Risk Management Guidelines
Position Sizing Based on Signal Quality:
Grade A: Standard position size
Grade B: Reduced position size (50-75%)
Grade C: Minimal position size (25%) or skip entirely
Stop Loss Placement:
Beyond order block boundaries
Outside Value Area (VAL/VAH)
Below/above fibonacci confluence levels
Account for session volatility ranges
Profit Targets:
First target: Opposite VAL/VAH boundary
Second target: Next session's key levels
Final target: Major order blocks or fibonacci extensions
Credits & Attribution
Original components derived from:
Market Sessions & Volume Profile by © Leviathan (Mozilla Public License 2.0)
Volume Profile elements inspired by @LonesomeTheBlue's volume profile script
Pivot Order Blocks by TradingWolf / © MensaTrader (Mozilla Public License 2.0)
Auto Fibonacci Retracement code (public domain)
Significant enhancements and modifications include:
Advanced LVN/HVN detection and visualization
Bull/Bear percentage analysis for Mode 2/3
Comprehensive alert system with market context
Integrated buy/sell signals at key levels
Performance optimizations and extended session support
Enhanced Mode 2/3 with percentage pressure analysis
Important Disclaimers
This indicator is a technical analysis tool designed for educational purposes. It does not provide financial advice, investment recommendations, or trading signals that guarantee profits. All trading involves substantial risk of loss, and past performance does not guarantee future results. Users should conduct their own research, understand the risks involved, and consider consulting with qualified financial advisors before making trading decisions. The signals and analysis provided are based on historical price patterns and volume data, which may not predict future market movements accurately.
Best Practices
Never trade signals blindly - always consider volume profile context
Wait for confluence between multiple tools before entering
Respect the Value Area - avoid buying above VAH or selling below VAL
Use session context - Asian ranges vs London/NY breakouts
Practice proper risk management - position size based on signal quality
Understand the bigger picture - use multiple timeframes for context
Remember: Like the IDKFA cheat code, having all the tools doesn't guarantee success. The key is learning to use them together effectively and understanding when NOT to take a signal is often more important than knowing when to take one.
