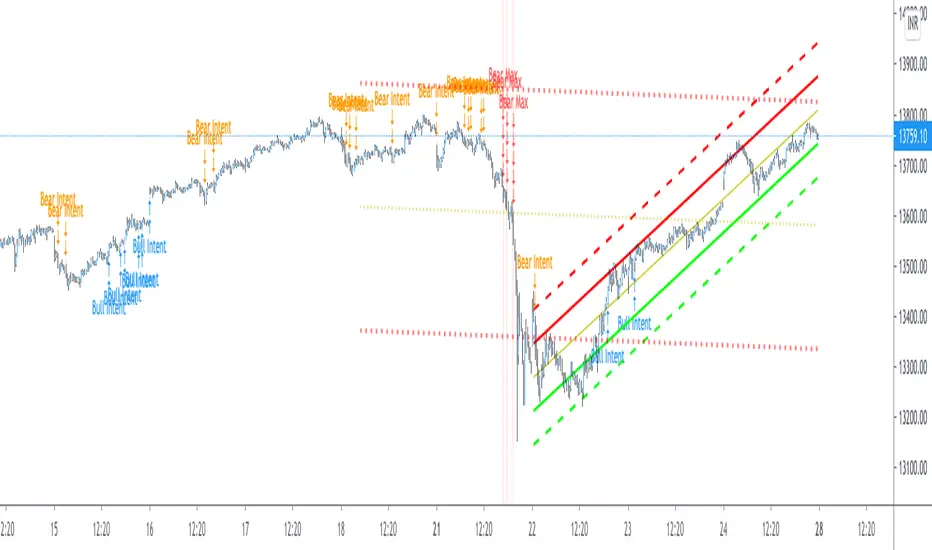
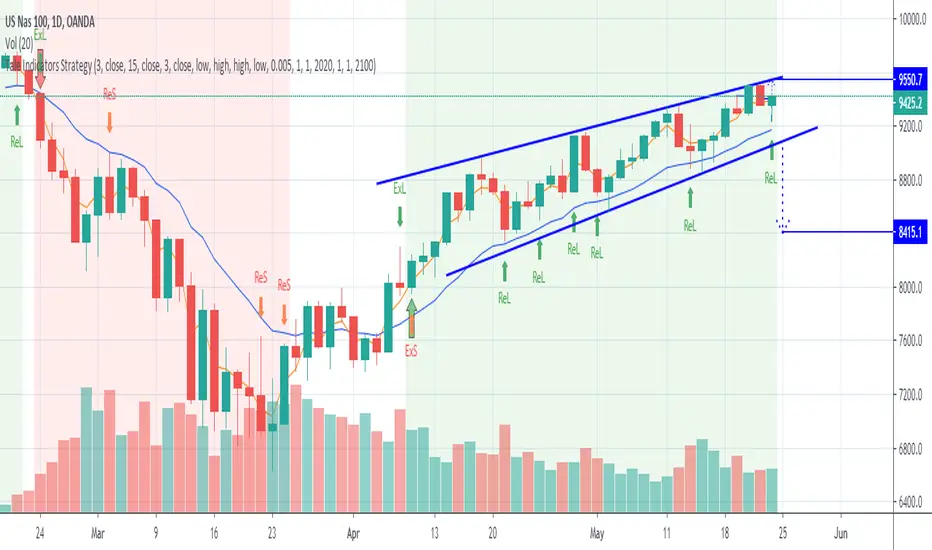
Pearsons R historic breaks ( for making strategy out of it )Pearsons R adjustments of linear regressions is a good tool to analyse visually the trend basis channeling of the market,
one of the common challenges in the scripts which i came across the tradingview community is the lack of the historic places put over the charts where the price actually crossed up/below the channel boundaries,
For me in order to do so we would have to replay the scripts over and over.
So I came up with an addon extension to a good script on the community ()
I have added the historic marks over the charts ( blue/green/red/orange Arrows which you see on the charts)
These arrows are the places where the price have crossed the channel boundaries historically
So,
Blue arrow = Bull Intent ,Place where the upper channel boundary line have been crossed
Orange arrow = Bear Intent , Place where the Lower channel boundary line have been crossed
Green arrow = Bull Max , Place where the Maximum Upper channel boundary line have been crossed
Red arrow = Bear Max , Place where the Minimum Lower channel boundary line have been crossed
For me this type of approach is good for making a strategy out of the concepts visually, in congestion to other indicators
I would suggest you guys to check this on alert basis with your setups to derive out the best from linear regressions
Lastly it would be a pleasure to give credits to the creators of Pearsons R scripts in Tradingview
@midtownsk8rguy
@TradeBoneDogs
@x11joe
Also thanking Tradingview for providing us such an awesome community and platform :)
在腳本中搜尋"N+credit最新动态"
[A618] Liquidity Levels Based OBV SR with KAMAWe all know OBV plays a very important role in figuring out price volume divergences and it can help anyone analyse the directivity force of the market and has a very good tradeoff if applied correctly
In this Experiment i have derived liquidity levels for OBV using volume jumps inside the market
A volume jump is classified as:
Good Volume Jump = 1.618 times the Average Volume (WMA or 2pole ButterWorth's Filter of Volume)
Great Volume Jump = 2 times the Average Volume (WMA or 2pole ButterWorth's Filter of Volume)
Extreme Volume Jump = 3 times the Average Volume (WMA or 2pole ButterWorth's Filter of Volume)
So the horizontal levels which you see on the indicator (colored in red/ blue / gray lines) are the derived Liquidity Levels for OBV in the Market, these are the levels where OBV is most likely to perform a movement or come back
Also I have applied KAMA indicator on top of OBV for better Directive guidance, as of my experiments KAMA seems to be most stable and consistence of all the other moving averages,
KAMA's Length inculde:
KAMA - 8
KAMA - 34
KAMA - 200
Hope this Script help you guys!
Thanks to Tradingview for providing such an awesome platform
##Note for Credits ::
The Ehlers 2 pole butterworth Filter function is derived from @cheatcountry script ()

VPoC per barThis study prints the current bar VPoC as an horizontal line.
It's aimed originally at BTCUSDT pair and 15m timeframe.
HOW IT WORKS
Zoom In mode: This is the default mode.
The study zooms in into the latest 15 1-minute bar candles in order to calculate the 15 minute candle VPoC.
Zoom Out mode: The VPoC from the last n bars from the current timeframe that match desired timeframe is shown on each bar.
In either case you are recommended to click on the '...' button associated to this study
and select 'Visual Order. Bring to Front.' so that it's properly shown in your chart.
HOW IT WORKS - Zoom In mode
Make sure that '(VP) Zoom into the VP timeframe' setting is set to true.
Choose the zoomed in timeframe where to calculate VPoC from thanks to the '(VP) Zoomed timeframe {1 minute}' setting.
Change '(VP) Zoomed in timeframe bars per current timeframe bar {15}' to its appropiated value. You just need to divide the current timeframe minutes per the zoomed in timeframe minutes per bar. E.g. If you are in 60 minute timeframe and you want to zoom in into 5 minute timeframe: 60 / 5 = 12 . You will write 12 here.
HOW IT WORKS - Zoom Out mode
Make sure that '(VP) Zoom into the VP timeframe' setting is set to false.
If you are using the Zoom out mode you might want to set '(VP) Print VPoC price as discrete lines {True}' to false.
Either choose the zoommed out timeframe where to calculate VPoC from thanks to the '(VP) Zoomed timeframe {1 minute}' setting or turn on the '(VP) Use number of bars (not VP timeframe)' setting in order to use '(VP) Number of bars {100}' as a custom number of bars.
WARNING - Zoom In mode last bar
The way that PineScript handles security function in last bar might result on the last bar not being accurate enough.
SETTINGS
__ SETTINGS - Volume Profile
(VP) Zoomed timeframe {1 minute}: Timeframe in which to zoom in or zoom out to calculate an accurate VPoC for the current timeframe.
(VP) Zoomed in timeframe bars per current timeframe bar {15}: Check 'HOW IT WORKS - Zoom In mode' above. Note : It is only used in 'Zoom in' mode.
(VP) Number of bars {100}: If 'Use number of bars (not VP timeframe)' is turned on this setting is used to calculate session VPoC. Note : It is only used in 'Zoom out' mode.
(VP) Price levels {24}: Price levels for calculating VPoC.
__ SETTINGS - MAIN TURN ON/OFF OPTIONS
(VP) Print VPoC price {True}: Show VPoC price
(VP) Zoom into the VP timeframe: When set to true the VPoC is calculated by zooming into the lower timeframe. When set to false a higher timeframe (or number of bars) is used.
(VP) Realtime Zoom in (Beta): Enable real time zoom for the last bar. It's beta because it would only work with zoomed in timeframe under 60 minutes. And when ratio between zoomout and zoomin is less than 60. Note : It is only used in 'Zoom in' mode.
(VP) Use number of bars (not VP timeframe): Uses 'Number of bars {100}' setting instead of 'Volume Profile timeframe' setting for calculating session VPoC. Note : It is only used in 'Zoom out' mode.
(VP) Print VPoC price as discrete lines {True}: When set to true the VPoC is shown as an small line in the center of each bar. When set to the false the VPoC line is printed as a normal line.
__ SETTINGS - EXTRA
(VP) VPoC color: Change the VPoC color
(VP) VPoC line width {1}: Change VPoC line width (in pixels).
(VP) Use number of bars (not VP timeframe): Uses 'Number of bars {100}' setting instead of 'Volume Profile timeframe' setting for calculating session VPoC. Note : It is only used in 'Zoom out' mode.
(VP) Print VPoC price as discrete lines {True}: When set to true the VPoC is shown as an small line in the center of each bar. When set to the false the VPoC line is printed as a normal line.
CREDITS
I have reused and adapted some code from
"Poor man's volume profile" study
which it's from TradingView IldarAkhmetgaleev user.

ATR TRex [ipooya]To appreciate dear Mr.Khakestar efforts I have converted his mt4 ATR formula to pine script. All credits go to him.
you can view the ATR result of each candle in the past:
The first black number is the ATR of the M1 chart.
The second black number is the ATR of the M5chart.
The third black number is the ATR of the M15 chart.
The fourth black number is the ATR of the H1 chart.
The fifth black number is the ATR of the H4 chart.
The sixth black number is the ATR of the Daily chart.
The seventh black number is the ATR of the Weekly chart.
**and the second number of every line is live ATR ( current ATR candle)
What makes this ATR formula so different?
This formula invented by Mr.Khakestar and it shows the power of the price to move in each cycle of the chart. We can use it in RTM strategy and Price Action trading. To learn how to use it you need to learn TRex strategy (Presented by Mr.Khakestart for free in Persian).

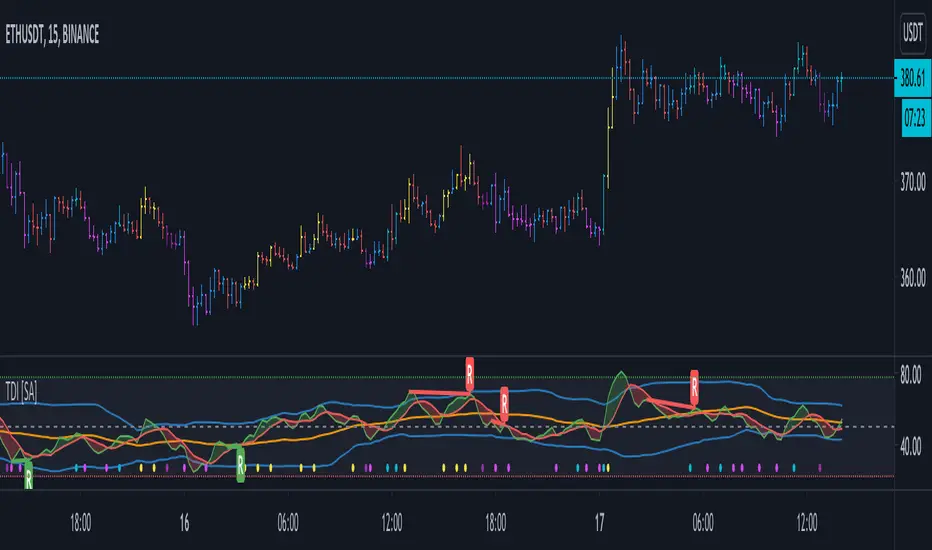
TDI - Traders Dynamic Index [SystemAlpha]Traders Dynamic Index with Divergence
Credits to the original code author LazyBear and modifications by JustUncleL
Ruckard TradingLatinoThis strategy tries to mimic TradingLatino strategy.
The current implementation is beta.
Si hablas castellano o espanyol por favor consulta MENSAJE EN CASTELLANO más abajo.
It's aimed at BTCUSDT pair and 4h timeframe.
STRATEGY DEFAULT SETTINGS EXPLANATION
max_bars_back=5000 : This is a random number of bars so that the strategy test lasts for one or two years
calc_on_order_fills=false : To wait for the 4h closing is too much. Try to check if it's worth entering a position after closing one. I finally decided not to recheck if it's worth entering after an order is closed. So it is false.
calc_on_every_tick=false
pyramiding=0 : We only want one entry allowed in the same direction. And we don't want the order to scale by error.
initial_capital=1000 : These are 1000 USDT. By using 1% maximum loss per trade and 7% as a default stop loss by using 1000 USDT at 12000 USDT per BTC price you would entry with around 142 USDT which are converted into: 0.010 BTC . The maximum number of decimal for contracts on this BTCUSDT market is 3 decimals. E.g. the minimum might be: 0.001 BTC . So, this minimal 1000 amount ensures us not to entry with less than 0.001 entries which might have happened when using 100 USDT as an initial capital.
slippage=1 : Binance BTCUSDT mintick is: 0.01. Binance slippage: 0.1 % (Let's assume). TV has an integer slippage. It does not have a percentage based slippage. If we assume a 1000 initial capital, the recommended equity is 142 which at 11996 USDT per BTC price means: 0.011 BTC. The 0.1% slippage of: 0.011 BTC would be: 0.000011 . This is way smaller than the mintick. So our slippage is going to be 1. E.g. 1 (slippage) * 0.01 (mintick)
commission_type=strategy.commission.percent and commission_value=0.1 : According to: binance . com / en / fee / schedule in VIP 0 level both maker and taker fees are: 0.1 %.
BACKGROUND
Jaime Merino is a well known Youtuber focused on crypto trading
His channel TradingLatino
features monday to friday videos where he explains his strategy.
JAIME MERINO STANCE ON BOTS
Jaime Merino stance on bots (taken from memory out of a 2020 June video from him):
'~
You know. They can program you a bot and it might work.
But, there are some special situations that the bot would not be able to handle.
And, I, as a human, I would handle it. And the bot wouldn't do it.
~'
My long term target with this strategy script is add as many
special situations as I can to the script
so that it can match Jaime Merino behaviour even in non normal circumstances.
My alternate target is learn Pine script
and enjoy programming with it.
WARNING
This script might be bigger than other TradingView scripts.
However, please, do not be confused because the current status is beta.
This script has not been tested with real money.
This is NOT an official strategy from Jaime Merino.
This is NOT an official strategy from TradingLatino . net .
HOW IT WORKS
It basically uses ADX slope and LazyBear's Squeeze Momentum Indicator
to make its buy and sell decisions.
Fast paced EMA being bigger than slow paced EMA
(on higher timeframe) advices going long.
Fast paced EMA being smaller than slow paced EMA
(on higher timeframe) advices going short.
It finally add many substrats that TradingLatino uses.
SETTINGS
__ SETTINGS - Basics
____ SETTINGS - Basics - ADX
(ADX) Smoothing {14}
(ADX) DI Length {14}
(ADX) key level {23}
____ SETTINGS - Basics - LazyBear Squeeze Momentum
(SQZMOM) BB Length {20}
(SQZMOM) BB MultFactor {2.0}
(SQZMOM) KC Length {20}
(SQZMOM) KC MultFactor {1.5}
(SQZMOM) Use TrueRange (KC) {True}
____ SETTINGS - Basics - EMAs
(EMAS) EMA10 - Length {10}
(EMAS) EMA10 - Source {close}
(EMAS) EMA55 - Length {55}
(EMAS) EMA55 - Source {close}
____ SETTINGS - Volume Profile
Lowest and highest VPoC from last three days
is used to know if an entry has a support
VPVR of last 100 4h bars
is also taken into account
(VP) Use number of bars (not VP timeframe): Uses 'Number of bars {100}' setting instead of 'Volume Profile timeframe' setting for calculating session VPoC
(VP) Show tick difference from current price {False}: BETA . Might be useful for actions some day.
(VP) Number of bars {100}: If 'Use number of bars (not VP timeframe)' is turned on this setting is used to calculate session VPoC.
(VP) Volume Profile timeframe {1 day}: If 'Use number of bars (not VP timeframe)' is turned off this setting is used to calculate session VPoC.
(VP) Row width multiplier {0.6}: Adjust how the extra Volume Profile bars are shown in the chart.
(VP) Resistances prices number of decimal digits : Round Volume Profile bars label numbers so that they don't have so many decimals.
(VP) Number of bars for bottom VPOC {18}: 18 bars equals 3 days in suggested timeframe of 4 hours. It's used to calculate lowest session VPoC from previous three days. It's also used as a top VPOC for sells.
(VP) Ignore VPOC bottom advice on long {False}: If turned on it ignores bottom VPOC (or top VPOC on sells) when evaluating if a buy entry is worth it.
(VP) Number of bars for VPVR VPOC {100}: Number of bars to calculate the VPVR VPoC. We use 100 as Jaime once used. When the price bounces back to the EMA55 it might just bounce to this VPVR VPoC if its price it's lower than the EMA55 (Sells have inverse algorithm).
____ SETTINGS - ADX Slope
ADX Slope
help us to understand if ADX
has a positive slope, negative slope
or it is rather still.
(ADXSLOPE) ADX cut {23}: If ADX value is greater than this cut (23) then ADX has strength
(ADXSLOPE) ADX minimum steepness entry {45}: ADX slope needs to be 45 degrees to be considered as a positive one.
(ADXSLOPE) ADX minimum steepness exit {45}: ADX slope needs to be -45 degrees to be considered as a negative one.
(ADXSLOPE) ADX steepness periods {3}: In order to avoid false detection the slope is calculated along 3 periods.
____ SETTINGS - Next to EMA55
(NEXTEMA55) EMA10 to EMA55 bounce back percentage {80}: EMA10 might bounce back to EMA55 or maybe to 80% of its complete way to EMA55
(NEXTEMA55) Next to EMA55 percentage {15}: How much next to the EMA55 you need to be to consider it's going to bounce back upwards again.
____ SETTINGS - Stop Loss and Take Profit
You can set a default stop loss or a default take profit.
(STOPTAKE) Stop Loss % {7.0}
(STOPTAKE) Take Profit % {2.0}
____ SETTINGS - Trailing Take Profit
You can customize the default trailing take profit values
(TRAILING) Trailing Take Profit (%) {1.0}: Trailing take profit offset in percentage
(TRAILING) Trailing Take Profit Trigger (%) {2.0}: When 2.0% of benefit is reached then activate the trailing take profit.
____ SETTINGS - MAIN TURN ON/OFF OPTIONS
(EMAS) Ignore advice based on emas {false}.
(EMAS) Ignore advice based on emas (On closing long signal) {False}: Ignore advice based on emas but only when deciding to close a buy entry.
(SQZMOM) Ignore advice based on SQZMOM {false}: Ignores advice based on SQZMOM indicator.
(ADXSLOPE) Ignore advice based on ADX positive slope {false}
(ADXSLOPE) Ignore advice based on ADX cut (23) {true}
(STOPTAKE) Take Profit? {false}: Enables simple Take Profit.
(STOPTAKE) Stop Loss? {True}: Enables simple Stop Loss.
(TRAILING) Enable Trailing Take Profit (%) {True}: Enables Trailing Take Profit.
____ SETTINGS - Strategy mode
(STRAT) Type Strategy: 'Long and Short', 'Long Only' or 'Short Only'. Default: 'Long and Short'.
____ SETTINGS - Risk Management
(RISKM) Risk Management Type: 'Safe', 'Somewhat safe compound' or 'Unsafe compound'. ' Safe ': Calculations are always done with the initial capital (1000) in mind. The maximum losses per trade/day/week/month are taken into account. ' Somewhat safe compound ': Calculations are done with initial capital (1000) or a higher capital if it increases. The maximum losses per trade/day/week/month are taken into account. ' Unsafe compound ': In each order all the current capital is gambled and only the default stop loss per order is taken into account. That means that the maximum losses per trade/day/week/month are not taken into account. Default : 'Somewhat safe compound'.
(RISKM) Maximum loss per trade % {1.0}.
(RISKM) Maximum loss per day % {6.0}.
(RISKM) Maximum loss per week % {8.0}.
(RISKM) Maximum loss per month % {10.0}.
____ SETTINGS - Decimals
(DECIMAL) Maximum number of decimal for contracts {3}: How small (3 decimals means 0.001) an entry position might be in your exchange.
EXTRA 1 - PRICE IS IN RANGE indicator
(PRANGE) Print price is in range {False}: Enable a bottom label that indicates if the price is in range or not.
(PRANGE) Price range periods {5}: How many previous periods are used to calculate the medians
(PRANGE) Price range maximum desviation (%) {0.6} ( > 0 ): Maximum positive desviation for range detection
(PRANGE) Price range minimum desviation (%) {0.6} ( > 0 ): Mininum negative desviation for range detection
EXTRA 2 - SQUEEZE MOMENTUM Desviation indicator
(SQZDIVER) Show degrees {False}: Show degrees of each Squeeze Momentum Divergence lines to the x-axis.
(SQZDIVER) Show desviation labels {False}: Whether to show or not desviation labels for the Squeeze Momentum Divergences.
(SQZDIVER) Show desviation lines {False}: Whether to show or not desviation lines for the Squeeze Momentum Divergences.
EXTRA 3 - VOLUME PROFILE indicator
WARNING: This indicator works not on current bar but on previous bar. So in the worst case it might be VP from 4 hours ago. Don't worry, inside the strategy calculus the correct values are used. It's just that I cannot show the most recent one in the chart.
(VP) Print recent profile {False}: Show Volume Profile indicator
(VP) Avoid label price overlaps {False}: Avoid label prices to overlap on the chart.
EXTRA 4 - ZIGNALY SUPPORT
(ZIG) Zignaly Alert Type {Email}: 'Email', 'Webhook'. ' Email ': Prepare alert_message variable content to be compatible with zignaly expected email content format. ' Webhook ': Prepare alert_message variable content to be compatible with zignaly expected json content format.
EXTRA 5 - DEBUG
(DEBUG) Enable debug on order comments {False}: If set to true it prepares the order message to match the alert_message variable. It makes easier to debug what would have been sent by email or webhook on each of the times an order is triggered.
HOW TO USE THIS STRATEGY
BOT MODE: This is the default setting.
PROPER VOLUME PROFILE VIEWING: Click on this strategy settings. Properties tab. Make sure Recalculate 'each time the order was run' is turned off.
NEWBIE USER: (Check PROPER VOLUME PROFILE VIEWING above!) You might want to turn on the 'Print recent profile {False}' setting. Alternatively you can use my alternate realtime study: 'Resistances and supports based on simplified Volume Profile' but, be aware, it might consume one indicator.
ADVANCED USER 1: Turn on the 'Print price is in range {False}' setting and help us to debug this subindicator. Also help us to figure out how to include this value in the strategy.
ADVANCED USER 2: Turn on the all the (SQZDIVER) settings and help us to figure out how to include this value in the strategy.
ADVANCED USER 3: (Check PROPER VOLUME PROFILE VIEWING above!) Turn on the 'Print recent profile {False}' setting and report any problem with it.
JAIME MERINO: Just use the indicator as it comes by default. It should only show BUY signals, SELL signals and their associated closing signals. From time to time you might want to check 'ADVANCED USER 2' instructions to check that there's actually a divergence. Check also 'ADVANCED USER 1' instructions for your amusement.
EXTRA ADVICE
It's advised that you use this strategy in addition to these two other indicators:
* Squeeze Momentum Indicator
* ADX
so that your chart matches as close as possible to TradingLatino chart.
ZIGNALY INTEGRATION
This strategy supports Zignaly email integration by default. It also supports Zignaly Webhook integration.
ZIGNALY INTEGRATION - Email integration example
What you would write in your alert message:
||{{strategy.order.alert_message}}||key=MYSECRETKEY||
ZIGNALY INTEGRATION - Webhook integration example
What you would write in your alert message:
{ {{strategy.order.alert_message}} , "key" : "MYSECRETKEY" }
CREDITS
I have reused and adapted some code from
'Directional Movement Index + ADX & Keylevel Support' study
which it's from TradingView console user.
I have reused and adapted some code from
'3ema' study
which it's from TradingView hunganhnguyen1193 user.
I have reused and adapted some code from
'Squeeze Momentum Indicator ' study
which it's from TradingView LazyBear user.
I have reused and adapted some code from
'Strategy Tester EMA-SMA-RSI-MACD' study
which it's from TradingView fikira user.
I have reused and adapted some code from
'Support Resistance MTF' study
which it's from TradingView LonesomeTheBlue user.
I have reused and adapted some code from
'TF Segmented Linear Regression' study
which it's from TradingView alexgrover user.
I have reused and adapted some code from
"Poor man's volume profile" study
which it's from TradingView IldarAkhmetgaleev user.
FEEDBACK
Please check the strategy source code for more detailed information
where, among others, I explain all of the substrats
and if they are implemented or not.
Q1. Did I understand wrong any of the Jaime substrats (which I have implemented)?
Q2. The strategy yields quite profit when we should long (EMA10 from 1d timeframe is higher than EMA55 from 1d timeframe.
Why the strategy yields much less profit when we should short (EMA10 from 1d timeframe is lower than EMA55 from 1d timeframe)?
Any idea if you need to do something else rather than just reverse what Jaime does when longing?
FREQUENTLY ASKED QUESTIONS
FAQ1. Why are you giving this strategy for free?
TradingLatino and his fellow enthusiasts taught me this strategy. Now I'm giving back to them.
FAQ2. Seriously! Why are you giving this strategy for free?
I'm confident his strategy might be improved a lot. By keeping it to myself I would avoid other people contributions to improve it.
Now that everyone can contribute this is a win-win.
FAQ3. How can I connect this strategy to my Exchange account?
It seems that you can attach alerts to strategies.
You might want to combine it with a paying account which enable Webhook URLs to work.
I don't know how all of this works right now so I cannot give you advice on it.
You will have to do your own research on this subject. But, be careful. Automating trades, if not done properly,
might end on you automating losses.
FAQ4. I have just found that this strategy by default gives more than 3.97% of 'maximum series of losses'. That's unacceptable according to my risk management policy.
You might want to reduce default stop loss setting from 7% to something like 5% till you are ok with the 'maximum series of losses'.
FAQ5. Where can I learn more about your work on this strategy?
Check the source code. You might find unused strategies. Either because there's not a substantial increases on earnings. Or maybe because they have not been implemented yet.
FAQ6. How much leverage is applied in this strategy?
No leverage.
FAQ7. Any difference with original Jaime Merino strategy?
Most of the times Jaime defines an stop loss at the price entry. That's not the case here. The default stop loss is 7% (but, don't be confused it only means losing 1% of your investment thanks to risk management). There's also a trailing take profit that triggers at 2% profit with a 1% trailing.
FAQ8. Why this strategy return is so small?
The strategy should be improved a lot. And, well, backtesting in this platform is not guaranteed to return theoric results comparable to real-life returns. That's why I'm personally forward testing this strategy to verify it.
MENSAJE EN CASTELLANO
En primer lugar se agradece feedback para mejorar la estrategia.
Si eres un usuario avanzado y quieres colaborar en mejorar el script no dudes en comentar abajo.
Ten en cuenta que aunque toda esta descripción tenga que estar en inglés no es obligatorio que el comentario esté en inglés.
CHISTE - CASTELLANO
¡Pero Jaime!
¡400.000!
¡Tu da mun!

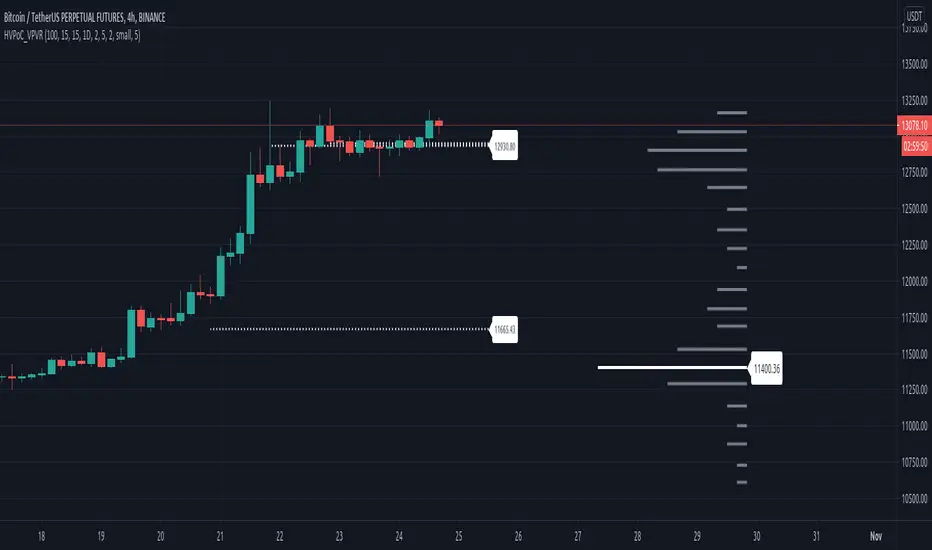
Historic VPoCs and pseudo VPVRThis study tries to recreate session based historic VPoCs
and VPVR Volume Profile
as they are used by
TradingLatino TradingView user.
It's aimed at BTCUSDT pair and 4h timeframe.
HOW IT WORKS
HOW IT WORKS - VPVR Profile Block
It gathers volume from the last chosen Bars
in order to draw the vpvr profile block
Volume that intersects with current level range
being studied is added to its value.
Additionally the current level price is modified
so that it matches the level price where most
of the volume has concentrated
So you get a pretty accurate price for drawn volume
while at the same time the levels are not stuck
to arbitrary level prices.
HOW IT WORKS - VPoC
It calculates a Volume Profile for the
given historic session but then
it only outputs that Volume Profile VPoC.
SETTINGS
Show VPVR Volume Profile {True}.
Show Historic VPoC lines {True}.
Show Historic VPoC labels {True}.
Extend Historic VPoC lines {True}: If this option is turned off the VPoC lines are only shown during the session duration.
Show tick difference from current price {False}: BETA. Feedback is needed because I'm not sure how it should work this setting.
VPVR Number of bars {100}: Define the Visible Range in number of bars so that its Volume Profile can be shown.
VPVR Profile width (in bars) {15}: VPVR Profile can be make larger or smaller in width thanks to this option.
VPVR Profile offset (in bars) {15}: VPVR Profile can be shown more to the left or to the right if the defaults do not suit you.
Historic Session Volume Profile timeframe {1D}: Historic VPoC use 1 day as their timeframe reference by default.
Number of decimal digits {2}: How many decimal digits are shown in label prices.
Number of previous sessions to print VPoC {5}: How many previous sessions VPoCs are to be printed. The maximum for this setting is 20.
Historic VPoC lines width (in pixels) {2}.
Historic VPoC labels size {small}.
History VPoC line offset (in bars) {5}: How far to the right VPoCs lines are to be extended. Note: This setting does not apply when 'Extend Historic VPoC lines' is set to 'False'.
WARNING
Please be aware that VPoC from the first previous session might not be accurate due to Pine Script limitations.
VPVR USAGE
This is not a VPVR like the official TradingView indicator.
This is a pseudo VPVR and that means it needs some manual input from you.
But, don't worry it's quite easy to do and if you always use the same number
of bars to calculate your VPVR then you might even just set it up once.
In order to show the VPVR (or Volume Profile on the Visible Range):
Rescale your chart so that you see all the bars for your Visible Range.
Click on the ruler tool.
Click on the last bar (far to the right) shown on the screen
Drag the ruler to first bar (far to the left) shown on the screen
Check what the ruler says
E.g. it says: 101 bars
Open this study settings
Modify: 'VPVR Number of bars ' setting
So that its value matches your measured number of bars (101)
Press OK to confirm and wait for the indicator to refresh.
STRATEGY USAGE
If your strategy uses VPoC
to define your resistances
or supports
you can check the VPoCs shown here.
FEEDBACK
I have only used this identifier in BTCUSDT 4h timeframe.
I'm interested to know what needs to be tweaked
in other securities and timeframes.
PINE STUDY TRICK
This study let's you choose the number of decimals the label will use.
CREDITS
I have reused and adapted some code from
'Poor man's volume profile' study
which it's from TradingView IldarAkhmetgaleev user.
I also wanted to thank him for helping me understanding his study.
I have reused some code from
'MTF Selection Framework - PineCoders FAQ' study
which it's from TradingView PineCoders user.
[A618]Improved Wave channel 3D The Script is an Amalgamation of Two prominent Scripts in One
1. Ehlers 2 Pole ButterWorth Filter
2. Wave Channel 3D
Intuitively,
Buy when Candles are above all the filter Lines
Sell when Candles are below the Filter Lines
CREDITS

[A618] Vortex Indicator Alert Screener [Noise Filtered]This Indicator helps you get alerts from Vortex Indicator if a trend is Established.
One of my followers asked me to do this: @Kiran_05
How this is made ?
1. Vortex Crossovers are taken into consideration in a noise filtered manner
2. Noise filtering is done by trend establishment due to Ehlers 2 pole ButterWorth Filter and EMA50 Crosses
How to use it ?
1. Can be used as a screener on the Script to generate the screened Securities from a Watchlist of Securities
2. Wait for a Candle break above of the generate green signal to get into trade, and vice versa
Credits :
@CheatCountry
For Ehlers 2 Pole Butterworth Filter V2
Hope this Helps

LB Squeeze Momentum DivergencesThis study tries to highlight LazyBear Squeeze Momentum divergences
as they are defined by
TradingLatino TradingView user
Squeeze momentum green peaks are connected by a line
Associated prices to these green peaks are also connected
If both lines have a different slope orientation
then there is a divergence.
It only shows two last divergence lines and angles.
The original chart screenshot shows some divergence lines
on the top or main chart
these were drawn manually
because you cannot write to two different charts
from the same pine script study (Well, not in August 2020 anyways)
It's aimed at BTCUSDT pair and 4h timeframe.
HOW IT WORKS
Simple geometric mathematics are used
to calculate the two lines degrees
Then both degrees are compared
to show if both lines agree ( // or \\ )
or if they disagree ( /\ or \/ )
SETTINGS
(SQZDiver) Show degrees : Show degrees of each Squeeze Momentum Divergence
lines to the x-axis.
(SQZDiver) Show desviation labels : Whether to show
or not desviation labels for the Squeeze Momentum Divergences.
(SQZDiver) Show desviation lines : Whether to show
or not desviation lines for the Squeeze Momentum Divergences.
(ADX) Smoothing
(ADX) DI Length
(ADX) key level
(ADX) Print : Whether to show
or not scaled ADX line
(SQZMOM) BB Length
(SQZMOM) BB MultFactor
(SQZMOM) KC Length
(SQZMOM) KC MultFactor
(SQZMOM) Use TrueRange (KC)
(SQZMOM) Print : Whether to show
or not Squeeze Momentum indicator.
WARNING
Some securities and timeframes might output degrees
too next to zero.
The code might need to be tweaked to meet your needs.
USAGE
One strategy is to sell when you are in a long entry
when you find out that the price slope is upwards ( / )
while the lb smilb slope is downwards: ( \ )
E.g. You will see:
/
\
on the indicator.
Why?
Because it might signal you that the price is
going to correct downwards soon.
FEEDBACK 1
Please let me know if there is any
other strategy based on the red side of
LB Squeeze Momentum
so that I might add support for it in the future.
FEEDBACK 2
Calculating degrees in a chart
with a different x-axis scale
is a nightmare
that's why I did not a range settings
so that values next to zero are
converted into zero
and thus showing an horizontal line.
Feedback is welcome on this matter.
EXTRA 1
If you turn off showing the divergence lines
and if you turn off showing the divergence labels
you almost get what TradingLatino user uses
as its default momentum indicator.
EXTRA 2
Optionally this indicator can show you
a rescaled ADX (it only works properly on 2020 Bitcoin charts)
ABOUT COLOURS
TradingLatino user has both dark green and light green
inverted compared to this LB SQZMOM chart.
CREDITS
I have reused and adapted some code from
'Squeeze Momentum Indicator' study
which it's from TradingView LazyBear user.
I have reused and adapted some code from
'Directional Movement Index + ADX & Keylevel Support' study
which it's from TradingView console user.

[A618] Historical Volatility Bands
Historical Volatility Bands
To be used over 5 mins for best results
HVB is a standard deviation measure for Historical Volatility Percentile,
It helps you figure out the next level of Support and Resistances
> If the HVB width is narrow, its an indication for a Trending market day
> Price crossing the highest green band line symbolises a nice upmove
> Price crossing the lowest red band line symbolises a nice downmove
> Green and Red lines are levels of Support and Resistances with respect to Historical Volatility
Credits
Historical Volatility Percentile calculation part : @cheatcountry
Link to cheatcountry idea
Hope this Helps!

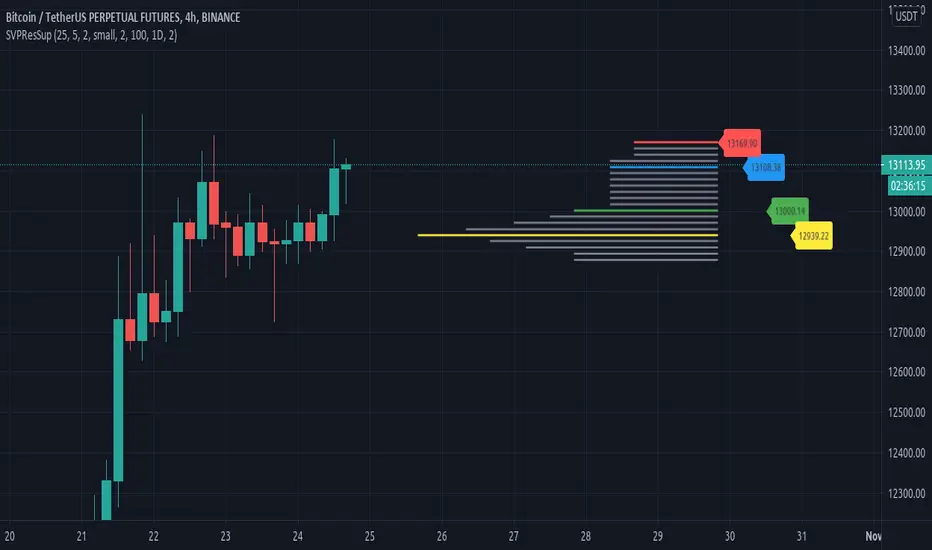
Resistances and supports based on simplified Volume ProfileThis study tries to highlight support and resistances
as they are defined by
TradingLatino TradingView user
His definition is based on volume peaks
on the official TradingView Volume Profile
indicator that seem rather big on size.
As a bonus it also serves as a rather simple volume profile indicator.
As you can see it only show last blocks volume profile.
It's aimed at BTCUSDT pair and 4h timeframe.
HOW IT WORKS
HOW IT WORKS - Recent Profile Block
It gathers volume from the last 100 Bars
in order to draw the recent profile block
Volume that intersects with current level range
being studied is added to its value.
Additionally the current level price is modified
so that it matches the level price where most
of the volume has concentrated
So you get a pretty accurate way of the volume
while at the same time the level are not stuck
to arbitrary level prices.
HOW IT WORKS - Resistances and Supports
It calculates the level which its price it's
nearer (from below) to the current price level
Resistance is found steping up (from current prive level)
level by level
till you find a level which its value
is higher than the previous level value.
Support is found steping down (from current prive level)
level by level
till you find a level which its value
is higher than the previous level value.
That way you ignore rather small
resistances and support values.
Finally the resistances and supports are drawn next to the recent profile block
so that you can look at them with ease.
If you hover over the label you can double check if you are looking at
current price, resistance or support levels.
SETTINGS
Bars in recent profile block : How many previous period volumes are used to calculate the recent profile block
Row width multiplier : Adjust how big the recent profile block seems to be
Resistances prices number of decimal digits : How many digits is shown at the resistance and support level prices.
WARNING
Please be aware that depending on your security and timeframe you might need to modify the
'Bars in recent profile block' setting so that the study does not timeout.
USAGE
If your strategy calculates take profit
limits on higher resistances based
on volume you could use this indicator
resistance detector
FEEDBACK 1
This is my first volume indicator.
I suppose that each trader
has his own approach on defining
resistances and supports.
I'm interested on knowing if the default way
this resistances and supports are calculated
matches what other traders would have
highlighted manually on the chart.
FEEDBACK 2
I have only used this identifier in BTCUSDT 4h timeframe.
I'm interested to know what needs to be tweaked
in other securities and timeframes.
PINE STUDY TRICK
This study let's you choose the number of decimals the label will use.
CREDITS
I have reused and adapted some code from
'Poor man's volume profile' study
which it's from TradingView IldarAkhmetgaleev user.
I also wanted to thank him for helping me understanding his study.
RDX ScoreModified TradingView script for @bankniftydoctor's RDX strategy. Original script idea credits to @TheProfessorDev
- I have modified the code to reflect core RDX strategy score, instead of the simplified one
- Every bar (including ones in RSI 45-55) will display its RDX score.
p.s .For the uninitiated, these number generated by this script are used for the RDX strategy devised by @bankniftydoctor. There's an anchored note at the upper right corner, which briefly summarises the RDX score & the positions to be taken accordingly.

Range identifier by angleThis study tries to highlight ranges
as they are defined by
TradingLatino TradingView user.
A range according to its definition would consist of
periods when the price does not move a lot.
It's aimed at BTCUSDT pair and 4h timeframe.
HOW IT WORKS
Price source is the middle between open and close values.
For each of the bars a '5' periods regression line is calculated
The regression line has an angle with the 0-axis line
which might be between 0 and 90.
0 angle would mean price is always the same
90 angle would mean price going to infinity
When '2' of those periods in a row
have their angles between a maximum angle
and a minimum angle then you have the range
SETTINGS
Price range bar periods : How many previous periods are used to calculate the bar regression line
Price range range periods : How many periods in a row should be used to say that there is a range
Price range maximum angle ( < 90.0 !!! ): Maximum angle for range detection
Price range minimum angle ( > -90.0 !!! ): Mininum angle for range detection
Angles should be set from -89.99 for the minimum angle to +89.99 for the maximum angle
WARNING
Despite the name indicator does not identify the entire range.
It identifies when you realise you are inside a range.
E.g. If a range length is 8 periods length this range indicator
will highlight only the last 6 periods of the range.
USAGE
If your strategy signals you an upwards trend
then you might use this range detector
to know when to exit your long position
Why?
Because most of the times
the price is found to be
in a range it goes down
FEEDBACK 1
I'm quite sure this range approach by comparing angles is a novel one.
I have checked Range Identifier script from TradingView LazyBear user
and it uses another approach.
I'm interested on different approaches on how to detect ranges.
FEEDBACK 2
I have only used this identifier in BTCUSDT 4h timeframe.
I'm interested to know if applying it more traditional
stocks the degrees need to be adjusted to something
more smaller.
PINE SCRIPT TRICK
This script simulates looping an string char by char
in pine script.
CREDITS
I have reused and adapted some code from
'TF Segmented Linear Regression' script
which it's from TradingView alexgrover user.

BNF VWAP & MAThe script picks up Bank nifty stocks with their current respective weights and plots a Volume Weighted Average Price ( VWAP ) line along with 2 EMAs of your choice and an alert when the EMAs cross over and also when price crosses VWAP .
You can customize the script for MA type and lengths and to remove alert. Basic utility of the script is to analyse volumes driving the Bank Nifty index.
Credits to @daytraderph and his script (Custom Volume ) who's code I used to build this script. Also thanks to my friend @Varun who helped me code it.

Funamental and financialsEarnings and Quarterly reporting and fundamental data at a glance.
A study of the financial data available by the "financial" functions in pinescript/tradingview
As far as I know, this script is unique. I found very few public examples of scripts using the fundamental data. and none that attempt to make the data available in a useful form
as an indicator / chart data. The only fitting category when publishing would be "trend analysis" We are going to look at the trend of the quarterly reports.
The intent is to create an indicator that instantly show the financial health of a company, and the trends in debt, cash and earnings
Normal settings displays all information on a per share basis, and should be viewed on a Daily chart
Percentage of market valuation can be used to compare fundamentals to current share price.
And actual to show the full numbers for verification with quarterly reporting and debuggging (actual is divided by 1.000.000 to keep numbers readable)
Credits to research study by Alex Orekhov (everget) for the Symbol Info Helper script
without it this would still be an unpublished mess, the use of textboxes allow me to remove many squiggly plot lines of fundamental data
Known problems and annoyances
1. Takes a long time to load. probably the amount of financial calls is the culprit. AFAIK not something i can to anything about in the script.
2. Textboxes crowd each other. dirty fix with hardcoded offsets. perhaps a few label offset options in the settings would do?
3. Only a faint idea of how to put text boxes on every quarter. Need time... (pun intended)
Have fun, and if you make significant improvements on this, please publish, or atleast leave a comment or message so I can consider adding it to this script.
© sjakk 2020-june-08

Nifty Volume profile + VWAP + EMA The script picks up nifty stocks with their current respective weights and plots a Volume Weighted Average Price line along with 2 EMAs and an alert when the EMAs cross over.
You can customize the script for EMA lengths and to remove alert. Basic utility of the script is to analyse volumes driving the Nifty 50 index.
Credits to @daytraderph and his script (Custom Volume) who's code I used to build this script. Also thanks to my friend @Varun who helped me code it.
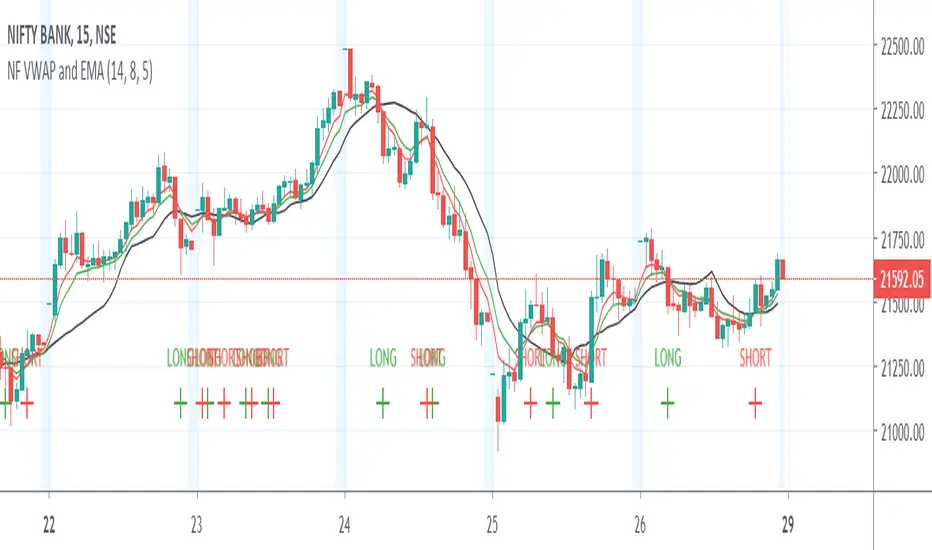
Tale Indicators StrategyThis script provides strategy from @JackBauer007 of the slowMA and fastMA crossovers to determine entry and exit conditions.
The default is set to 3EMA and 15EMA crossovers. With entry and exit for Long positions set to high and for Short positions set to low.
You can enable to run the strategy for a selected time-period to analyse the strategy on your instrument.
Credits to @ECHKAY and @JackBauer007 for their inputs and help
RSI CANDLESTICKSThis indicator display open, high, low, and close data in the form of a candlestick.
Credits to @allanster for the idea from

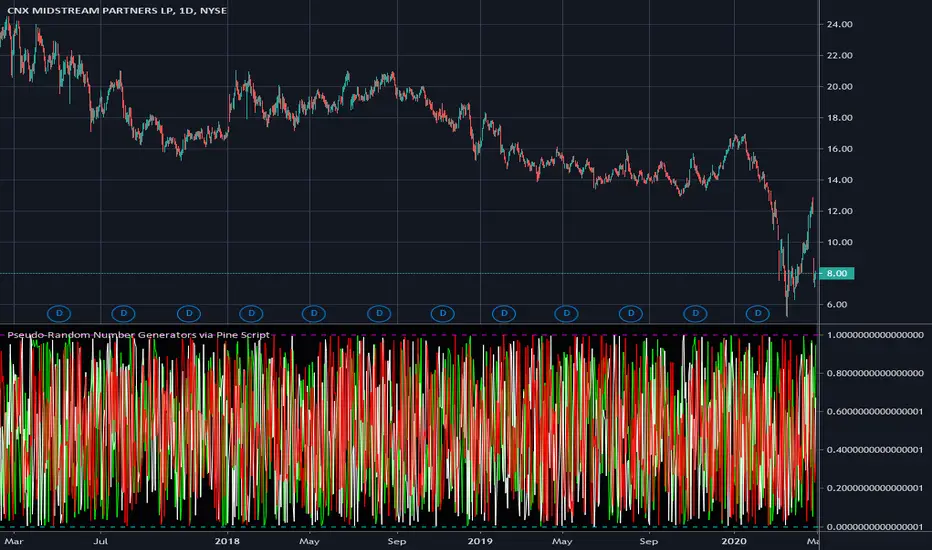
Pseudo-Random Number Generators via Pine ScriptThese are my "Pseudo-Random Number Generators via Pine Script", having uniform distribution between 0 and 1. In my quest for sequential pseudo-random numbers in Pine, tinkering with mathematical chaos, I have come up with these three simple yet handy generators. I believe these may be useful in the future by developers of the Tradingview community.
NOTICE: Use it as you please, this is free code to implement into your new Pine projects. You don't have to ask for my permission to reuse these functions in your published scripts, simply because I have better things to do than answer requests for the reuse of these simplistic PRNG functions. I don't require accreditation for members to reuse these functions either. I simply don't want any credit. I only require that you respectfully put it to "good and proper use" complimenting the elaborate script you have in mind. I would however like to see some great ideas utilizing these when I randomly and accidentally come across them in the public library. I didn't know where to put this script, so I just tossed it into the "Trend Analysis" category.
The comments section below is solely just for commenting and other remarks, ideas, compliments, etc... regarding only this indicator, not others. When available time provides itself, I will consider your inquiries, thoughts, and concepts presented below in the comments section, should you have any questions or comments regarding this indicator. When my indicators achieve more prevalent use by TV members, I may implement more ideas when they present themselves as worthy additions. As always, "Like" it if you simply just like it with a proper thumbs up, and also return to my scripts list occasionally for additional postings. Have a profitable future everyone!
Z Score Enhanced Time Segmented Volume (Multi MA)**THIS VERSION HAS BEEN STANDARDIZED WITH A Z SCORE CALCULATION AND ALLOWS THE USER TO SELECT WHICH MOVING AVERAGE THEY WOULD LIKE TO UTILIZE FOR THE SIGNAL LINE**
Chart shows the Non-Standardized Enhanced Time Segmented Volume (Multi MA) with default settings on top and the Standardized version with default settings on the bottom.
Time Segmented Volume was developed by Worden Brothers, Inc to be a leading indicator by comparing various time segments of both price and volume . Essentialy it is designed to measure the amount of money flowing in and out of an instrument.
Time Segmented Volume was originally ported to TradingView by user @liw0 and later corrected by user @vitelot. I never quite understood how to read Time Segmented Volume until I ran across a version by user @storma where they indicated when price would be long or short, but that code also utilized the incorrect calculation from user @liw0.
In an effort to make Time Segmented Volume more accessible and easier to read, I have re-coded it here. The calculations are based on the code from @vitelot and I have added direction indicators below the chart.
If the histogram (TSV) is greater than zero and greater than the moving average, price should be moving long and there will be a green box below the chart.
If TSV falls below the moving average while still being greater than zero, the trend may be exhausting and has been coded to read Price Action Long - FAILURE with a black x below the chart.
If the histogram (TSV) is less than zero and less than the moving average, price should be moving short and there will be a red box below the chart.
If TSV rises above the moving average while still being less than zero, the trend may be exhausting and has been coded to read Price Action Short - FAILURE with a black x below the chart.
At times, the moving average may be above zero while TSV is below zero or vice versa. In these situations the chart will indicate long or short based on whether or not TSV is greater or less than zero. It is possible a new trend may be forming as the moving average obviously lags, but also possible price is consolidating with little volume and causing TSV to oscillate close to zero.
**Z Score // Standardized Option **
Thist Standardized code implements all of the above but also allows the user to select a threshold level that should not need to be adjusted for each instrument (since the output is standardized).
If the TSV value meets the long and short signal requirements above and TSV is greater than the threshold values a green or red box will print ABOVE the oscillator. The histogram will also change color based on which threshold TSV has met.
This calculation allows us to compare current volatility to the mean (moving average) of the population (Z-Length). The closer the TSV Z-Score is to the mean, the closer it will be to the Zero Line and therefore price is likely consolidating and choppy. The farther TSV Z-Score is from the mean, the more likely price is trending.
The MA Mode determines the Moving Average used to calculate TSV itself. The Z-Score is ALWAYS calculated with a simple moving average (as that is the standard calculation for Z-Score).
The Threshold Levels are the levels at which TSV Z-Score will change from gray to yellow, orange, green ( bullish ), or red ( bearish ).
Statistically speaking, confidence levels in relation to Z-Score are noted below. The built in Threshold Levels are the positive and negative values for 90%, 95%, and 99%. This would indicate when volatility is greater than these values they are out of the ordinary from the standard range. You may wish to adjust these levels for TSV Z-Score to be more responsive to your trading needs
80% :: 1.28
85% :: 1.44
90% :: 1.64
95% :: 1.96
99% :: 2.58
The Z Length is the period for which the Z Score is calculated
More information regarding Time Segmented Volume can be found here: www.worden.com
Original code ported by @liw0
Corrected by @vitelot
Updated/Enhancements by @eylwithsteph with inspiration from @storma
Multiple MA Options Credits to @Fractured and @lejmer
Bits and Pieces from @AlexGrover, @Montyjus, and @Jiehonglim
As always, trade at your own risk.

Enhanced Time Segmented Volume (Multi MA)**THIS VERSION ALLOWS THE USER TO SELECT WHICH MOVING AVERAGE THEY WOULD LIKE TO UTILIZE FOR THE SIGNAL LINE**
Chart shows two different options of many. Top option is the default settings and bottom option is a different moving average with no other changes.
Time Segmented Volume was developed by Worden Brothers, Inc to be a leading indicator by comparing various time segments of both price and volume. Essentialy it is designed to measure the amount of money flowing in and out of an instrument.
Time Segmented Volume was originally ported to TradingView by user @liw0 and later corrected by user @vitelot. I never quite understood how to read Time Segmented Volume until I ran across a version by user @storma where they indicated when price would be long or short, but that code also utilized the incorrect calculation from user @liw0.
In an effort to make Time Segmented Volume more accessible and easier to read, I have re-coded it here. The calculations are based on the code from @vitelot and I have added direction indicators below the chart.
If the histogram (TSV) is greater than zero and greater than the moving average, price should be moving long and there will be a green box below the chart.
If TSV falls below the moving average while still being greater than zero, the trend may be exhausting and has been coded to read Price Action Long - FAILURE with a black x below the chart.
If the histogram (TSV) is less than zero and less than the moving average, price should be moving short and there will be a red box below the chart.
If TSV rises above the moving average while still being less than zero, the trend may be exhausting and has been coded to read Price Action Short - FAILURE with a black x below the chart.
At times, the moving average may be above zero while TSV is below zero or vice versa. In these situations the chart will indicate long or short based on whether or not TSV is greater or less than zero. It is possible a new trend may be forming as the moving average obviously lags, but also possible price is consolidating with little volume and causing TSV to oscillate close to zero.
More information regarding Time Segmented Volume can be found here: www.worden.com
Original code ported by @liw0
Corrected by @vitelot
Updated/Enhancements by @eylwithsteph with inspiration from @storma
Multiple MA Options Credits to @Fractured and @lejmer
Bits and Pieces from @AlexGrover, @Montyjus, and @Jiehonglim
As always, trade at your own risk.

Wolfs ADX + DII have created an alternative visualisation of the ADX + DI indicator created by MasaNakamura, credits to them for providing the source code! :-)
The histogram represents the distance between the DI+ and the DI-. The crossing of the histogram is equal to the crossing of the DI lines.
The ADX line is coloured based on the threshold.
This creates a clean representation of the ADX + DI.
