BINANCE-BYBIT Cross Chart: Spot-Perpetual CorrelationName: "Binance-Bybit Cross Chart: Spot-Perpetual Correlation"
Category: Scalping, Trend Analysis
Timeframe: 1M, 5M, 30M, 1D (depending on the specific technique)
Technical analysis: This indicator facilitates a comparison between the price movements shown on the Binance spot chart and the Bybit perpetual chart, with the aim of discerning the correlation between the two charts and identifying the dominant market trends. It automatically generates the corresponding chart based on the ticker selected in the primary chart. When a Binance pair is selected in the main chart, the indicator replicates the Bybit perpetual chart for the same pair and timeframe, and vice versa, selecting the Bybit perpetual chart as the primary chart generates the Binance spot chart.
Suggested use: You can utilize this tool to conduct altcoin trading on Binance or Bybit, facilitating the comparison of price actions and real-time monitoring of trigger point sensitivity across both exchanges. We recommend prioritizing the Binance Spot chart in the main panel due to its typically longer historical data availability compared to Bybit.
The primary objective is to efficiently and automatically manage the following three aspects:
- Data history analysis for higher timeframes, leveraging the extensive historical data of the Binance spot market. Variations in indicators such as slow moving averages may arise due to differences in historical data between exchanges.
- Assessment of coin liquidity on both exchanges by observing candlestick consistency on smaller timeframes or the absence of gaps. In the crypto market, clean charts devoid of gaps indicate dominance and offer enhanced reliability.
- Identification of precise trigger point levels, including daily, previous day, or previous week highs and lows, which serve as sensitive areas for breakout or reversal operations.
All-Time High (ATH) and All-Time Low (ATL) levels may vary significantly across exchanges due to disparities in historical data series.
This tool empowers traders to make informed decisions by leveraging historical data, liquidity insights, and precise trigger point identification across Binance Spot and Bybit Perpetual market.
Configuration:
EMA length:
- EMA 1: Default 5, user configurable
- EMA 2: Default 10, user configurable
- EMA 3: Default 60, user configurable
- EMA 4: Default 223, user configurable
- Additional Average: Optional display of an additional average, such as a 20-period average.
Chart Elements:
- Session separator: Indicates the beginning of the current session (in blue)
- Background: Indicates an uptrend (60 > 223) with a green background and a downtrend (60 < 223) with a red background.
Instruments:
- EMA Daily: Shows daily averages on an intraday timeframe.
- EMA levels 1h - 30m: Shows the levels of the 1g-30m EMAs.
- EMA Levels Highest TF: Provides the option to select additional EMA levels from the major timeframes, customizable via the drop-down menu.
- "Hammer Detector: Marks hammers with a green triangle and inverted hammers with a red triangle on the chart
- "Azzeramento" signal on TF > 30m: Indicates a small candlestick on the EMA after a dump.
- "No Fomo" signal on TF < 30m: Indicates a hyperextended movement.
Trigger Points:
- Today's highs and lows: Shows the opening price of the day's candlestick, along with the day's highs and lows (high in purple, low in red, open in green).
- Yesterday's highs and lows: Displays the opening price of the daily candlestick, along with the previous day's highs and lows (high in yellow, low in red).
You can customize the colors in "Settings" > "Style".
It is best used with the Scalping The Bull indicator on the main panel.
Credits:
@tumiza999: for tests and suggestions.
Thanks for your attention, happy to support the TradingView community.
在腳本中搜尋"N+credit最新动态"

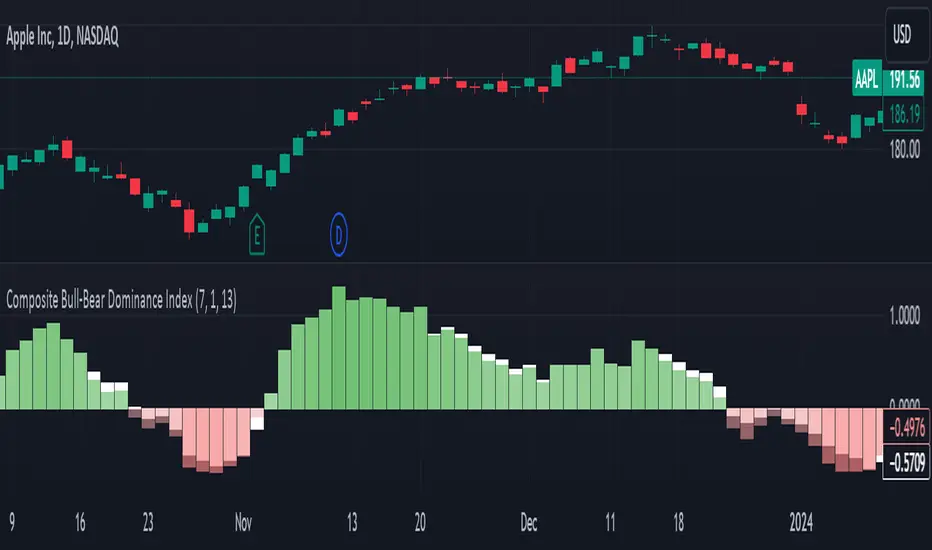
Composite Bull-Bear Dominance IndexNote: CREDITS: This is based on the Up Down Volume Indicator (published in Trading View) and Elder Ray Index (Bull Bear Power).
The Composite Bull Bear Dominance Index (CBBDI) is a indicator that combines up down volume analysis with Bull and Bear Power to provide a comprehensive view of market dynamics. It calculates Z-scores for up down volume delta and bull bear power measures, averages them, and then smoothes the result using Weighted Moving Average (WMA) for Bull and Bear Power and Volume Weighted Moving Average (VWMA) for Up and Down Volume Delta. The advantages include responsiveness to short-term trends, noise reduction through weighting, incorporation of volume information, and the ability to identify significant changes in buying and selling pressure. The indicator aims to offer clear signals for traders seeking insights into overall market dominance and indicate if the bulls or the bears have the upper hand.
Volume Analysis (Up/Down Volume Delta):
Up/Down Volume Delta reflects the net difference between buying and selling volume, providing insights into the prevailing market sentiment.
Positive Delta: Indicates potential bullish dominance due to higher buying volume.
Negative Delta: Suggests potential bearish dominance as selling volume surpasses buying volume.
Price Analysis (Bull and Bear Power):
Bull and Bear Power measure the strength of buying and selling forces based on price movements and the Exponential Moving Average (EMA) of the closing price.
Positive Bull Power: Reflects bullish dominance, indicating potential upward momentum.
Positive Bear Power: Suggests bearish dominance, indicating potential downward momentum.
Composite Bull Bear Dominance Index (CBBDI):
CBBDI combines the standardized Z-scores of Up/Down Volume Delta and Bull Bear Power, providing an average measure of both volume and price-related dominance.
Positive CBBDI: Indicates an overall bullish dominance in both volume and price dynamics.
Negative CBBDI: Suggests an overall bearish dominance in both volume and price dynamics.
Smoothing Techniques:
The use of Weighted Moving Average (WMA) for smoothing Bull and Bear Power Z-scores, and Volume Weighted Moving Average (VWMA) for smoothing Up/Down Volume Delta, reduces noise and provides a clearer trend signal.
Smoothing helps filter out short-term fluctuations and emphasizes more significant trends in both volume and price movements.
Color Coding:
CBBDI values are color-coded based on their direction, visually representing the prevailing market sentiment.
Green Colors: Positive values indicate potential bullish dominance.
Red Colors: Negative values suggest potential bearish dominance.
Hedge Coin M - Statistical Support and ResistanceHedge Coin M - Statistical Support and Resistance
Introduction
"Hedge Coin M - Statistical Support and Resistance" is a sophisticated, statistically-driven indicator designed specifically for traders in the COIN-M market on Binance. It offers a nuanced approach to identifying key market levels, focusing on the dynamics of support and resistance through advanced volatility analysis.
Foundation and Credits:
This script is an advanced adaptation of TradingView's standard code for the Bollinger Bands indicator. It extends the foundational concept of Bollinger Bands by integrating additional volatility metrics.
Calculation Method
This indicator employs Volume Weighted Moving Averages (VWMA) to create two distinct sets of Bollinger Bands, named BB-a and BB-b.
BB-a is derived from the VWMA of high prices, targeting potential resistance levels.
BB-b is based on the VWMA of low prices, aimed at identifying critical support levels.
Users can independently adjust the standard deviation (SD) multipliers for the upper and lower bands of both BB-a and BB-b, accommodating different market conditions.
Enhanced Volatility Analysis
The indicator calculates additional standard deviation lines for the upper band of BB-a and the lower band of BB-b. These lines provide deeper insights into market volatility.
Plotted Graphs
The primary plots include the upper and lower bands of BB-a and BB-b, marked in distinct colors for clarity.
Additional SD lines are plotted to indicate potential extended levels of support and resistance, offering traders a broader view of possible market movements.
Purpose and Usage
"Hedge Coin M - Statistical Support and Resistance" is designed to provide traders with a consistent, statistical method for identifying significant price levels.
It aids in scaling entry into positions, helping traders to navigate the COIN-M market with more informed decision-making.
This tool is especially useful for traders who combine long-term holding with swing trading strategies, offering a balanced approach to market engagement.
Integration and Adaptation
Easily integrate this indicator into your TradingView chart for the COIN-M market.
Use the insights provided to complement your overall trading strategy, particularly in identifying and reacting to significant market movements.
Disclaimer
Important Note: This indicator is provided for informational purposes only. It does not constitute financial advice, investment advice, trading advice, or any other sort of advice. Trading decisions should be made based on your own analysis, prudence, and judgment. Please be aware of the risks involved in trading and consult a financial advisor if necessary.

Advanced Volatility Oscillator with SignalsTitle: Advanced Volatility Oscillator with Signals (AVO-S)
In-Depth Description:
Introduction:
The Advanced Volatility Oscillator with Signals (AVO-S) is designed to offer traders a nuanced understanding of market volatility, combining traditional concepts with innovative visual aids and signal interpretation. This indicator is tailored for diverse financial markets, helping to identify potential trend reversals and momentum shifts.
Calculation and Methodology:
Spike Calculation: The core of AVO-S is the 'spike', calculated as the difference between the closing and opening prices (spike = close - open). This measure provides a straightforward gauge of intra-period volatility.
Standard Deviation: The indicator employs standard deviation to assess the variability of the 'spike', offering a dynamic threshold for understanding market extremities (stdDev = stdev(spike, length)).
Colored Columns: These columns visually represent the 'spike'. Their color changes based on the spike’s value relative to the zero line and the standard deviation threshold, providing an immediate visual cue of market state.
Blue Columns: Indicate moderate positive movement when the spike is above zero but below the standard deviation.
Green and Red Columns: Suggest stronger bullish (above standard deviation) and bearish (below negative standard deviation) movements, respectively.
Bullish and Bearish Signals:
The indicator generates signals based on the relationship between the 'spike' and its standard deviation.
Bullish Signals: Shown as upward triangles, these are formed when the 'spike' crosses above the standard deviation, indicating potential upward momentum.
Bearish Signals: Represented by downward triangles, these signals are generated when the 'spike' falls below the negative standard deviation, hinting at potential downward trends.
Usage and Application:
Traders can use the colored columns to quickly assess market sentiment and volatility.
The bullish and bearish signals serve as potential indicators for market entry or exit points, or for further analysis in conjunction with other technical tools.
Inspiration and Credits:
Inspired by Veryfid's original Volatility Oscillator, the AVO-S refines and builds upon these ideas to provide a comprehensive and user-friendly tool for market analysis. This indicator is a testament to the continuous evolution of technical analysis tools in the trading community.

Ehlers Combo Strategy🚀 Presenting the Enhanced Ehlers Combo Strategy 🚀
Hello Traders! 👋 I'm thrilled to share the latest version of the Ehlers Combo Strategy v2.0. This powerful algorithm combines Ehlers Elegant Oscillator, Decycler, Instantaneous Trendline, Spearman Rank, and introduces the Signal to Noise Ratio for even more precise trading signals.
📊 Strategy Highlights:
Ehlers Elegant Oscillator: Captures market momentum and turning points.
Ehlers Decycler: Filters out market noise for clearer trend signals.
Instantaneous Trendline: Offers a dynamic view of the market trend.
Spearman Rank: Analyzes market rank correlations for enhanced insights.
Signal to Noise Ratio (SNR): Filters out noise for more accurate signals.
💡 Key Features & Customizations:
Adaptive Length: Enable adaptive length based on the market's current conditions.
SNR Threshold: Set your desired SNR threshold for filtering signals.
Exit Length: Define the length for exit signals.
📈 Trading Signals:
Long Entry: Elegant Oscillator and Decycler cross above 0, source crosses above Decycler, source is greater than an increasing Instantaneous Trendline, Spearman Rank is positive, and SNR exceeds the threshold.
Long Exit: Source crosses below the Instantaneous Trendline after entering a long position.
Short Entry: Elegant Oscillator and Decycler cross below 0, source crosses below Decycler, source is less than a decreasing Instantaneous Trendline, Spearman Rank is negative, and SNR exceeds the threshold.
Short Exit: Source crosses above the Instantaneous Trendline after entering a short position.
📊 Insights & Enhancements:
Dynamic Length: The strategy adapts its length dynamically based on market conditions.
Improved SNR: Signal to Noise Ratio ensures better filtering of signals.
Enhanced Visualization: The Elegant Oscillator now features improved color coding for a clearer interpretation.
🚨 Disclaimer:
Trading involves risk, and this script should be used judiciously. It's not a guaranteed profit machine, but with careful use, it can be a valuable addition to your toolkit.
Feel free to backtest, tweak, and make it your own! Let's conquer the markets together! 💪📈
🚀✨ Happy Trading! ✨🚀
---
🙌 Credits:
A big shoutout to the original contributors:
@blackcat1402
@cheatcountry
@DasanC

Noa: Z-distance from VWAP with Kalman Smoother
Title: Noa: Z-distance from VWAP with Kalman Smoother
Description:
The "Z-distance from VWAP with Kalman Smoother" is a tool constructed on the premise that price evolves in distinct stages: normal or extreme trends (upward or downward) and transitional periods, termed as 'flips'. The Volume Weighted Average Price (VWAP) serves as a benchmark, representing the market's expectation of a fair value over a given time frame. However, since each stock trades on its unique price scale, direct comparisons are not feasible. This script introduces a standardized method, using the Z-score from the VWAP, to understand and compare these relationships across diverse scales.
Core Principles:
Stages of Price Movement:
- Prices don't move purely randomly; while they contain a random element, they oscillate in discernible patterns or stages—either maintaining a trend (normal or extreme) or undergoing transition (flip).
- VWAP as Fair Value: VWAP offers a dynamic representation of what the market perceives as fair value for a stock over a specific period.
- Standardizing Price Relations: Given the varied scales at which different stocks trade, a model was imperative to standardize these relations. The Z-score from the VWAP fulfills this role, offering a normalized measure of how far the price deviates from its perceived fair value.
Features:
Z-score Levels:
The indicator demarcates various stages of price movements, offering clarity on potential overbought or oversold conditions.
- Extreme Up Trend: Indicated when the Z-score surpasses the upper limit.
- Normal Up Trend: Represented when the Z-score lies between the flip upper and the upper limit.
- Transition (Flip): Recognized when the Z-score oscillates within the flip range.
- Normal Down Trend: Denoted when the Z-score is between the flip lower and the lower limit.
- Extreme Down Trend: Marked when the Z-score falls below the lower limit.
Visual Aids:
- Color-coded regions between specific Z-score levels and the Z-score plot itself elucidate the current market state.
- Kalman Filter: By incorporating a Kalman filter, the indicator offers a less noisy and smoother representation of the Z-score, enhancing its interpretability.
Usage:
Trend Analysis:
- The Z-score states and the color-coded plot facilitate a nuanced understanding of the prevailing market trend.
- Potential Reversal Points: Extremely positive or negative Z-scores might hint at impending reversals.
- Buy/Sell Signals: Z-score's interactions with the flip level can be interpreted as potential trading signals.
Example (for illustration purposes only):
AAPL since April 2022: The stock exited from a normal uptrend and transitioned potentially towards a downtrend. By the end of April, AAPL flipped twice before transitioning to a normal downtrend. By early May, the stock moved into an aggressive downtrend. Market buyers were able to counter this downtrend by June, but selling pressure persisted, pushing the stock back into an aggressive downtrend. By the end of June, buyers halted the aggressive selling and transitioned the stock from an aggressive to normal downtrend, then to a flip, and finally to a normal uptrend by the end of August. AAPL briefly peaked into an aggressive uptrend before being pressured back to a normal downtrend. The rest of 2022 saw AAPL attempting several short-lived uptrend flips. However, 2023 brought a change, with AAPL flipping into a normal uptrend by the end of January, maintaining it until August of that year.
Credits:
This script, inspired by Z distance from VWAP by LazyBear and Kalman Smoother by alexgrover, was revamped and enriched by nord-ouestadvisors to embed these core principles and heighten its usability. A special acknowledgment to ChatGPT by OpenAI for the guidance.

Supertrend x4 w/ Cloud FillSuperTrend is one of the most common ATR based trailing stop indicators.
The average true range (ATR) plays an important role in 'Supertrend' as the indicator uses ATR to calculate its value. The ATR indicator signals the degree of price volatility. In this version you can change the ATR calculation method from the settings. Default method is RMA, when the alternative method is SMA.
The indicator is easy to use and gives an accurate reading about an ongoing trend. It is constructed with two parameters, namely period and multiplier.
The implementation of 4 supertrends and cloud fills allows for a better overall picture of the higher and lower timeframe trend one is trading a particular security in.
The default values used while constructing a supertrend indicator is 10 for average true range or trading period.
The key aspect what differentiates this indicator is the Multiplier. The multiplier is based on how much bigger of a range you want to capture. In our case by default, it starts with 2.636 and 3.336 for Set 1 & Set 2 respectively giving a narrow band range or Short Term (ST) timeframe visual. On the other hand, the multipliers for Set 3 & Set 4 goes up to 9.736 and 8.536 for the multiplier respectively giving a large band range or Long Term (LT) timeframe visual.
A ‘Supertrend’ indicator can be used on equities, futures or forex, or even crypto markets and also on minutes, hourly, daily, and weekly charts as well, but generally, it fails in a sideways-moving market. That's why with this implementation it enables one to stay out of the market if they choose to do so when the market is ranging.
This Supertrend indicator is modelled around trends and areas of interest versus buy and sell signals. Therefore, to better understand this indicator, one must calibrate it to one's need first, which means day trader (shorter timeframe) vs swing trader (longer time frame), and then understand how it can be utilized to improve your entries, exits, risk and position sizing.
Example:
In this chart shown above using SPX500:OANDA, 15R Time Frame, we can see that there is at any give time 1 to 4 clouds/bands of Supertrends. These four are called Set 1, Set 2, Set 3 and Set 4 in the indicator. Set's 1 & 2 are considered short term, whereas Set's 3 & 4 are considered long term. The term short and long are subjective based on one's trading style. For instance, if a person is a 1min chart trader, which would be short term, to get an idea of the trend you would have to look at a longer time frame like a 5min for instance. Similarly, in this cases the timeframes = Multiplier value that you set.
Optional Ideas:
+ Apply some basic EMA/SMA indicator script of your choice for easier understanding of the trend or to allow smooth transition to using this indicator.
+ Split the chart into two vertical layouts and applying this same script coupled with xdecow's 2 WWV candle painting script on both the layouts. Now you can use the left side of the chart to show all bearish move candles only (make the bullish candles transparent) and do the opposite for the right side of the chart. This way you enhance focus to just stick to one side at a given time.
Credits:
This indicator is a derivative of the fine work done originally by KivancOzbilgic
Here is the source to his original indicator: ).
Disclaimer:
This indicator and tip is for educational and entertainment purposes only. This not does constitute to financial advice of any sort.

Tri-State SupertrendTri-State Supertrend: Buy, Sell, Range
( Credits: Based on "Pivot Point Supertrend" by LonesomeTheBlue.)
Tri-State Supertrend incorporates a range filter into a supertrend algorithm.
So in addition to the Buy and Sell states, we now also have a Range state.
This avoids the typical "whipsaw" problem: During a range, a standard supertrend algorithm will fire Buy and Sell signals in rapid succession. These signals are all false signals as they lead to losing positions when acted on.
In this case, a tri-state supertrend will go into Range mode and stay in this mode until price exits the range and a new trend begins.
I used Pivot Point Supertrend by LonesomeTheBlue as a starting point for this script because I believe LonesomeTheBlue's version is superior to the classic Supertrend algorithm.
This indicator has two additional parameters over Pivot Point Supertrend:
A flag to turn the range filter on or off
A range size threshold in percent
With that last parameter, you can define what a range is. The best value will depend on the asset you are trading.
Also, there are two new display options.
"Show (non-) trendline for ranges" - determines whether to draw the "trendline" inside of a range. Seeing as there is no trend in a range, this is usually just visual noise.
"Show suppressed signals" - allows you to see the Buy/Sell signals that were skipped by the range filter.
How to use Tri-State Supertrend in a strategy
You can use the Buy and Sell signals to enter positions as you would with a normal supertrend. Adding stop loss, trailing stop etc. is of course encouraged and very helpful. But what to do when the Range signal appears?
I currently run a strategy on LDO based on Tri-State Supertrend which appears to be profitable. (It will quite likely be open sourced at some point, but it is not released yet.)
In that strategy, I experimented with different actions being taken when the Range state is entered:
Continue: Just keep last position open during the range
Close: Close the last position when entering range
Reversal: During the range, execute the OPPOSITE of each signal (sell on "buy", buy on "sell")
In the backtest, it transpired that "Continue" was the most profitable option for this strategy.
How ranges are detected
The mechanism is pretty simple: During each Buy or Sell trend, we record price movement, specifically, the furthest move in the trend direction that was encountered (expressed as a percentage).
When a new signal is issued, the algorithm checks whether this value (for the last trend) is below the range size set by the user. If yes, we enter Range mode.
The same logic is used to exit Range mode. This check is performed on every bar in a range, so we can enter a buy or sell as early as possible.
I found that this simple logic works astonishingly well in practice.
Pros/cons of the range filter
A range filter is an incredibly useful addition to a supertrend and will most likely boost your profits.
You will see at most one false signal at the beginning of each range (because it takes a bit of time to detect the range); after that, no more false signals will appear over the range's entire duration. So this is a huge advantage.
There is essentially only one small price you have to pay:
When a range ends, the first Buy/Sell signal you get will be delayed over the regular supertrend's signal. This is, again, because the algorithm needs some time to detect that the range has ended. If you select a range size of, say, 1%, you will essentially lose 1% of profit in each range because of this delay.
In practice, it is very likely that the benefits of a range filter outweigh its cost. Ranges can last quite some time, equating to many false signals that the range filter will completely eliminate (all except for the first one, as explained above).
You have to do your own tests though :)

Yesterday's High v.17.07Yesterday’s High Breakout it is a trading system based on the analysis of yesterday's highs, it works in trend-following mode therefore it opens a long position at the breakout of yesterday's highs even if they occur several times in one day.
There are several methods for exiting a trade, each with its own unique strategy. The first method involves setting Take-Profit and Stop-Loss percentages, while the second utilizes a trailing-stop with a specified offset value. The third method calls for a conditional exit when the candle closes below a reference EMA.
Additionally, operational filters can be applied based on the volatility of the currency pair, such as calculating the percentage change from the opening or incorporating a gap to the previous day's high levels. These filters help to anticipate or delay entry into the market, mitigating the risk of false breakouts.
In the specific case of INJ, a 12% Take-Profit and a 1.5% Stop-Loss were set, with an activated trailing-stop percentage, TRL 1 and OFF 0.5.
To postpone entry and avoid false breakouts, a 1% gap was added to the price of yesterday's highs.
Name: Yesterday's High Breakout - Trend Follower Strategy
Author: @tumiza999
Category: Trend Follower, Breakout of Yesterday's High.
Operating mode: Spot or Futures (only long).
Trade duration: Intraday.
Timeframe: 30M, 1H, 2H, 4H
Market: Crypto
Suggested usage: Short-term trading, when the market is in trend and it is showing high volatility.
Entry: When there is a breakout of Yesterday's High.
Exit: Profit target or Trailing stop, Stop loss or Crossunder EMA.
Configuration:
- Gap to anticipate or postpone the entry before or after the identified level
- Rate of Change for Entry Condition
- Take Profit, Stop Loss and Trailing Stop
- EMA length
Backtesting:
⁃ Exchange: BINANCE
⁃ Pair: INJUSDT
⁃ Timeframe: 4H
- Treshold: 1
- Gap%: 1
- SL: 1.5
- TP:12
- TRL: 1
- OFF-TRL: 0.5
⁃ Fee: 0.075%
⁃ Slippage: 1
- Initial Capital: 10000 USDT
- Position sizing: 10% of Equity
- Start : 2018-07-26 (Out Of Sample from 2022-12-23)
- Bar magnifier: on
Credits: LucF for Pine Coders (f_security function to avoid repainting using security)
Disclaimer: Risk Management is crucial, so adjust stop loss to your comfort level. A tight stop loss can help minimise potential losses. Use at your own risk.
How you or we can improve? Source code is open so share your ideas!
Leave a comment and smash the boost button!
Thanks for your attention, happy to support the TradingView community.

Price Legs: Average Heights; 'Smart ATR'Price Legs: Average Heights; 'Smart ATR'. Consol Range Gauge
~~ Indicator to show small and large price legs (based on short and long input pivot lengths), and calculating the average heights of these price legs; counting legs from user-input start time ~~
//Premise: Wanted to use this as something like a 'Smart ATR': where the average/typical range of a distinct & dynamic price leg could be calculated based on a user-input time interval (as opposed to standard ATR, which is simply the average range over a consistent repeating period, with no regard to market structure). My instinct is that this would be most useful for consolidated periods & range trading: giving the trader an idea of what the typical size of a price leg might be in the current market state (hence in the title, Consol Range gauge)
//Features & User inputs:
-Start time: confirm input when loading indicator by clicking on the chart. Then drag the vertical line to change start time easily.
-Large Legs (toggle on/off) and user-input pivot lookback/lookforward length (larger => larger legs)
-Small Legs (toggle on/off) and user-input pivot lookback/lookforward length (smaller => smaller legs)
-Display Stats table: toggle on/off: simple view- shows the averages of large (up & down), small (up & down), and combined (for each).
-Extended stats table: toggle on/off option to show the averages of the last 3 legs of each category (up/down/large/small/combined)
-Toggle on/off Time & Price chart text labels of price legs (time in mins/hours/days; price in $ or pips; auto assigned based on asset)
-Table position: user choice.
//Notes & tips:
-Using custom start time along with replay mode, you can select any arbitrary chunk of price for the purpose of backtesting.
-Play around with the pivot lookback lengths to find price legs most suitable to the current market regime (consolidating/trending; high volatility/ low volatility)
-Single bar price legs will never be counted: they must be at least 2 bars from H>>L or L>>H.
//Credits: Thanks to @crypto_juju for the idea of applying statistics to this simple price leg indicator.
Simple View: showing only the full averages (counting from Start time):
View showing ONLY the large legs, with Time & Price labels toggled ON:

VolatilityIndicatorsLibrary "VolatilityIndicators"
This is a library of Volatility Indicators .
It aims to facilitate the grouping of this category of indicators, and also offer the customized supply of
the parameters and sources, not being restricted to just the closing price.
@Thanks and credits:
1. Dynamic Zones: Leo Zamansky, Ph.D., and David Stendahl
2. Deviation: Karl Pearson (code by TradingView)
3. Variance: Ronald Fisher (code by TradingView)
4. Z-score: Veronique Valcu (code by HPotter)
5. Standard deviation: Ronald Fisher (code by TradingView)
6. ATR (Average True Range): J. Welles Wilder (code by TradingView)
7. ATRP (Average True Range Percent): millerrh
8. Historical Volatility: HPotter
9. Min-Max Scale Normalization: gorx1
10. Mean Normalization: gorx1
11. Standardization: gorx1
12. Scaling to unit length: gorx1
13. LS Volatility Index: Alexandre Wolwacz (Stormer), Fabrício Lorenz, Fábio Figueiredo (Vlad) (code by me)
14. Bollinger Bands: John Bollinger (code by TradingView)
15. Bollinger Bands %: John Bollinger (code by TradingView)
16. Bollinger Bands Width: John Bollinger (code by TradingView)
dev(source, length, anotherSource)
Deviation. Measure the difference between a source in relation to another source
Parameters:
source (float)
length (simple int) : (int) Sequential period to calculate the deviation
anotherSource (float) : (float) Source to compare
Returns: (float) Bollinger Bands Width
variance(src, mean, length, biased, degreesOfFreedom)
Variance. A statistical measurement of the spread between numbers in a data set. More specifically,
variance measures how far each number in the set is from the mean (average), and thus from every other number in the set.
Variance is often depicted by this symbol: σ2. It is used by both analysts and traders to determine volatility and market security.
Parameters:
src (float) : (float) Source to calculate variance
mean (float) : (float) Mean (Moving average)
length (simple int) : (int) The sequential period to calcule the variance (number of values in data set)
biased (simple bool) : (bool) Defines the type of standard deviation. If true, uses biased sample variance (n),
degreesOfFreedom (simple int) : (int) Degrees of freedom. The number of values in the final calculation of a statistic that are free to vary.
Default value is n-1, where n here is length. Only applies when biased parameter is defined as true.
Returns: (float) Standard deviation
stDev(src, length, mean, biased, degreesOfFreedom)
Measure the Standard deviation from a source in relation to it's moving average.
In this implementation, you pass the average as a parameter, allowing a more personalized calculation.
Parameters:
src (float) : (float) Source to calculate standard deviation
length (simple int) : (int) The sequential period to calcule the standard deviation
mean (float) : (float) Moving average.
biased (simple bool) : (bool) Defines the type of standard deviation. If true, uses biased sample variance (n),
else uses unbiased sample variance (n-1 or another value, as long as it is in the range between 1 and n-1), where n=length.
degreesOfFreedom (simple int) : (int) Degrees of freedom. The number of values in the final calculation of a statistic that are free to vary.
Default value is n-1, where n here is length.
Returns: (float) Standard deviation
zscore(src, mean, length, biased, degreesOfFreedom)
Z-Score. A z-score is a statistical measurement that indicates how many standard deviations a data point is from
the mean of a data set. It is also known as a standard score. The formula for calculating a z-score is (x - μ) / σ,
where x is the individual data point, μ is the mean of the data set, and σ is the standard deviation of the data set.
Z-scores are useful in identifying outliers or extreme values in a data set. A positive z-score indicates that the
data point is above the mean, while a negative z-score indicates that the data point is below the mean. A z-score of
0 indicates that the data point is equal to the mean.
Z-scores are often used in hypothesis testing and determining confidence intervals. They can also be used to compare
data sets with different units or scales, as the z-score standardizes the data. Overall, z-scores provide a way to
measure the relative position of a data point in a data
Parameters:
src (float) : (float) Source to calculate z-score
mean (float) : (float) Moving average.
length (simple int) : (int) The sequential period to calcule the standard deviation
biased (simple bool) : (bool) Defines the type of standard deviation. If true, uses biased sample variance (n),
else uses unbiased sample variance (n-1 or another value, as long as it is in the range between 1 and n-1), where n=length.
degreesOfFreedom (simple int) : (int) Degrees of freedom. The number of values in the final calculation of a statistic that are free to vary.
Default value is n-1, where n here is length.
Returns: (float) Z-score
atr(source, length)
ATR: Average True Range. Customized version with source parameter.
Parameters:
source (float) : (float) Source
length (simple int) : (int) Length (number of bars back)
Returns: (float) ATR
atrp(length, sourceP)
ATRP (Average True Range Percent)
Parameters:
length (simple int) : (int) Length (number of bars back) for ATR
sourceP (float) : (float) Source for calculating percentage relativity
Returns: (float) ATRP
atrp(source, length, sourceP)
ATRP (Average True Range Percent). Customized version with source parameter.
Parameters:
source (float) : (float) Source for ATR
length (simple int) : (int) Length (number of bars back) for ATR
sourceP (float) : (float) Source for calculating percentage relativity
Returns: (float) ATRP
historicalVolatility(lengthATR, lengthHist)
Historical Volatility
Parameters:
lengthATR (simple int) : (int) Length (number of bars back) for ATR
lengthHist (simple int) : (int) Length (number of bars back) for Historical Volatility
Returns: (float) Historical Volatility
historicalVolatility(source, lengthATR, lengthHist)
Historical Volatility
Parameters:
source (float) : (float) Source for ATR
lengthATR (simple int) : (int) Length (number of bars back) for ATR
lengthHist (simple int) : (int) Length (number of bars back) for Historical Volatility
Returns: (float) Historical Volatility
minMaxNormalization(src, numbars)
Min-Max Scale Normalization. Maximum and minimum values are taken from the sequential range of
numbars bars back, where numbars is a number defined by the user.
Parameters:
src (float) : (float) Source to normalize
numbars (simple int) : (int) Numbers of sequential bars back to seek for lowest and hightest values.
Returns: (float) Normalized value
minMaxNormalization(src, numbars, minimumLimit, maximumLimit)
Min-Max Scale Normalization. Maximum and minimum values are taken from the sequential range of
numbars bars back, where numbars is a number defined by the user.
In this implementation, the user explicitly provides the desired minimum (min) and maximum (max) values for the scale,
rather than using the minimum and maximum values from the data.
Parameters:
src (float) : (float) Source to normalize
numbars (simple int) : (int) Numbers of sequential bars back to seek for lowest and hightest values.
minimumLimit (simple float) : (float) Minimum value to scale
maximumLimit (simple float) : (float) Maximum value to scale
Returns: (float) Normalized value
meanNormalization(src, numbars, mean)
Mean Normalization
Parameters:
src (float) : (float) Source to normalize
numbars (simple int) : (int) Numbers of sequential bars back to seek for lowest and hightest values.
mean (float) : (float) Mean of source
Returns: (float) Normalized value
standardization(src, mean, stDev)
Standardization (Z-score Normalization). How "outside the mean" values relate to the standard deviation (ratio between first and second)
Parameters:
src (float) : (float) Source to normalize
mean (float) : (float) Mean of source
stDev (float) : (float) Standard Deviation
Returns: (float) Normalized value
scalingToUnitLength(src, numbars)
Scaling to unit length
Parameters:
src (float) : (float) Source to normalize
numbars (simple int) : (int) Numbers of sequential bars back to seek for lowest and hightest values.
Returns: (float) Normalized value
lsVolatilityIndex(movingAverage, sourceHvol, lengthATR, lengthHist, lenNormal, lowerLimit, upperLimit)
LS Volatility Index. Measures the volatility of price in relation to an average.
Parameters:
movingAverage (float) : (float) A moving average
sourceHvol (float) : (float) Source for calculating the historical volatility
lengthATR (simple int) : (float) Length for calculating the ATR (Average True Range)
lengthHist (simple int) : (float) Length for calculating the historical volatility
lenNormal (simple int) : (float) Length for normalization
lowerLimit (simple int)
upperLimit (simple int)
Returns: (float) LS Volatility Index
lsVolatilityIndex(sourcePrice, movingAverage, sourceHvol, lengthATR, lengthHist, lenNormal, lowerLimit, upperLimit)
LS Volatility Index. Measures the volatility of price in relation to an average.
Parameters:
sourcePrice (float) : (float) Source for measure the distance
movingAverage (float) : (float) A moving average
sourceHvol (float) : (float) Source for calculating the historical volatility
lengthATR (simple int) : (float) Length for calculating the ATR (Average True Range)
lengthHist (simple int) : (float) Length for calculating the historical volatility
lenNormal (simple int)
lowerLimit (simple int)
upperLimit (simple int)
Returns: (float) LS Volatility Index
bollingerBands(src, length, mult, basis)
Bollinger Bands. A Bollinger Band is a technical analysis tool defined by a set of lines plotted
two standard deviations (positively and negatively) away from a simple moving average (SMA) of the security's price,
but can be adjusted to user preferences. In this version you can pass a customized basis (moving average), not only SMA.
Parameters:
src (float) : (float) Source to calculate standard deviation used in Bollinger Bands
length (simple int) : (int) The time period to be used in calculating the standard deviation
mult (simple float) : (float) Multiplier used in standard deviation. Basically, the upper/lower bands are standard deviation multiplied by this.
basis (float) : (float) Basis of Bollinger Bands (a moving average)
Returns: (float) A tuple of Bollinger Bands, where index 1=basis; 2=basis+dev; 3=basis-dev; and dev=multiplier*stdev
bollingerBands(src, length, aMult, basis)
Bollinger Bands. A Bollinger Band is a technical analysis tool defined by a set of lines plotted
two standard deviations (positively and negatively) away from a simple moving average (SMA) of the security's price,
but can be adjusted to user preferences. In this version you can pass a customized basis (moving average), not only SMA.
Also, various multipliers can be passed, thus getting more bands (instead of just 2).
Parameters:
src (float) : (float) Source to calculate standard deviation used in Bollinger Bands
length (simple int) : (int) The time period to be used in calculating the standard deviation
aMult (float ) : (float ) An array of multiplies used in standard deviation. Basically, the upper/lower bands are standard deviation multiplied by this.
This array of multipliers permit the use of various bands, not only 2.
basis (float) : (float) Basis of Bollinger Bands (a moving average)
Returns: (float ) An array of Bollinger Bands, where:
index 1=basis; 2=basis+dev1; 3=basis-dev1; 4=basis+dev2, 5=basis-dev2, 6=basis+dev2, 7=basis-dev2, Nup=basis+devN, Nlow=basis-devN
and dev1, dev2, devN are ```multiplier N * stdev```
bollingerBandsB(src, length, mult, basis)
Bollinger Bands %B - or Percent Bandwidth (%B).
Quantify or display where price (or another source) is in relation to the bands.
%B can be useful in identifying trends and trading signals.
Calculation:
%B = (Current Price - Lower Band) / (Upper Band - Lower Band)
Parameters:
src (float) : (float) Source to calculate standard deviation used in Bollinger Bands
length (simple int) : (int) The time period to be used in calculating the standard deviation
mult (simple float) : (float) Multiplier used in standard deviation
basis (float) : (float) Basis of Bollinger Bands (a moving average)
Returns: (float) Bollinger Bands %B
bollingerBandsB(src, length, aMult, basis)
Bollinger Bands %B - or Percent Bandwidth (%B).
Quantify or display where price (or another source) is in relation to the bands.
%B can be useful in identifying trends and trading signals.
Calculation
%B = (Current Price - Lower Band) / (Upper Band - Lower Band)
Parameters:
src (float) : (float) Source to calculate standard deviation used in Bollinger Bands
length (simple int) : (int) The time period to be used in calculating the standard deviation
aMult (float ) : (float ) Array of multiplier used in standard deviation. Basically, the upper/lower bands are standard deviation multiplied by this.
This array of multipliers permit the use of various bands, not only 2.
basis (float) : (float) Basis of Bollinger Bands (a moving average)
Returns: (float ) An array of Bollinger Bands %B. The number of results in this array is equal the numbers of multipliers passed via parameter.
bollingerBandsW(src, length, mult, basis)
Bollinger Bands Width. Serve as a way to quantitatively measure the width between the Upper and Lower Bands
Calculation:
Bollinger Bands Width = (Upper Band - Lower Band) / Middle Band
Parameters:
src (float) : (float) Source to calculate standard deviation used in Bollinger Bands
length (simple int) : (int) Sequential period to calculate the standard deviation
mult (simple float) : (float) Multiplier used in standard deviation
basis (float) : (float) Basis of Bollinger Bands (a moving average)
Returns: (float) Bollinger Bands Width
bollingerBandsW(src, length, aMult, basis)
Bollinger Bands Width. Serve as a way to quantitatively measure the width between the Upper and Lower Bands
Calculation
Bollinger Bands Width = (Upper Band - Lower Band) / Middle Band
Parameters:
src (float) : (float) Source to calculate standard deviation used in Bollinger Bands
length (simple int) : (int) Sequential period to calculate the standard deviation
aMult (float ) : (float ) Array of multiplier used in standard deviation. Basically, the upper/lower bands are standard deviation multiplied by this.
This array of multipliers permit the use of various bands, not only 2.
basis (float) : (float) Basis of Bollinger Bands (a moving average)
Returns: (float ) An array of Bollinger Bands Width. The number of results in this array is equal the numbers of multipliers passed via parameter.
dinamicZone(source, sampleLength, pcntAbove, pcntBelow)
Get Dynamic Zones
Parameters:
source (float) : (float) Source
sampleLength (simple int) : (int) Sample Length
pcntAbove (simple float) : (float) Calculates the top of the dynamic zone, considering that the maximum values are above x% of the sample
pcntBelow (simple float) : (float) Calculates the bottom of the dynamic zone, considering that the minimum values are below x% of the sample
Returns: A tuple with 3 series of values: (1) Upper Line of Dynamic Zone;
(2) Lower Line of Dynamic Zone; (3) Center of Dynamic Zone (x = 50%)
Examples:

Momentum PlayTraders always need a confirmation of momentum in price action to ride the swings.
Momentum Play Indicator consists of the below:
Bullish Conditions :
1)EMA 8 above EMA 34 and rising
2)Candle close above 5 candle high
3) RSI above 60
4) Volume above 5 candles avg. volume
5) ADX above 20
Bearish Conditions :
1)EMA 8 below EMA 34 and falling
2)Candle close below 5 candle low
3) RSI below 40
4) Volume above 5 candles avg. volume
5) ADX above 20
Traders can change the inputs as per their liking to adjust as per their comfortable timeframe.
Credits: Special Thanks to Mr. DTBHAT for sharing the above conditions.

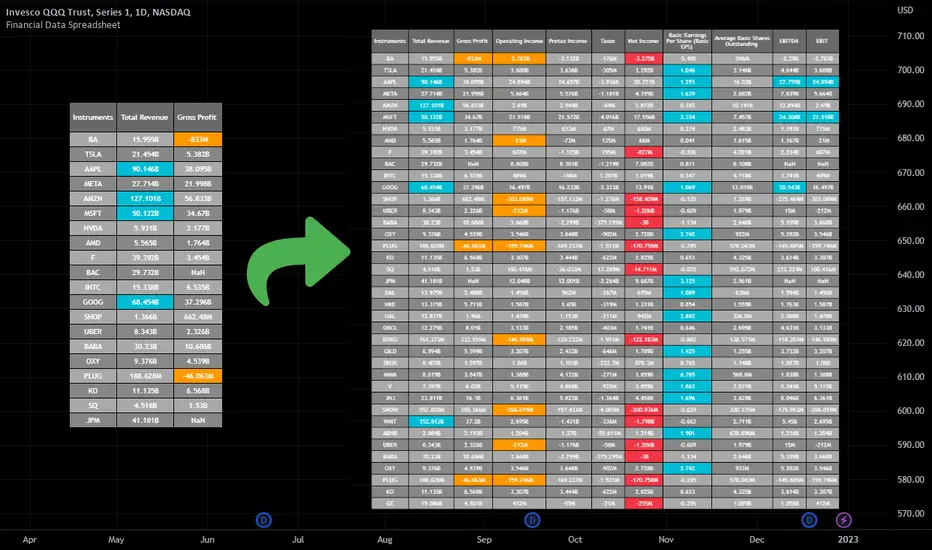
Financial Data Spreadsheet [By MUQWISHI]The Financial Data Spreadsheet indicator displays tables in the form of a spreadsheet containing a set of selected financial performances of a company within the most recent reported period. Analyzing Financial data is one of the classic methods to evaluate whether the company’s stock price is overvalued or undervalued based on its income statement, balance sheet, and cash flow statement. This indicator might be practical to investors to collect needed data of a company to analyze and compare it with other companies on a TradingView chart or print it in spreadsheet form.
█ OVERVIEW
█ BEST PRACTICES
Due to strict limitations on calling request.financial() function, I tried to develop the table with the best ways to be more dynamic to move and the ability to join multiple tables into a spreadsheet. Users can add up to 20 instruments and 2 financial metrics per table. However, it’s possible to add many tables with other financial metrics, then connect them to the main table.
Credits: The idea of joining multiple tables inspired by @QuantNomad Screener for 40+ instruments
█ INDICATOR SETTINGS
1- Moving Table toward right-left up-down from its origin.
2- Hiding Column Title checkmark. Useful for adding a joined table underneath with additional instruments.
3- Hiding Instruments Title checkmark. Useful for adding a joined table on the right with other financial metrics.
4- Shade Alternate Rows checkmark. I believe it’ll make the table easier to read.
5- Selecting Financial Period. (Year, Quarter).
6- Entering a currency.
7- Choosing a financial ID for each column. There’re over 200 financial IDs. Source: What financial data is available in Pine? — TradingView
8- Optional to highlight values in between.
9- Entering the ticker’s symbol with the ability to activate/deactivate.
█ TIP
For best technical performance, use the indicator in a 1D timeframe.
Please let me know if you have any questions.
Thank you.
[Pt] TICK + Heikin Ashi RSI IndicatorThis indicator combines NYSE TICK and RSI to aim to provide a view of NYSE market trend strength.
What is TICK
NYSE TICK, also known as the TICK index, is a technical analysis indicator that shows the number of stocks on the New York Stock Exchange (NYSE) that are trading on an uptick or a downtick in a particular period of time. The TICK index is calculated by subtracting the number of stocks trading on a downtick from the number of stocks trading on an uptick. A reading of +1000 on the TICK index, for example, would indicate that there are 1000 more stocks trading on an uptick than on a downtick. The TICK index is often used as a measure of market sentiment, as it can provide insight into whether there is more buying or selling pressure in the market at a given time. A high TICK index reading may suggest that there is strong buying pressure, while a low TICK index reading may indicate that there is more selling pressure in the market.
By default, I am using -800 and 800 for oversold and overbought levels. These are configurable. Also, this indicator includes TICK divergence signals.
The TICK index is usually very volatile, so this indicator is best suited for lower timeframes, such as 1 to 5 min charts.
Idea of TICK neutral zone
As part of this indicator I've identified what I consider as "neutral" range for the TICK. Based on my own personal experience, the market tends to be in consolidation or choppy in this range. By default, I've defined this range to be -200 to 200. This range is configurable.
Signals
In combination with RSI and Heikin Ashi RSI (HARSI), which help smooths out the RSI values and make it easier to identify trends and potential reversal points, this indicator aims to generate Bullish vs Bearish signals based on the following conditions:
- bullish / bearish HARSI candle
- Inside bar on HARSI candle
- TICK trend (above or below Neutral zone)
- RSI trend (above or below 0, but not overbought or oversold)
- RSI / HARSI convergence and divergence
When all bullish conditions are met, the signal turns bright green. Bright red when all bearish conditions are met. These generated signals aims to provide users easy to read visual cues to help with their trades.
A table is also provided in attempt to identify the trend in real time:
TICK trend:
- Bullish, Extended
- Bullish
- Neutral w/ Bullish bias
- Neutral w/ Bearish bias
- Bearish
- Bearish, Extended
RSI:
- Bullish
- Bearish
Note on scale
This indicator is based on the scale for TICK, hence the RSI and HARSI are scaled. By default, standard overbought RSI value of 70 = 800 on this scale, whereas oversold value of 30 = -800.
Credits:
Heikin Ashi RSI code was borrowed from @JayRogers - Heikin Ashi RSI Oscillator

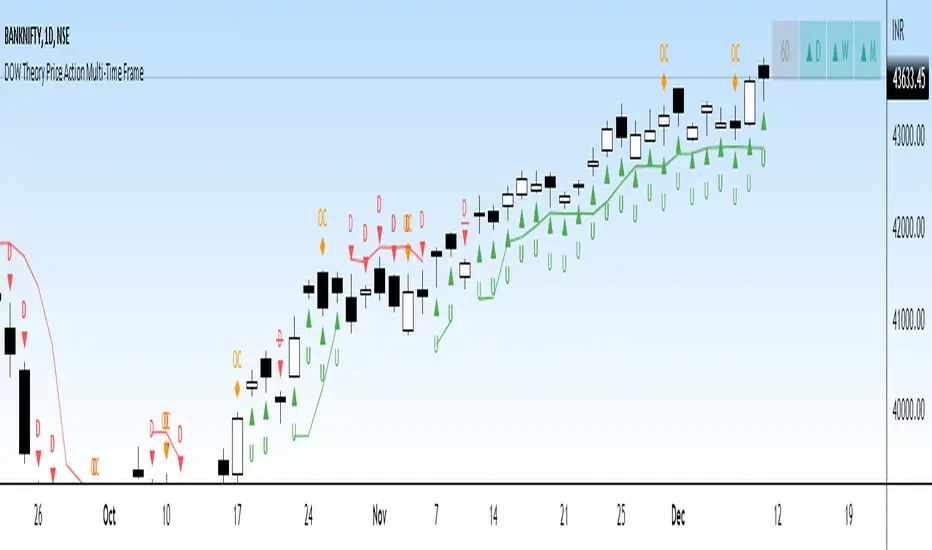
DOW Theory Price Action Multi-Time FrameThis indicator gives a visual representation of Dow Theory Price action based trend analysis and provides trader a table with 4 different timeframe to align with the trend.
It will help traders identify if it is an ongoing Impulse Wave or a Corrective Wave.
3 rules for Bullish Price Action setup (Uptrend or continuation of existing UpTrend): Denoted by 'U' below the candlestic
HH - Higher High
HL - Higher Low
CAH - Close above prior High
3 rules for Bearish Price Action setup (Downtrend or continuation of existing DownTrend): Denoted by 'D' below the candlestic
LH - Lower High
HL - LowerLow
CAH - Close below prior Low
Exception - Outside Candle: Denoted by 'OC' above the candlestic
Outside reversal is a two-day price pattern that shows when a candle or bar on a candlestick or bar chart falls “outside” of the previous day's candle or bar.
The table posistion can be set be user from the input settings as per his screen setting / resolution.
The trailing line can is also customizable from inputs, recomended value is 3-4.
Ideation Credits: Mr. Vineet Jain
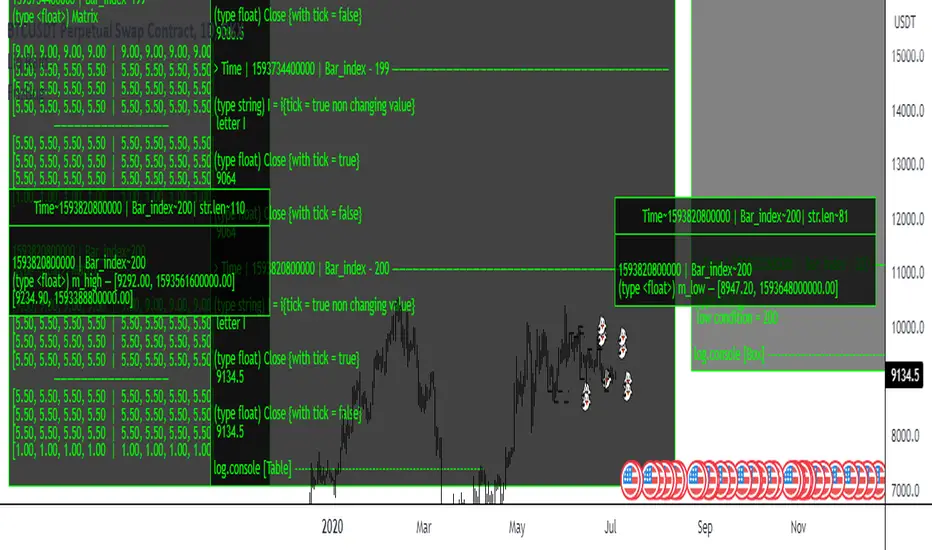
FrizBugLibrary "FrizBug"
Debug Tools | Pinescript Debugging Tool Kit
All in one Debugger - the benefit of wrapper functions to simply wrap variables or outputs and have the code still execute the same. Perfect for Debugging on Pine
str(inp)
Overloaded tostring like Function for all type+including Object Variables will also do arrays and matricies of all Types
Parameters:
inp : All types
Returns: string
print_label(str, x_offset, y, barstate, style, color, textcolor, text_align, size)
Label Helper Function - only needs the Str input to work
Parameters:
str :
x_offset : offset from last bar + or -
y : price of label
barstate : barstate built in variable
style : label style settin7
color : color setting
textcolor : textcolor
text_align : text align setting
size : text_sise
Returns: label
init()
initializes the database arrays
Returns: tuple | 2 matrix (1 matrix is varip(live) the other is reagular var (Bar))
update(log, live, live_console, log_console, live_lbl, log_lbl)
Put at the very end of your code / This updates all of the consoles
Parameters:
log : This matrix is the one used for Bar updates
live : This matrix is the one used for Real Time updates
live_console : on_offs for the consoles and lbls - call in the update function
log_console : on_offs for the consoles and lbls - call in the update function
live_lbl : on_offs for the consoles and lbls - call in the update function
log_lbl : on_offs for the consoles and lbls - call in the update function
Returns: void
log(log, inp, str_label, off, rows, index_cols, bars_back)
Function Will push to the Console offset to the right of Current bar, This is the main Console - it has 2 Feeds left and right (changeable)"
Parameters:
log : Matrix - Log or Live
inp : All types
str_label : (optional) This input will label it on the feed
off : Useful for when you don't want to remove the function"
rows : when printing or logging a matrix this will shorten the output will show last # of rows"
index_cols : When printing or logging a array or matrix this will shorten the array or the columns of a matrix by the #"
bars_back : Adjustment for Bars Back - Default is 1 (0 for barstate.islast)"
Returns: inp - all types (The log and print functions can be used as wrapper functions see usage below for examples)
Print(log, str_label, off, bars_back)
Function can be used to send information to a label style Console, Can be used as a wrapper function, Similar to str.format use with str()
Parameters:
log :
str_label : (optional) Can be used to label Data sent to the Console
off : Useful for when you don't want to remove the function
bars_back : Adjustment for Bars Back - Default is 1 (0 for barstate.islast)
Returns: string
print(inp, str_label, off, bars_back)
This Function can be used to send information to a label style Console, Can be used as a wrapper function, Overload print function
Parameters:
inp : All types
str_label : string (optional) Can be used to label Data sent to the Console
off : Useful for when you don't want to remove the function
bars_back : Adjustment for Bars Back - Default is 1 (0 for barstate.islast)
Returns: inp - all types (The log and print functions can be used as wrapper functions see usage below for examples)
Credits:
@kaigouthro - for the font library
@RicardoSantos - for the concept I used to make this
Thanks!
Use cases at the bottom
DR/IDR V1Defining Range DR and Implied Defining Range IDR for regular Session and overnight Session
This script is showing the IDR and DR for the regular trading session and for the overnight session based on the rules from the creator of the DR/IDR concept.
It works for all major Forex Pairs, BTC, ETH and the US Equity indices. This concept is based on rules and has a 80 % probability to be correct.
It should be applied in the 5 Min. Timeframe.
The timings for the RDR are from 09.30 - 10.30 am New York local time.
The timings for the ODR are from 03.00 - 04.00 am New York local time.
Rules:
1. If price in the 5 Min timeframe closes above the DR high after 10.30 am or 04.00 am then the DR low will be with 80 percent probability the low of the trading session. This is called confirmation.
2. If price in the 5 Min timeframe closes below the DR low after 10.30 am or 04.00 am then the DR high will be with 80 percent probability the high of the trading session. This is called confirmation.
3. If price closes above the IDR high after 10.30 am or 04.00 am it is an early indication that the low of the DR will be the low of the day and vice versa.
Credits:
This script imports the recently published (VisibleChart) library containing functions that return values calculated from the range of visible bars on the chart.
bmistiaen helped me a lot with this script. Thank you a lot.

Crypto and FX PSCA simple tool to calculate crypto position size and FX lot size.
How to use:
1. Use TradingView measurement tool or position tool to know how wide is your stop loss.
2. Set the equity and risk parameters.
2. For crypto, input the PERCENTAGE in stop loss;
For FX, input the PIPS.
3. Position size will be displayed in the panel.
Notes:
>Position size is in USDT for Cryptocurrencies
>Lot size for forex.
Forex contract size is your account type set by the broker:
Standard = 100,000 units = ~$10/pip
Mini = 10,000 units = ~$1/pip
Micro = 1,000 units = ~$0.10/pip
Nano = 100 units = ~$0. 01/pip
Credits:
trananhvu149
hanabil

Rainbow ChannelI have designed this indicator with the idea of staying focused on the price during the corresponding trend, for this I have built a rainbow channel
The upper part of the channel is painted in colors during the uptrend, at this time the lower part turns gray to focus only on the longs signals
The lower part of the channel is painted in colors during the downtrend, at this time the upper part turns gray to focus only on the shorts signals
The signals are followed by a mark that indicates when to close that trade.
The indicator works with all timeframes, I use it on the 1 hour chart and I do the trades in 1 minute.
CREDITS:
- @DonovanWall for his study "Gaussian Channel " included in this script
- @Alex Orekhov (everget) for his study "HalfTrend" included in this script

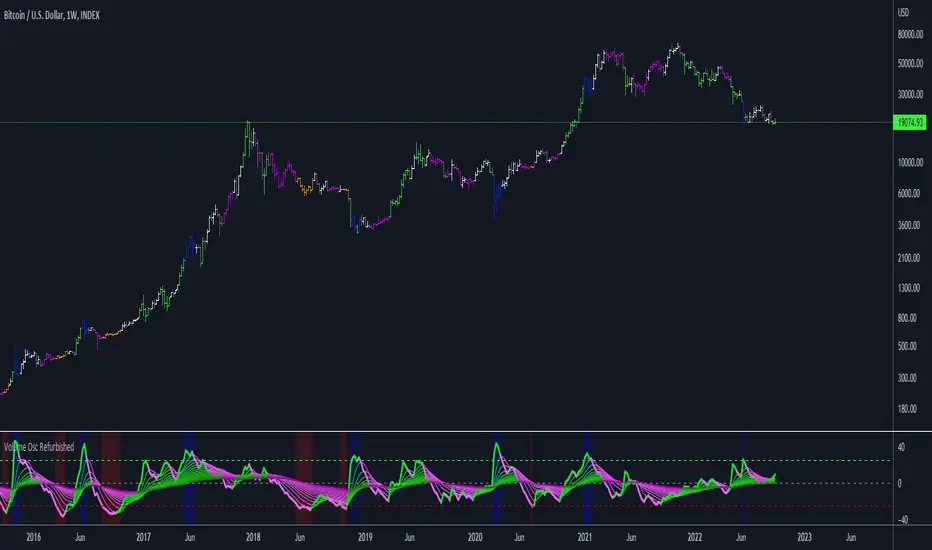
Volume Oscillator RefurbishedThis is an experimental version of Volume Oscillator.
For more information about Volume Oscillator, please access the link below:
www.tradingview.com
Objective
The script presented here provides some improvements over the original indicator, namely:
Show multiple moving averages;
Color the bars according to the direction of the averages;
Color the bars when reaching predefined limits.
Below is the print comparing with the original indicator:
Thanks and credits:
Volume Oscillator: TradingView
Moving Averages: PineCoders, CrackingCryptocurrency, MightyZinger, Alex Orekhov (everget), alexgrover, paragjyoti2012, Franklin Moormann (cheatcountry)
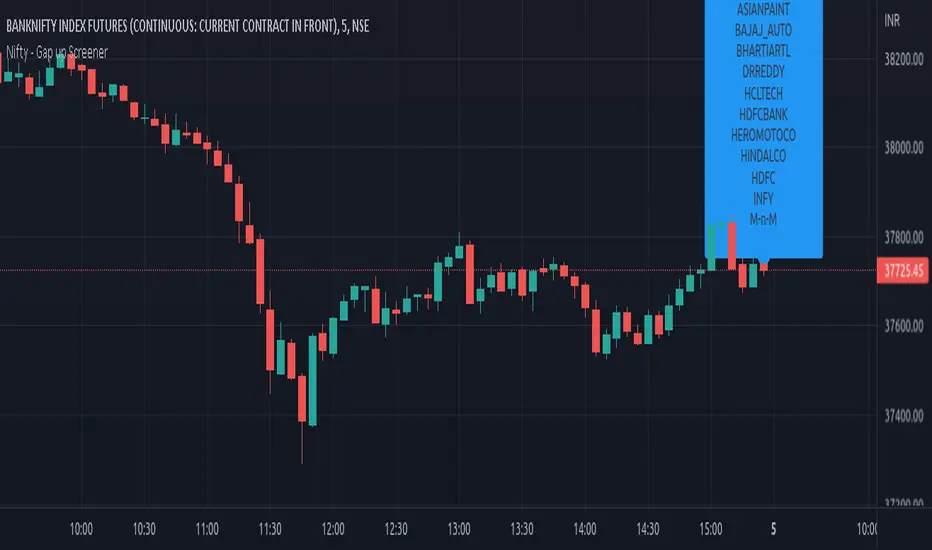
Nifty - Gap up Screener
Sample Stock Screener NSE is used to identify the list of Gap up Stocks from provided list. Modify script for other conditions
original credits: achalmeena ( )
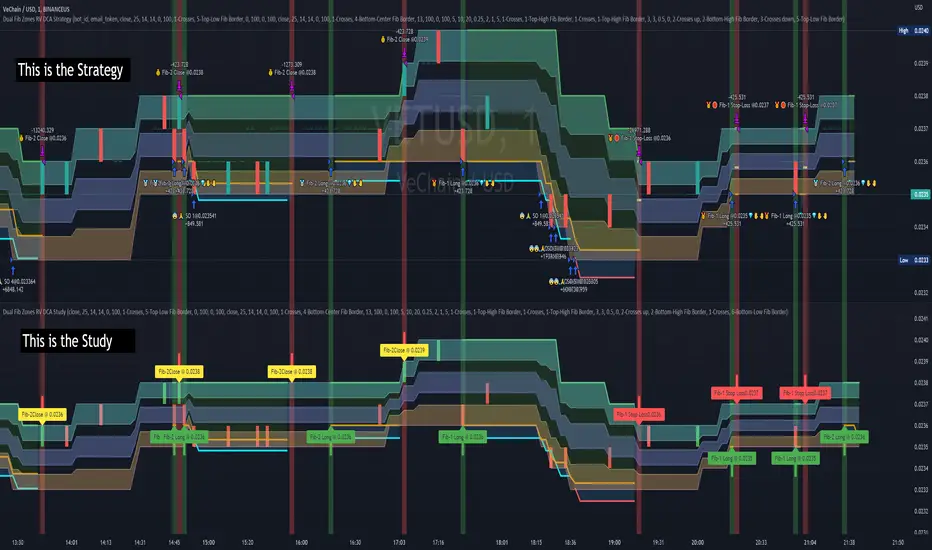
Dual Fibonacci Zones & Ranged Vol DCA Study - R3c0nTraderWhat does this do?
This signal script (aka Study) was created so it could be used with the corresponding strategy "Dual Fibonacci Zone & Ranged Vol DCA Strategy - R3c0nTrader" to create the buy and sell signals for 3Commas bots.
How to Use
Configure the study to match your settings you have set in the strategy. This script comes with an buy and sell alert conditions built-in. Just click to add alert and select Buy or Sell and paste in your bot messages.
Credits:
Thank you "EvoCrypto" for granting me permission to use "Ranged Volume" to create this study
Thank you "eykpunter" for granting me permission to use "Fibonacci Zones" to create this study
Dual Fibonacci Zone & Ranged Vol DCA Strategy - R3c0nTraderWhat does this do?
This is for educational purposes and allows one to backtest two Fibonacci Zones simultaneously. This also includes an option for Ranged Volume as a parameter.
Pre-requisites:
First off, this is a Long only strategy as I wrote it with DCA in mind. It cannot be used for shorting. Shorting defeats the purpose of a DCA bot which has a goal that is Long a position not Short a position. If you want to short, there are plenty of free scripts out there that do this.
You must have some base knowledge or experience with Fibonacci trading, understanding what is ADX, +DI (and -DI), etc.
You can use this script without a 3Commas account and see how 3Commas DCA Bot would perform. However, I highly recommend inexperienced uses get a free account and going through the tutorials, FAQ's and knowledgebase. This would give you a base understanding of the settings you will see in this strategy and why you will need to know them. Only then should you try testing this strategy with a paper bot.
Background
After I had created and released "Fibonacci Zone DCA Strategy", I began expanding and testing other ideas.
The first idea was to add Ranged Volume to the Fibonacci Zone DCA strategy which I wanted for providing further confirmation before entering a trade. The second idea was to add a second Fibonacci Zone that was just as configurable as the first Fibonacci Zone. I managed to add both and they can be easily enabled or disabled via the strategy settings menu.
Things Got Real Interesting
Things got real interesting when I started testing strategies with two Fibonacci zones. Here's a quick list of what I found I was able to do:
Mix and match exit strategies. I could set the Fib-1 zone strategy to exit with a take profit % and separately set the Fib-2 zone strategy to exit when the price crosses the top-high fib border
Trade the trend. A common phrase amongst traders is "the Trend is your friend" and with the help of an additional Fib Zone, I was able to trade the trend more often by using two different Fib Zone strategies which if configured properly can shorten time to re-deploy capital, increase number of closed trades, and in some cases increase net profit.
Trade both bull market uptrends and bear market downtrends in the same strategy. I found I could configure one Fib Zone strategy to be really good in uptrends and another Fib Zone strategy to be really good in downtrends. In some cases, with both Fib Zone strategies enabled together in a single strategy I got better results than if the strategies were backtested separately.
There are many other trade strategies I am finding with this. One could be to trade a convergence or divergence of the two different Fib Zones. This could possibly be achieved by setting one strategy to have different Fibonacci length.
Credits:
Thank you "EvoCrypto" for granting me permission to use "Ranged Volume" to create this strategy
Thank you "eykpunter" for granting me permission to use "Fibonacci Zones" to create this strategy
Thank you "junyou0424" for granting me permission to use "DCA Bot with SuperTrend Emulator" which I used for adding bot inputs, calculations, and strategy
