[Unxi]McClellan Summation Index for DAX 30 (GER30) [modified]About McClellan Summation Index
The McClellan Summation Index is a market breadth indicator which was developed by Sherman and Marian McClellan. It is based on the McClellan Oscillator and add its values together, effectively running a total. The index goes up when the McClellan Oscillator is positive and goes down when it is negative. Signals can be derived from the index crossing the middle line (bullish when it's crossing up and bearish when it's crossing down). Other potential signals include divergences and overbought and oversold conditions. The indicator is best used in combination with other analysis techniques.
About this implementation
This version here is a modification of the McClellan Summation Index.
It runs the simple version of the McClellan Oscillator and uses the simple method to calculate the Summation Index. No ratios are used in this implementation.
Further information:
- It can only be used on the DAX index ( DAX 30 or GER 30)
- It only considers the DAX 30 stocks
- The data window will provide a summary about rising and declining stocks
- The data window will output the last change for each of the 30 stocks
- The script is pretty slow because it has to calculate the change for each bar individually (instead of receiving a complete calculation from the stock exchange).
DISCLAIMER
This script was mainly written for educational purposes (training myself how to write custom indicatotors).
As you can see, the code is really messy.
FOR YOUR INFORMATION: This script will work on any time period. It is recommended to use it with timeperiod = 1d, though. Just use whatever timeperiod you are comfortable with, the indicator will automatically adjust accordingly.
Credits
Based on the simple version of aftabmk and of code from lazybear.
在腳本中搜尋"N+credit最新动态"

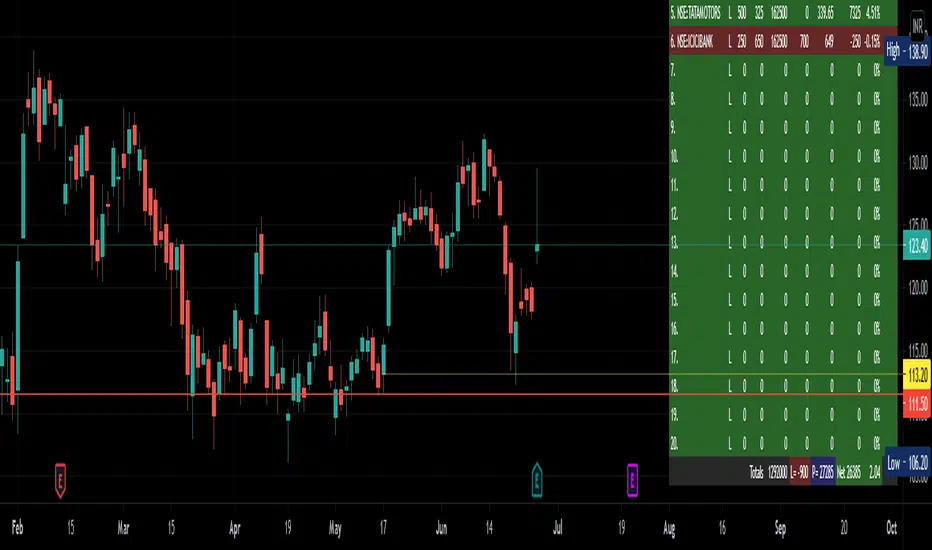
Tabular Portfolio by CJS V1This is a useful indicator that sits on top of the charts, in the right hand bottom corner and shows the current price, profit or loss in value and percent of upto 20 scrips fed in, in a Tabular form using tables feature.
Allows to mark a/c id also if you have multiple broker or individual accounts.
Colors are customisable.
Stocks get updated no matter what is your current selected scrip.
Gives total investment and total PnL also in percent.
Useful to monitor your portfolio status in once screen and while you are looking at charts.
Give feedback for improvement or issues, if any.
Credits to RedKTrader from where the idea was picked up.
Move visual order to front, if the charts and other indicators overlap the table view.
[jav] Mountain Oscillator
Introducing the Mountain Oscillator. Why not trading while admiring the scenery?
The main oscillator line is the black silhouette of the mountains, and each element of the landscape can be seen as a support or resistance - even the mountains far in the horizon, the misty band in the middle and the -1, 0 and 1 lines. (Well, almost every element... the sun is just for fun).
Equalling the heights of the mountains that are far away, or reaching the snow zone, are possible signs of an uptrend ending. On the other hand, stepping into a river is a clear sign of a reversal to the upside soon.
Strong uptrends are evidenced by significant portions of the mountain above the misty zone and/or the 0 line.
By default, the sky turns red/blue/dark gray depending on the trading hours. This option can be unchecked.
Calculations and usage :
The script is based on a modified version of Bollinger Bands. Bandwidth is calculated quite differently from the usual Bollinger indicator (not with the built-in stdev function). There is no need to input a multiplier factor, such as that used in BB - the script calculates it from 'Length' using a custom formula.
The 3 user inputs 'Length' ares recommended to be kept at 200, 100 and 50 period. In that way, the misty area in the landscape corresponds to price crossing EMAs of 50 and 100, and the zero line to EMA 200.
The different colors of the mountain and the horizon represent the Bollinger Bands corresponding to the mentioned periods of 50 and 100, whereas limits of -1 and +1 are those from the 'Length' parameter.
You will find that my coding skills are rudimentary, so any comment/suggestion to improve the script is welcome.
Credits
@everget for the 'Fancy Shapes' script which was used as a reference to draw the sun.

Visual Squeeze MomentumSqueeze Momentum from LazyBear now visible at the chart so you can check when the Squeeze its about to release. All credits for him.

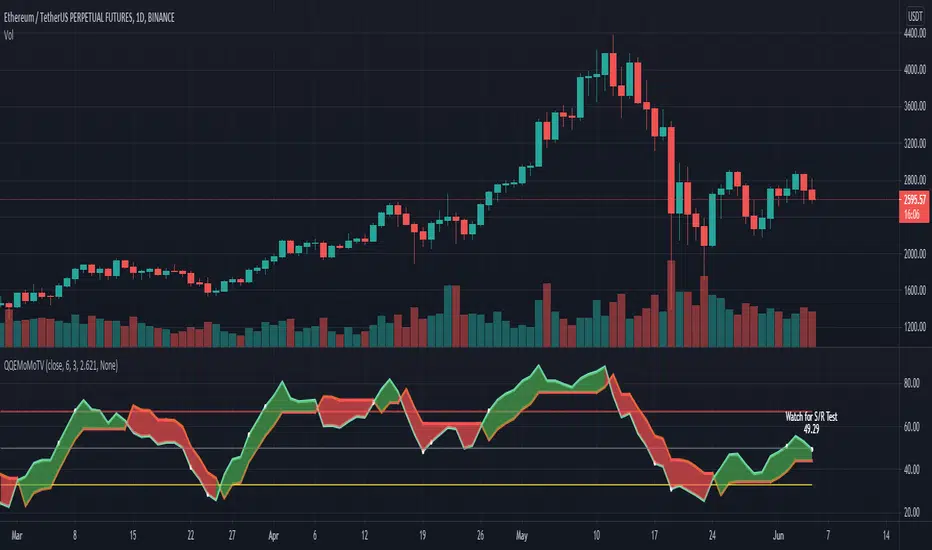
QQEMoMoTV█ OVERVIEW
This plots the QQE (Quantitive Qualitative Estimation)
with the addition of labels to show areas to watch out for and a colored cloud to show Green Upwards or Red Downwards Momentum
The QQE indicator is based on Wilder's RSI, which is based on a smoothed RSI comparing the change (delta Δ) between between bars
to compute the FastTL and SlowTL depending on the RSI Period, Slow Factor and QQE settings selected
As this works similarly to the RSI, it provides areas of overbought and oversold, and a cross at 50 for more bullish or more bearish
The FastTL and SlowTL crossovers works similarly to the crossover of a fast and slow moving average which can indicate bullish or bearish
When the SlowTL crosses above the FastTL a Green cloud indicating upwards momentum is drawn and vice versa when FastTL crosses above SlowTL
Bullish signals generated when Blue line crosses above Orange line, or Green MoMo cloud, Uptrend
Bearish signals generated when Orange line crosses above Blue line, or Red MoMo cloud, Downtrend
QQE Areas of interest:
Oversold: QQE < 33, Overbought: QQE > 67
Cross at 50: QQE crossing 50, this is an area that is between more bullish >50 and more bearish <50 zones
Note: as 50 is the switch between more bullish or more bearish zones , it is common to watch out for Support/Resistance Tests at this level
Tip: when QQE appears to be flat, this indicates a flat trend, this can commonly happen around the 50 zone when direction is relatively undecided, see the image below for an example
Very Overbought: QQE > 90, Careful! Watch out! QQE is showing very overbought and is generally a good area to take profit as others may sell soon too
QQE Fast settings: gives earlier signals, but also gives more shorter term signals
RSI_Period = 6, Slow_Factor = 3, QQE = 2.621
QQE Slow settings: gives more reliable signals, but sometimes a little late, best to use both fast and slow together for confirmation of the trend
RSI_Period = 20, Slow_Factor = 5, QQE = 4.236
You can add the QQEMoMoTV indicator to your chart twice and change one of them to the Fast settings and one of them to the Slow settings.
By comparing the QQEMoMoTV Fast and QQEMoMoTV Slow together you can get a better idea of the overall trend.
To best determine if this is a entry point or a trend reversal, it is recommended to use in conjunction with the MashumeHullTV indicator
█ FEATURES
Calculations
Calculates the change (delta Δ) between between bars based on Wilder's smoothed RSI to compute the FastTL (Orange) and SlowTL (Blue) lines
These are dependent on the QQE Fast settings or QQE Slow settings from the input RSI Period, Slow Factor and QQE selected
Labels are shown when QQE crosses areas of interest on the chart as Label text and shown with white dots on the QQEMoMoTV indicator
Inputs
You can use the script's inputs to configure:
• Calculation Source (default close)
• RSI Period (default 20)
• Slow Factor (default 5)
• QQE (default 4.236)
• Whether to show Green/Red MoMo Cloud
• Whether to show the QQE Label
• Style and Position of the QQELabel (default None)
None is selected as default to take up least space for optimal viewing when on Tradingview mobile, but you are free to change the style however you like
Alerts
Buy Signal alert based on rsi_ma crossing above FastAtrRsiTL, when Blue Line Cross above Orange Line, Green MoMo Cloud, Bullish
Sell Signal alert based on FastAtrRsiTL crossing above rsi_ma, when Orange Line Cross above Blue Line, Red MoMo Cloud, Bearish
█ CREDITS
Original Author: greyghost7
Feature upgrades and usage: Xiuying
Converted to Tradingview by: Machdragon
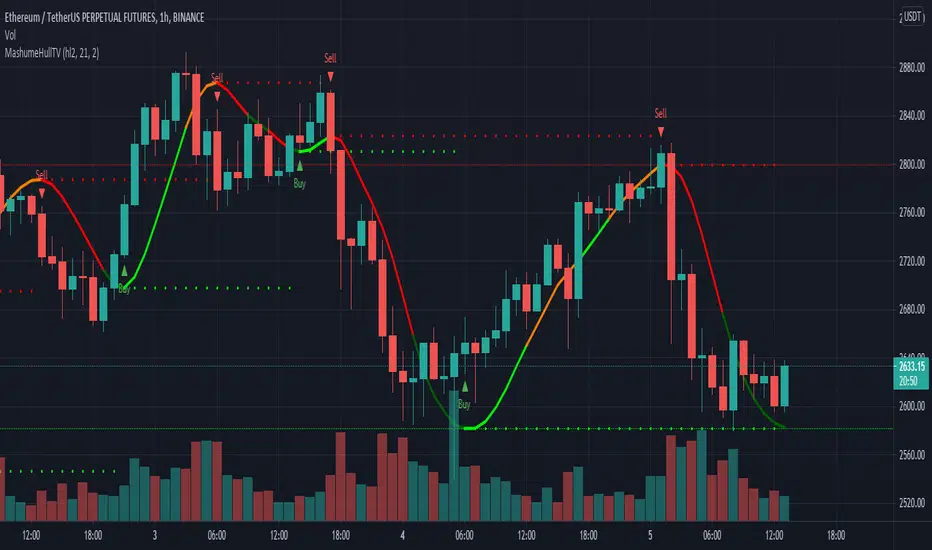
MashumeHullTV█ OVERVIEW
This plots the Hull Moving Average Turning Points and Concavity
with the addition of colored segments representing concavity and turning points: maxima, minima and inflection.
a fast way to determine the trend direction and possible reversals based on concavity of the trend
Dark Green: Concave Up but HMA decreasing. The 'mood' has changed and the declining trend of the HMA is slowing. Possible trend change to Uptrend soon
Light Green: Concave up and HMA increasing. Price is increasing, and since the curve is still concave up, it is accelerating upward. Uptrend
Orange: Concavity is now downward, and though price is still increasing, the rate has slowed, perhaps the mood has become less enthusiastic. Possible trend change to Downtrend soon
Red: Concave down and HMA decreasing. Downtrend
Buy signals generated when Hull turns from Dark Green -> Light Green
Sell signals generated when Hull turns from Orange -> Red
To best determine if this is a entry point or a trend reversal, it is recommended to use in conjunction with the QQEMoMoTV indicator
█ FEATURES
Calculations
Calculates the concavity of the Hull Moving Average comparing the Hull concavity of the current bar to the previous bar and displays the concavity in the form of 4 different colors.
Note: may cause repainting, so recommended to use with another indicator such as the QQEMoMoTV indicator to confirm signals.
Calculates divergence between the calculated HMA and the actual price and displays this in the Divergence Label.
Calculates the local minima, maxima and inflection points with the ability to display these as auto support/resistance lines.
Inputs
You can use the script's inputs to configure:
• Calculation Source (default HL2)
• HMA Length (default 21)
• Lookback (default 2)
• Whether to show Auto Support/Resist Lines
• Whether to show Buy/Sell Arrows
• Whether to show Divergence Label
• Whether to extend Local Auto Support/Resist Lines
Alerts
Buy Signal alert based on HMA crossing above MA_Min/Hull Support, when Hull turns from Dark Green -> Light Green, Bullish
Sell Signal alert based on HMA crossing below MA_Max/Hull Resistance, when Hull turns from Orange -> Red, Bearish
Experimental support for applying the indicator to higher time frames
eg. charting the hourly MashumeHull indicator on 15 min chart. See the commented code to access this feature
█ CREDITS
Original Author: Seth Urion (Mashume)
Feature upgrades and usage: Xiuying
Converted to Tradingview by: Machdragon
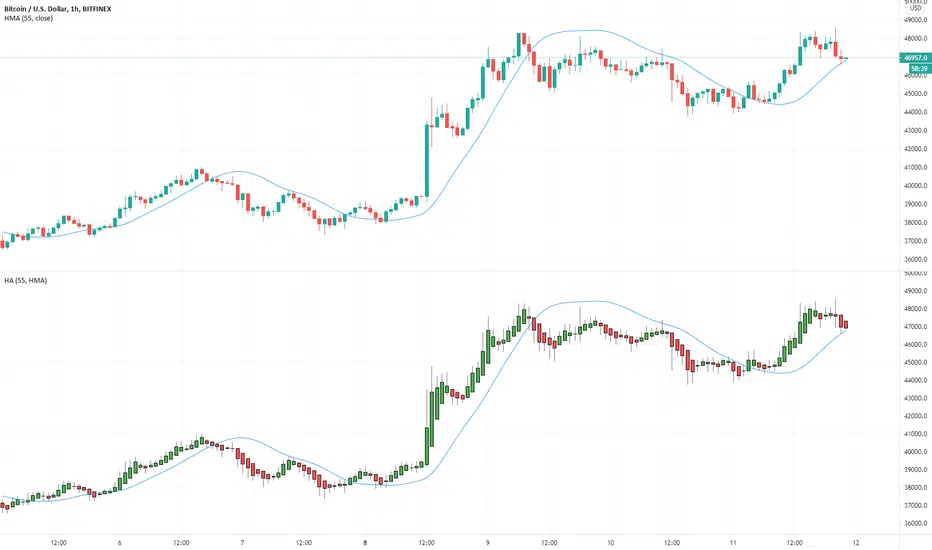
[jav] HeikinAshized OscillatorsThis script allows to HeikinAshize different commonly used centered oscillators.
It plots them like Heikin Ashi candles. In this way, we can eliminate some of the noise and uncertainty that is inherent to applying only one calculation period to the oscillators.
Applying Heikin Ashi to an oscillator might be advantageous compared to applying it directly to the chart, because you are not altering price readings. The obvious advantage is the clear visualization of the trend directions without noise.
INPUTS
The oscillators included are:
Relative Strength Index (RSI)
Stochastic
Stochastic RSI
Fisher transform
Inverse Fisher Transform of RSI (IFTRSI)
Commodity Channel Index (CCI)
Money Flow Index (MFI)
Chande Momentum Oscillator (CMO)
Momentum (MOM)
True Strength Index (TSI)
Williams' Percent Range (WPR).
Apart from the choice of one of these indicators, only two more inputs are required:
the main (median) period and
the % of variability of this period.
RESULTS
The script calculates 4 evenly spaced periods from that data (period and variability), e.g. for a period of 50 and a variability of 30%, the script calculates oscillator values for 4 different periods evenly spaced around 50, (35, 45, 55, 65) and uses these 4 values to draw the Heikin Ashi candle.
The script also plots the usual upper/lower (overbought/oversold) values, as well as the central line.
CREDITS
The interesting concept of applying Heikin Ashi to an oscillator was recently introduced in Tradingview by @JayRogers . Many thanks for the idea.
For Heikin Ashi calculations, the useful script by @allanster was taken as a reference.
Any improvements, modifications or suggestions are welcome.

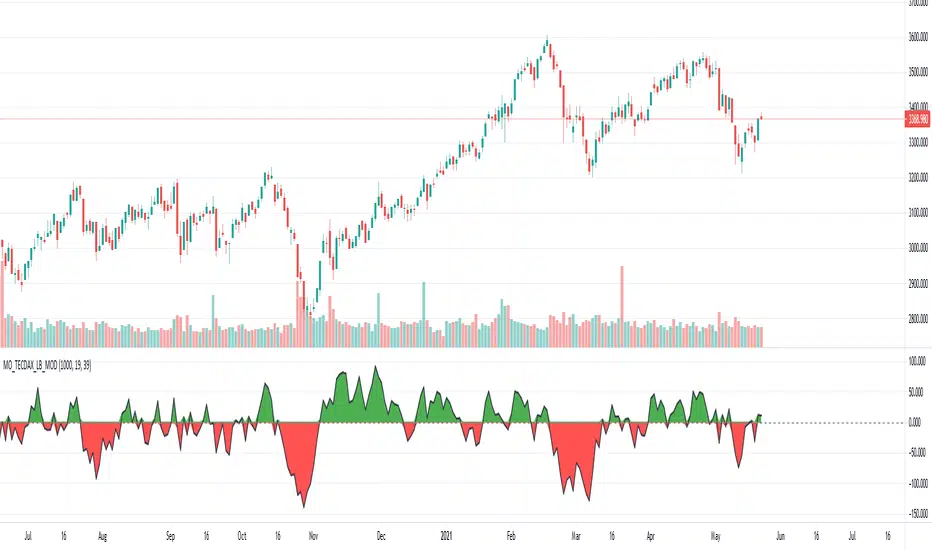
[Unxi]McClellan Oscillator for TECDAX [modified]This version is for use with the German TecDax index only!
About McClellan Oscillator
Developed by Sherman and Marian McClellan, the McClellan Oscillator is a breadth indicator derived from Net Advances, the number of advancing issues less the number of declining issues. Subtracting the 39-day exponential moving average of Net Advances from the 19-day exponential moving average of Net Advances forms the oscillator.
As the formula reveals, the McClellan Oscillator is a momentum indicator that works similar to MACD .
McClellan Oscillator signals can be generated with breadth thrusts, centerline crossovers, overall levels and divergences.
About my version
This version here is a modification, though:
- It can only be used on the German TECDAX index
- It only considers the TECDAX stocks
- The data window will provide a summary about rising and declining stocks
- The data window will output the last change for each of the 30 stocks
The script is pretty slow because it has to calculate the change for each bar individually (instead of receiving a complete calculation from the stock exchange).
This script will work on any time period. Just use whatever timeperiod you are comfortable with, the indicator will automatically adjust accordingly. It is recommended to use it with timeperiod = 1d, though.
DISCLAIMER
This script was mainly written for educational purposes (training myself how to write custom indicatotors).
As you can see, the code is really messy. Feel free to provide your feedback in the comments!
Credits
Based on the simple version of aftabmk
You can find the original version by searching for McClellan Oscillator for nifty 50.
Also got some inspiration from lazybear's version and from danarn's "Crypto McClellan Oscillator".
McClellan Oscillator for DAX (GER30) [aftabmk modified]About McClellan Oscillator
Developed by Sherman and Marian McClellan, the McClellan Oscillator is a breadth indicator derived from Net Advances, the number of advancing issues less the number of declining issues. Subtracting the 39-day exponential moving average of Net Advances from the 19-day exponential moving average of Net Advances forms the oscillator.
As the formula reveals, the McClellan Oscillator is a momentum indicator that works similar to MACD .
McClellan Oscillator signals can be generated with breadth thrusts, centerline crossovers, overall levels and divergences.
About my version
This version here is a modification, though:
- It can only be used on the DAX index (DAX 30 or GER 30)
- It only considers the DAX 30 stocks
- The data window will provide a summary about rising and declining stocks
- The data window will output the last change for each of the 30 stocks
BUG
I am only publishing this version because I am not sure if my current version is saved when I leave tradingview.com without publishing the script.
This version still contains a bug - the if/else clauses do not correctly recognize declining stocks. So the oscillator should not be used as it is.
Working on it these days. Feel free to provide feedback!
Stuff I am working on
- Coloring the area green/red according to the value
- Fixing this bug/making this script more efficient
DISCLAIMER
This script was mainly written for educational purposes (training myself how to write custom indicatotors).
As you can see, the code is really messy.
Credits
Based on the simple version of aftabmk
You can find the original version by searching for McClellan Oscillator for nifty 50.

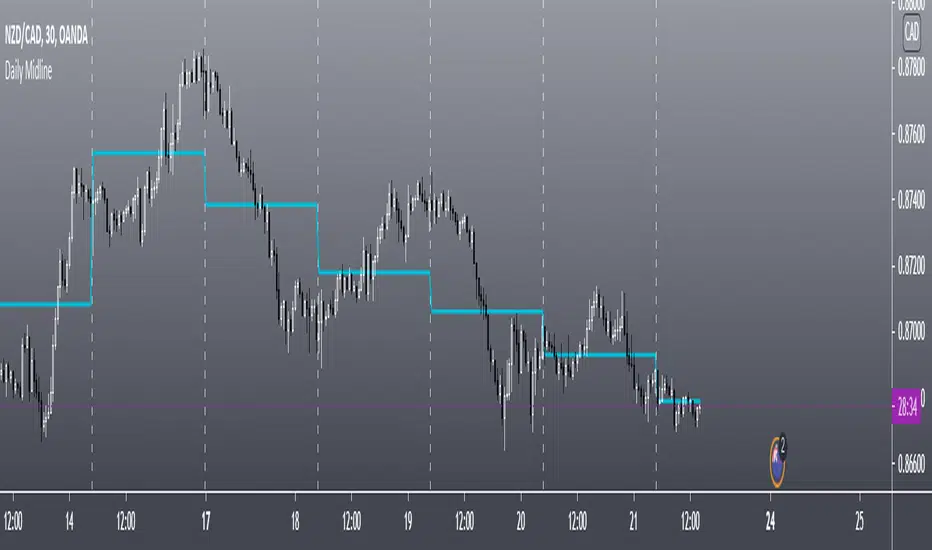
Daily MidlineThis Scripts Shows Daily Midline Levels From Yesterday High/lows.
Credits to rodrigo.aprieto and NorthstarDaytrading
for combined script idea.
ATR TRex Candle Classification(By MiladF)All credits goes to dear Mr.Khakestar and Trigger Price Action ( TRex ).

ADX Trend + RSI V2Indicator combining in one chart : ADX + RSI.
V2 : NOW, BULL TREND = SLOPE(ADX)>0 AND SLOPE(long EMA)>0
Changing settings :
Slow ADX Smoothing : periods for the EMA to smooth the ADX
Zero? : threshold (dotted line) at which the label will show "trend" (if the ADX is increasing)
Length RSI : Periods for calculating RSI
Settings for MACD Length : don't touch, except if you need to.
Coded with my buttocks, thanks for your indulgence.
Credits at the beginning of the code (thanks to newmen41)

VPF ScreenerThis script is inspired by @midtownsk8rguy and created at my request with the pine mastery of @DonovanWall. All the credits go to them.
Basically, this script will screen for the long-only condition of the Voss Predictive Filter in maximum 40 securities at your choice.
I personally find the signals quite reliable for scalping indices and swing trading momentum stocks.
Hope you guys find it useful

ADX Trend + RSIIndicator combining in one chart : ADX + RSI.
Changing settings :
Slow ADX Smoothing : periods for the EMA to smooth the ADX
Zero? : threshold (dotted line) at which the label will show "trend" (if the ADX is increasing)
Length RSI : Periods for calculating RSI
Settings for MACD Length : don't touch, except if you need to.
Coded with my buttocks, thanks for your indulgence.
Credits at the beginning of the code (thanks to newmen41)

Elder Impulsion + double EMA + EnvelopIndicator combining Elder Impulsion + double EMA + Envelop.
Changing settings :
Long EMA : periods for the long EMA
Short EMA : periods for the short EMA
Coefficient de canal : envelop narrowing
Settings for MACD Length : don't touch, except if you need to.
Coded with my buttocks, thanks for your indulgence.
Credits at the beginning of the code (thanks to jamiespips, samuel16, idu)

TDI - Traders Dynamic Index + RSI Divergences + Buy/Sell SignalsTraders Dynamic Index + RSI Divergences + Buy/Sell Signals
Credits to LazyBear (original code author) and JustUncleL (modifications)..
I added some new features:
1- RSI Divergences (Original code from 'Divergence Indicator')
2- Buy/Sell Signals with alerts (Green label 'Buy' - Red label 'Sell')
3- Background colouring when RSI (Green line) crosses above MBL (yellow line)
- Buy and Sell Signals are generated using Dean Malone's method (The Author of the TDI indicator) as mentioned in his PDF: (( www.forexfactory.com )), according to:
** Buy (Green Label) = RSI > 50, Red line, & Yellow line
** Sell (Red Label) = RSI < 50, Red line, & Yellow line
- I found that the best quality long trades generated when RSI crosses above red line, yellow line and they are all above 50, and vice versa for sell trades.
-I figured out another way to generate Buy/Sell Signals when RSI crosses above the yellow line, and you can stay with the trade till RSI crosses under the yellow line (I made a background colouring for that to be easily detected)
Hope you all wonderful trades..
مؤلف المؤشر هو (Dean Malone)
وكتب LazyBear كوده في tradingview
وأضاف JustUncleL بعض التعديلات عليه
أضفت إليه بعض المزايا الأخرى المتمثلة في:
1- رصد انحرافات مؤشر القوة النسبية
2- إشارات بيع وشراء بناء على طريقة مؤلف المؤشر
3- تظليل بالأخضر للمنطقة التي يعبر فيها مؤشر القوة النسبية الخط الأوسط (الخط الأصفر)
إشارات البيع والشراء تكون كالتالي:
** الشراء عندما يكون مؤشر القوة النسبية فوق الخط الأحمر وفوق خط الـ 50 وفوق الخط الأصفر
** البيع عندما يكون مؤشر القوة النسبية تحت الخط الأحمر وتحت خط الـ 50 وتحت الخط الأصفر
** أفضل إشارات الشراء حينما يعبر مؤشر القوة النسبية فوق الخط الأحمر والأصفر، ويكونوا جميعا فوق خط الـ 50، والعكس بالنسبة لإشارات البيع
يمكن استخدام المؤشر في دخول صفقات متوسط المدى، وذلك عندما يعبر مؤشر القوة النسبية فوق الخط الأصفر (قمت بتظليل المنطقة بالأخضر لسهولة رصدها) والخروج من الصفقة إذا نزل مؤشر القوة النسبية عن الخط الأصفر،
يرجى التنبه إلى أن الدخول والخروج يكون بأسباب فنية مدروسة، والمؤشر يدعم قراراتك فقط، ولا يمكن الاعتماد عليه منفردا في تحديد نقاط الدخول أوالخروج.
تجارة موفقة لكم جميعا :)

Heisenberg's Uncertainty BandsHeisenberg's Uncertainty Bands:
This is a volatility indicator to determine and visualize the uncertainty in a securities' price.
In quantum mechanics, the uncertainty principle (also known as Heisenberg's uncertainty principle) is any of a variety of mathematical inequalities asserting a fundamental limit to the accuracy with which the values for certain pairs of physical quantities of a particle, such as position, x, and momentum, p, can be predicted from initial conditions.
It plots a Kalman filter average of the bars inside a higher timeframe bar, to attempt to find the most frequent price in that bar's timespan. To plot what is effectively a MA using POC (IvanLabrie's code, credits to the author).
It derives momentum from relative momentum, yielding results more sensitive to changes.
Then it uses Heisenberg's uncertainty principle to find an uncertainty range, and uses it as the channel distance from the POC MA, meaning price is likely to fluctuate within that range.
Since uncertainty must be greater than h/2, adding fib levels will make it a useful indicator. Essentially they are pseudo-Fibonacci Bollinger Bands, which uses a different calculation.
Benefits:
Prices fluctuate, and it can be helpful to visualize price as a range, rather than a single point or line. This visualization can help in managing risk, determining entries and exits, and prevent losing one's position due to price fluctuations during a trend.
If we use a particle model, the uncertainty principle dictates that it is impossible to predict the price within a range. This is a good model for risk management!
Usage:
There are 5 Fibonacci ratio outer bands that can be turned on or off according to user's preference.
Recommended that the length inputs should be increased in higher timeframes, to visualize trends, shorter timeframes should have lower lengths.
GLHF
- DPT

SuperB By RafaelZioniThis strategy is based on an indicator called "SuperB", created by RafaelZioni. All the credits of this script belong to him.
All I did was converting the indicator to strategy using the buy/sell indicators, so you can back-test it easily.

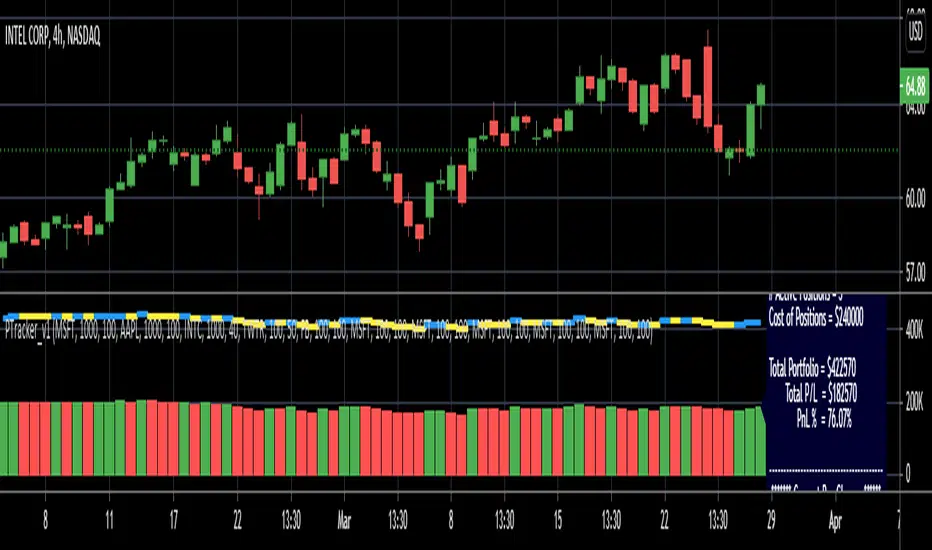
Simple Portfolio TrackerThis is just a simple portfolio tracker that i started to play around with - i'm sure there are smarter ways to do this, but i chose the simpler way :) -- please feel free to use this, or consider it as a starting point to your own indicator.
i will come back later and add some more stuff once i get time. for example, show the total value, recent change, P&L % ..etc
So the simple idea is to track a portfolio of few positions and watch how the total portfolio and the PnL changes over time as the price of the individual holdings move up and down. it can be added to any chart.
The code is currently set to track 5 positions - settings allow to enter if the positions is used or not, symbol, amount and cost price..
** note: more positions can be added by editing the code and copying and pasting the marked "position block" that contains the input statements and the calculations, then changing/replacing the position identifier (_1, _2, ..etc) in all variables with new number..
--- don't forget to add these extra positions you insert in the code to the formula lines that calculate the totals
i tried to make this as easy as possible in the code. the code includes a sample portfolio as default values just to help "demo" how this works
the input is made easy, thanks to the recent addition of the "inline" feature in the input() statement
i don't know if some traders will find this useful ?? or if more about how to use it is needed.. let me know in the comments.. as i mentioned, i was just playing with the idea over the weekend so didn't really put a lot of work into it.
Credits and thanks to @boji1 for inspiring this :)
Customizable MA RibbonAll credits to @Violent (www.tradingview.com) for making the original code! I just updated it by adding new features and themes!
---------------------------------------------
Lemon's Customizable MA Ribbon:
---------------------------------------------
A series of moving averages of different lengths that create a ribbon-like indicator. Traders can determine trend strength by lookin at the distance between the moving averages and the overall balance of the colored lines. Price movements through the ribbon can also be used to identify trend changes.
------------
FEATURES
------------
MA TYPES: SMA , EMA , WMA, RMA, ALMA, VWMA, HMA
Editable length
Editable start
User defined number of plots to show (between 1 to 32 total plots)
Multiple color theme choices
A color smoothing option.
Thank you and happy trading!
with love,
-Lemon

Multiple Moving Averages for Heikin Ashi I want to give credits to @QuantNomad, i got the heikin ashi part of the script from this open script /0iKy7lyG-QuantNomad-Heikin-Ashi-PSAR-Strategy/;
and to the other guy that provided a 17 type of moving average script open source but i forgot his name, if someone remember please tell me.
My idea was to see how the different types of moving averages behaves in a Heinkin Ashi chart, you can change to more than 15 types of Moving Average and use it the way you want it.
For the source of the moving averages i used a simple moving average of 1 period using the high of the heikin ashi candle, low of it and divided by 2 as the source of the different types of moving averages.
Different types of Moving Averages
Moving Average Types
SMA ---> Simple
WMA ---> Weighted
VWMA ---> Volume Weighted
EMA ---> Exponential
DEMA ---> Double EMA
ALMA ---> Arnaud Legoux
HMA ---> Hull MA
SMMA ---> Smoothed
LSMA ---> Least Squares
KAMA ---> Kaufman Adaptive
TEMA ---> Triple EMA
ZLEMA ---> Zero Lag
FRAMA ---> Fractal Adaptive
VIDYA ---> Variable Index Dynamic Average
JMA ---> Jurik Moving Average
T3 ---> Tillson
TRIMA ---> Triangular
The type of moving average you select will appear in a separated chart with Heikin Ashi candles, like in the image above.
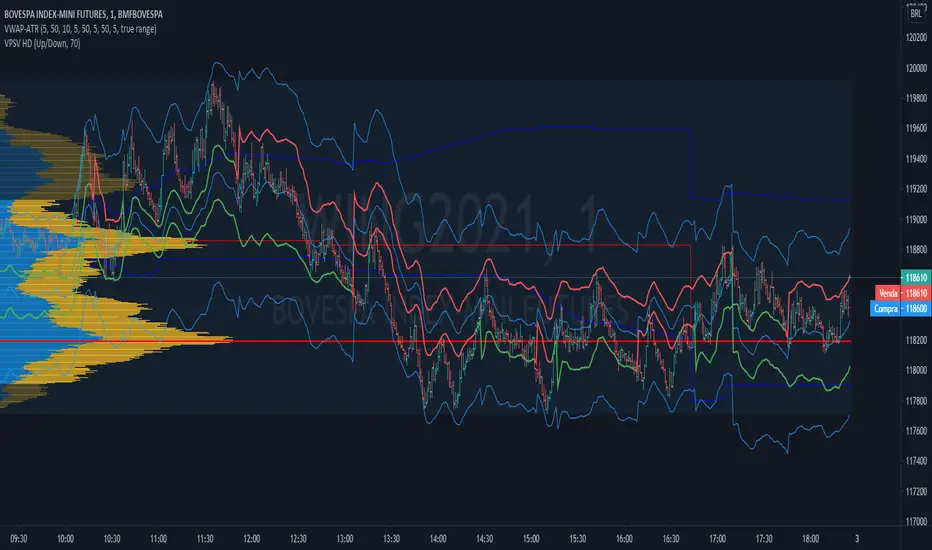
VWAP-ATR-SSLThis is an experimental idea to transform the original script created by @Fleite28 in a kind of SSL with volatility bands.
@Fleite28 has made all script and he have all credits, I just give him this idea.
I'm using this indicator to confirm:
1-potential bull trend (when you have 2x green lines with support)
2-potential bear trend (2x lines red - resistance)
3-consolidations (inside green support and red resistance).
Try to use this with a Market Profile Volume and some trend lines.
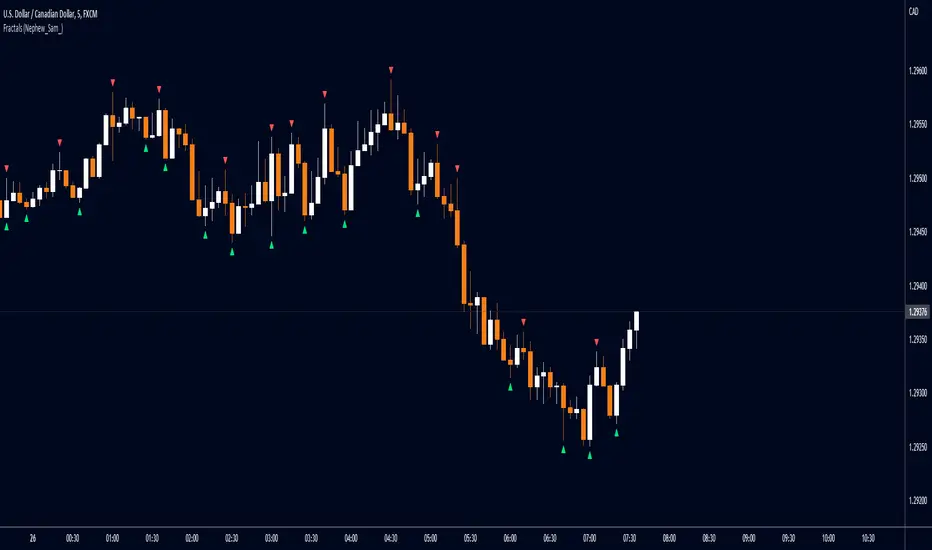
Fractals (Nephew_Sam_)Regular and Williams fractal
1. Plots 3 and 5 bar fractal point
2. Plots significant highs/lows lines
Credits to @RicardoSantos, Code taken from his open source script (V9).