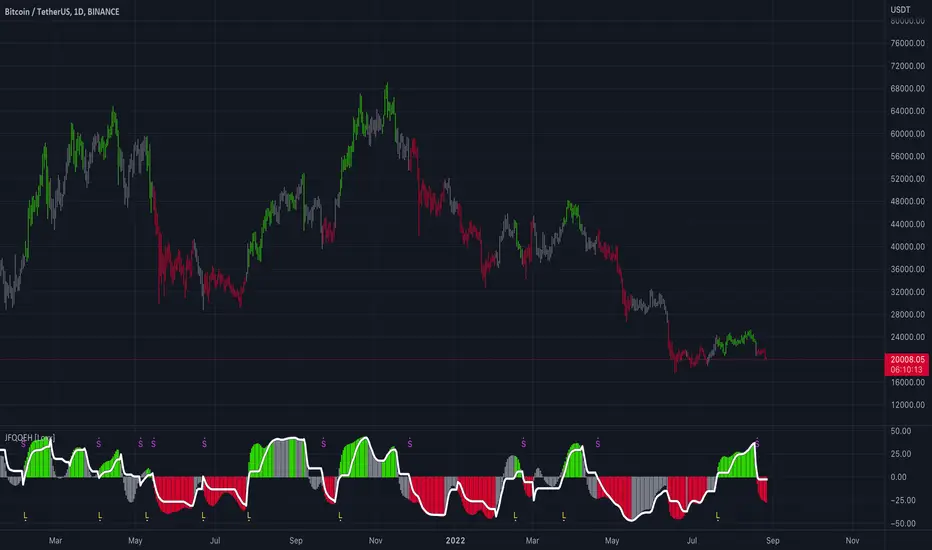
RSI of Zero Lag MA (ValueRay)The RSI of a Zero Lag Moving Average a powerful tool for for reliable exit signals.
The Relative Strength Index (RSI) is a widely recognized momentum oscillator that measures the speed and change of price movements. It provides valuable insights into overbought and oversold conditions, enabling traders to identify potential reversal points and take advantage of market inefficiencies.
The RSI of a Zero Lag Indicator takes this concept a step further by incorporating the Zero Lag Moving Average. The Zero Lag Moving Average is a cutting-edge indicator that minimizes lag and provides a smoother representation of price action, allowing for quicker and more precise responses to market movements.
By combining the RSI with the Zero Lag Moving Average, this indicator offers traders a superior exit strategy. When the RSI reaches extreme levels of overbought or oversold conditions, it indicates a potential reversal in the market. The Zero Lag Moving Average further enhances this signal by reducing delays and providing timely exit points.
Moreover, the RSI of a Zero Lag Indicator is not limited to mean reversion strategies. While it excels in identifying mean reversion opportunities, it can also be used in conjunction with other trading approaches. Traders can take advantage of its objective signals to exit trades profitably, regardless of their chosen strategy.
With its ability to accurately pinpoint overbought and oversold conditions, the RSI of a Zero Lag Indicator offers traders a competitive edge in the market. By providing timely exit signals and minimizing lag, it helps traders optimize their trading decisions and increase their chances of success.
在腳本中搜尋"Relative Strength Index (RSI)"

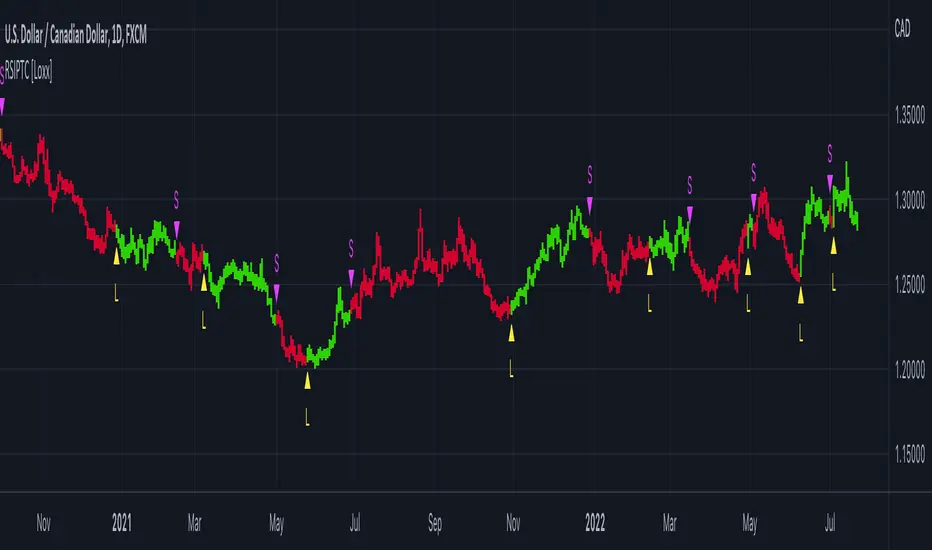
RSI TrueLevel StrategyThis strategy is a momentum-based strategy that uses the Relative Strength Index (RSI) indicator and a TrueLevel envelope to generate trade signals.
The strategy uses user-defined input parameters to calculate TrueLevel envelopes for 14 different lengths. The TrueLevel envelope is a volatility-based technical indicator that consists of upper and lower bands. The upper band is calculated by adding a multiple of the standard deviation to a linear regression line of the price data, while the lower band is calculated by subtracting a multiple of the standard deviation from the same regression line.
The strategy generates long signals when the RSI crosses above the oversold level or when the price crosses above the selected lower band of the TrueLevel envelope. It generates short signals when the RSI crosses below the overbought level or when the price crosses below the selected upper band of the TrueLevel envelope.
The strategy allows for long and short trades and sets the trade size as a percentage of the account equity. The colors of the bands and fills are also customizable through user-defined input parameters.
In this strategy, the 12th TrueLevel band was chosen due to its ability to capture significant price movements while still providing a reasonable level of noise reduction. The strategy utilizes a total of 14 TrueLevel bands, each with varying lengths. The 12th band, with a length of 2646, strikes a balance between sensitivity to market changes and reducing false signals, making it a suitable choice for this strategy.
RSI Parameters:
In this strategy, the RSI overbought and oversold levels are set at 65 and 40, respectively. These values were chosen to filter out more noise in the market and focus on stronger trends. Traditional RSI overbought and oversold levels are set at 70 and 30, respectively. By raising the oversold level and lowering the overbought level, the strategy aims to identify more significant trend reversals and potential trade opportunities.
Of course, the parameters can be adjusted to suit individual preferences.

Optimized Logarithmic Curve for Bitcoin (BTC/USD) by FICASHello everyone!
I'd like to share with you a handy tool that is incredibly useful for analyzing Bitcoin's price movements. This optimized logarithmic curve indicator is a refined version of the popular "My BTC log curve" indicator, originally created by @quantadelic.
We have made several improvements to enhance its predictive capabilities when it comes to identifying potential price bottoms for Bitcoin BTC/USD.
Description:
In this detailed analysis, we are excited to introduce you to an optimized version of the popular "My BTC log curve" indicator, originally created by @quantadelic. We have refined the indicator for enhanced predictive capabilities when it comes to identifying potential price bottoms for Bitcoin BTC/USD. By putting ourselves in the reader's shoes, we aim to provide a comprehensive and meaningful explanation of our analysis and predictions using this improved tool.
The logarithmic curve is a powerful tool for analyzing price movements in a non-linear fashion, allowing traders and investors to identify critical turning points and trends. With the optimized logarithmic curve, we can more accurately predict potential price bottoms, ultimately guiding better-informed trading and investment decisions.
Key Features of the Optimized Logarithmic Curve:
Improved predictive capabilities: The refined logarithmic curve has been optimized to provide more accurate predictions of potential price bottoms, enabling traders to make better-informed decisions.
Enhanced visualization: The optimized curve offers a clearer visual representation of Bitcoin's price movements, making it easier for traders to identify patterns and trends.
Adaptability: This indicator can be applied to various timeframes, providing insights for both short-term and long-term traders.
The optimized logarithmic curve indicator is based on a logarithmic regression of the USD price of Bitcoin, calculated according to the equation:
y = A * exp(beta * x^lambda + c) + m * x + b
where x is the number of days since the genesis block. All parameters are editable in the script options, allowing traders to customize the curve to their preferences.
Here are some of the key changes made to the original indicator to create the optimized logarithmic curve:
Midline Calculation: The optimized logarithmic curve utilizes an updated method for calculating the midline, which better represents the average price movement of Bitcoin over time. This improved midline calculation provides a more accurate representation of Bitcoin's historical price trajectory, making it easier to identify potential price bottoms.
Cross Line Calculation: We have modified the way cross lines are calculated in the optimized logarithmic curve. These new cross lines are derived from a combination of the updated midline calculation and historical support and resistance levels. This change allows traders to more accurately identify critical points in the market where price action is likely to reverse or continue its trend.
Table Display: a powerful visualization tool designed to provide a comprehensive overview of the relationships between various exponential curves and the Bitcoin price. This table display, integrated into the "FiCAS BTC log curve" indicator, enables traders and analysts to quickly compare and assess the impact of these curves on the market.
Our analysis using the optimized logarithmic curve suggests that Bitcoin might be at a critical price bottom, indicating that selling at this point may not be the most prudent course of action. Instead, traders and investors could consider taking advantage of the potential upswing as the market moves away from the identified price bottom.
Key highlights of this Optimized Logarithmic Curve for Bitcoin (BTC/USD) by FICAS:
Custom Pine Script: Pinescript code serves as the backbone of this strategy, providing a strong foundation for identifying potential opportunities based on the relationships between exponential curves and Bitcoin price.
MACD Indicator: The Moving Average Convergence Divergence (MACD) is integrated to help traders recognize trend reversals, bullish or bearish market conditions, and potential entry or exit points.
Momentum Indicator: By incorporating the Momentum (10, close) indicator, traders can identify the strength of price movements and potential trend continuations or reversals.
RSI and SMA: The Relative Strength Index (RSI) is used to assess overbought or oversold conditions, while the Simple Moving Average (SMA) with a period of 14 and an applied factor of 2 smoothens the data for better trend identification.
IMPORTANT:
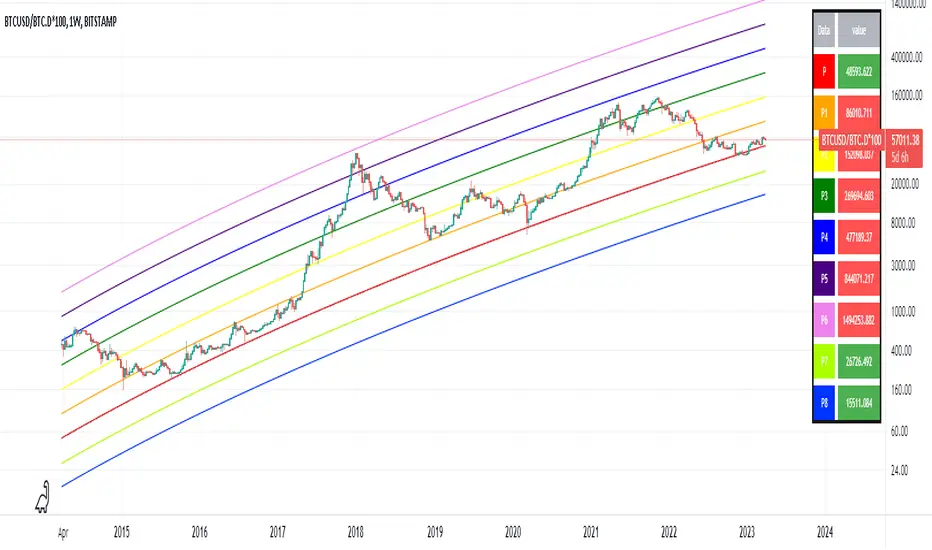
While this indicator can be applied to traditional BTC/USD charts, we highly recommend using it on the following chart for optimal results in identifying price bottoms:
BITSTAMP:BTCUSD / CRYPTOCAP:BTC.D * 100
By employing the optimized logarithmic curve indicator on the recommended chart, traders can gain a more accurate perspective on potential price bottoms, leading to improved decision-making.
In conclusion, the optimized logarithmic curve indicator provides valuable insights into Bitcoin's price movements, allowing traders and investors to make more informed decisions. We encourage you to test this refined tool and share your thoughts in the comments section. Special thanks to @quantadelic, the first creator of this indicator, for inspiring us to develop this optimized version. If you have any questions or require further clarification, please feel free to ask. Wishing you success in your trading and investment endeavors!
Please ensure you understand and abide by the TradingView House Rules when using this indicator: www.tradingview.com
Shorting when Bollinger Band Above Price with RSI (by Coinrule)The Bollinger Bands are among the most famous and widely used indicators. A Bollinger Band is a technical analysis tool defined by a set of trendlines plotted two standard deviations (positively and negatively) away from a simple moving average ( SMA ) of a security's price, but which can be adjusted to user preferences. They can suggest when an asset is oversold or overbought in the short term, thus providing the best time for buying and selling it.
The relative strength index ( RSI ) is a momentum indicator used in technical analysis. RSI measures the speed and magnitude of a security's recent price changes to evaluate overvalued or undervalued conditions in the price of that security. The RSI can do more than point to overbought and oversold securities. It can also indicate securities primed for a trend reversal or corrective pullback in price. It can signal when to buy and sell. Traditionally, an RSI reading of 70 or above indicates an overbought situation. A reading of 30 or below indicates an oversold condition.
The short order is placed on assets that present strong momentum when it's more likely that it is about to reverse. The rule strategy places and closes the order when the following conditions are met:
ENTRY
The closing price is greater than the upper standard deviation of the Bollinger Bands
The RSI is less than 70.
EXIT
The trade is closed when the RSI is less than 70
The lower standard deviation of the Bollinger Band is less than the closing price.
This strategy was backtested from the beginning of 2022 to capture how this strategy would perform in a bear market.
The strategy assumes each order to trade 70% of the available capital to make the results more realistic. A trading fee of 0.1% is taken into account. The fee is aligned to the base fee applied on Binance, which is the largest cryptocurrency exchange by volume.

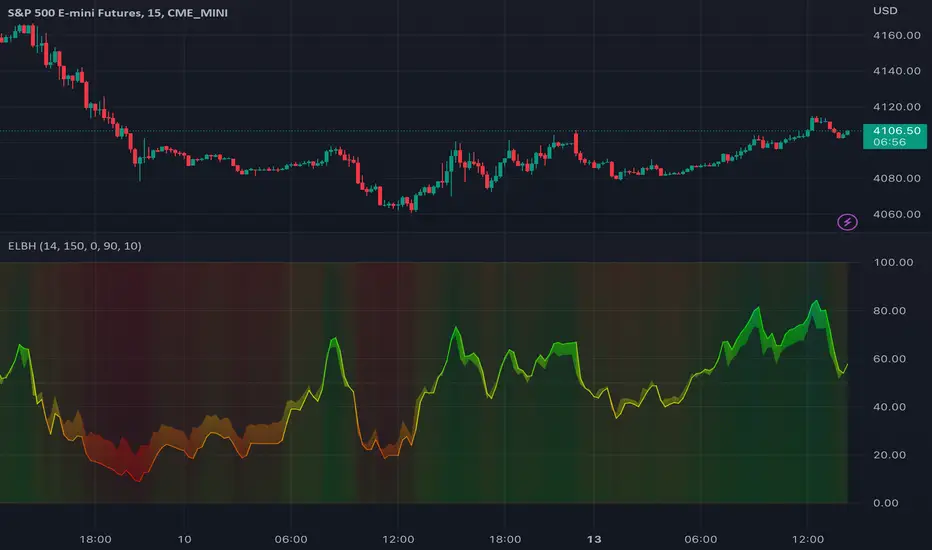
TASC 2023.03 Every Little Bit Helps█ OVERVIEW
TASC's February 2023 edition of Traders' Tips includes an article titled "Every Little Bit Helps: Averaging The Open And Close To Reduce Noise" by John Ehlers. This code implements the numerical example from this article.
█ CONCEPTS
Using theories from digital signal processing as a starting point, John Ehlers argues that using the average of the open and close as the source time series of an indicator instead of using only the closing price can often lead to noise reduction in the output. This effect especially applies when there is no gap between the current bar's opening and the previous bar's closing prices. This trick can reduce noise in many common indicators such as the RSI, MACD, and Stochastic.
█ CALCULATIONS
Following the example presented in the original publication, this script illustrates the proposed strategy using the Relative Strength Index (RSI) as a test indicator. It plots two series:
RSI calculated using only closing prices as its source.
RSI of the same length as the first, but calculated using the average of open and close prices as its source, i.e. (open+close)/2 .
This script demonstrates that using the average of open and close as the calculation source results in a smoother indicator. To visually emphasize the advantage of this proposed trick, the script's color scheme is sensitive to both the RSI value and the difference between the two RSI data streams.
Simple RSI and SMA Long and Short (by Coinrule)The relative strength index ( RSI ) is a momentum indicator used in technical analysis . RSI measures the speed and magnitude of a security's recent price changes to evaluate overvalued or undervalued conditions in the price of that security. The RSI is displayed as an oscillator (a line graph) on a scale of zero to 100. The RSI can do more than point to overbought and oversold securities. It can also indicate securities that may be primed for a trend reversal or corrective pullback in price. It can signal when to buy and sell. Traditionally, an RSI reading of 70 or above indicates an overbought situation. A reading of 30 or below indicates an oversold condition.
A simple moving average ( SMA ) calculates the average of a selected range of prices, usually closing prices, by the number of periods in that range.
The Strategy enters and closes the trade when the following conditions are met:
LONG
SMA100 is greater than SMA150
RSI is greater than 50
SHORT
SMA100 is less than SMA150
RSI is less than 50
When a long position is opened, it remains open until the conditions for a short are met at which point the long position is closed and the short position is opened. Then, when the conditions for the long position are met, the short will be closed and a long will be opened.
This strategy is back tested from 1 January 2022 to simulate how the strategy would work in a bear market. The strategy provides good returns.
The strategy assumes each order is using 30% of the available coins to make the results more realistic and to simulate you only ran this strategy on 30% of your holdings. A trading fee of 0.1% is also taken into account and is aligned to the base fee applied on Binance.

smoothed_rsi
Description:
A well-known and vastly used momentum indicator, a Relative Strength Index (RSI) by J. Welles Wilder Jr., aims to evaluate the current price to its oversold/overbought area while giving an overview of bearish/bullish momentum. In this indicator, simply adding the super-smoother function (John F. Ehlers) was applied to the RSI line to create a more smoothed line and reduce its noise.
RSI:
RSI = 100 - 100/(1+RS)
RS = AvgUp/AvgDown
super_smoother(rsi)
Notes:
RSI > 70 indicates overbought
RSI < 30 indicates oversold
direction of the RSI line
Juirk-Filtered QQE Histogram [Loxx]Juirk-Filtered QQE Histogram is a QQE indicator with 7 different RSI types, Jurik-Filtering with the option of double filtering. 2 types of signals, and Loxx's Expanded Source types. These additions are useful to filter out noise.
What is Qualitative Quantitative Estimation (QQE)?
The Qualitative Quantitative Estimation (QQE) indicator works like a smoother version of the popular Relative Strength Index ( RSI ) indicator. QQE expands on RSI by adding two volatility based trailing stop lines. These trailing stop lines are composed of a fast and a slow moving Average True Range (ATR).
There are many indicators for many purposes. Some of them are complex and some are comparatively easy to handle. The QQE indicator is a really useful analytical tool and one of the most accurate indicators. It offers numerous strategies for using the buy and sell signals. Essentially, it can help detect trend reversal and enter the trade at the most optimal positions.
What is Jurik Volty used in the Juirk Filter?
One of the lesser known qualities of Juirk smoothing is that the Jurik smoothing process is adaptive. "Jurik Volty" (a sort of market volatility ) is what makes Jurik smoothing adaptive. The Jurik Volty calculation can be used as both a standalone indicator and to smooth other indicators that you wish to make adaptive.
What is the Jurik Moving Average?
Have you noticed how moving averages add some lag (delay) to your signals? ... especially when price gaps up or down in a big move, and you are waiting for your moving average to catch up? Wait no more! JMA eliminates this problem forever and gives you the best of both worlds: low lag and smooth lines.
Ideally, you would like a filtered signal to be both smooth and lag-free. Lag causes delays in your trades, and increasing lag in your indicators typically result in lower profits. In other words, late comers get what's left on the table after the feast has already begun.
Included:
Loxx's Expanded Source Types
Alerts
Signals
Bar coloring
Included Libraries
Loxx's Variety RSI
Loxx's Jurik Tools
Loxx's Expanded Source Types
Related indicators:
Natural Market Mirror (NMM) and NMAs w/ Dynamic Zones
RSI/RSX QQE Histogram w/ Discontinued Signal Line
Jurik CFB Adaptive QQE
Adaptive Qualitative Quantitative Estimation (QQE)
Bollinger Bands and RSI Short Selling (by Coinrule)The Bollinger Bands are among the most famous and widely used indicators. A Bollinger Band is a technical analysis tool defined by a set of trendlines plotted two standard deviations (positively and negatively) away from a simple moving average ( SMA ) of a security's price, but which can be adjusted to user preferences. They can suggest when an asset is oversold or overbought in the short term, thus provide the best time for buying and selling it.
The relative strength index ( RSI ) is a momentum indicator used in technical analysis . RSI measures the speed and magnitude of a security's recent price changes to evaluate overvalued or undervalued conditions in the price of that security. The RSI can do more than point to overbought and oversold securities. It can also indicate securities that may be primed for a trend reversal or corrective pullback in price. It can signal when to buy and sell. Traditionally, an RSI reading of 70 or above indicates an overbought situation. A reading of 30 or below indicates an oversold condition.
The short order is placed on assets that present strong momentum when it's more likely that it is about to decrease further. The rule strategy places and closes the order when the following conditions are met:
ENTRY
The closing price is greater than the upper standard deviation of the Bollinger Bands
The RSI is less than 70
EXIT
The trade is closed in profit when the RSI is less than 70
Upper standard deviation of the Bollinger Band is greater than the the closing price.
This strategy comes with a stop loss and a take profit, and as you can see by the results, it is well suited for a bear market.
This trade works very well with ETH (1h timeframe), AVA (4h timeframe), and SOL (3h timeframe) and is backtested from the 1 December 2021 to capture how this strategy would perform in a bear market.
To make the results more realistic, the strategy assumes each order to trade 30% of the available capital. A trading fee of 0.1% is taken into account. The fee is aligned to the base fee applied on Binance, which is the largest cryptocurrency exchange.

RSI Precision Trend Candles [Loxx]RSI Precision Trend Candles is a candle coloring indicator that uses an average range algorithm to determine trend direction. The precision trend algorithm can be used on any calculated output to tease out interesting trend information.
What is RSI?
The relative strength index (RSI) is a momentum indicator used in technical analysis. RSI measures the speed and magnitude of a security's recent price changes to evaluate overvalued or undervalued conditions in the price of that security.
The RSI is displayed as an oscillator (a line graph) on a scale of zero to 100. The indicator was developed by J. Welles Wilder Jr. and introduced in his seminal 1978 book, New Concepts in Technical Trading Systems.
Included
Bar coloring
Signals
Alerts
Loxx's Expanded Source Types
Rma Stdev BandsStandard Deviation support resistances with percent boxes.
The Relative Moving Average isn’t a well-known moving average. But TradingView uses this average with two popular indicators: the Relative Strength Index (RSI) and Average True Range (ATR)
The weighting factors that the Relative Moving Average uses decrease exponentially. That way recent bars have the highest weight, while earlier bars get smaller weights the older they are.

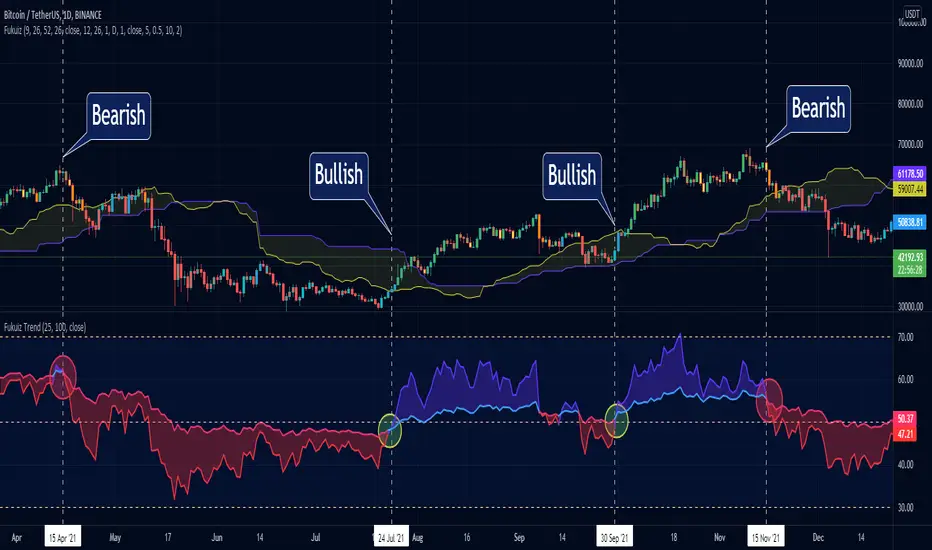
Fukuiz TrendThis indicator base on RSI of 2 different periond.
#A brief introduction to RSI #
The relative strength index (RSI) is a momentum indicator used in technical analysis that measures the magnitude of recent price changes to evaluate overbought or oversold conditions in the price of a stock or other asset. The RSI is displayed as an oscillator (a line graph that moves between two extremes) and can have a reading from 0 to 100. The indicator was originally developed by J. Welles Wilder Jr. and introduced in his seminal 1978 book, “New Concepts in Technical Trading Systems.”
Traditional interpretation and usage of the RSI are that values of 70 or above indicate that a security is becoming overbought or overvalued and may be primed for a trend reversal or corrective pullback in price. An RSI reading of 30 or below indicates an oversold or undervalued condition.
#In this indicator#
I see that you can use 2 RSI with different periond to suggest Bullish trend and Bearish trend.
#Conditions between short and long RSI crossing#
Crossover = Bullish trend (blue zone)
Crossunder = Bearish trend (red zone)
MACD With Crossings and Above Below ZeroMACD with MACD Derivative, Crossings Above and Below Zero, Shading for ADX Smoothing and Overlayed RSI
Primarily a moving average convergence divergence (MACD) momentum indicator. Also includes a MACD Derivative overlay to show when momentum has peaked. Displays triangle symbols when the MACD line crosses the signal line (larger triangle when MACD crosses above/below zero to indicator stronger momentum trend). Includes shading for average directional index (ADX) to futher determine when the price is trending strongly (red when the ADX value is greater than 25, and idicating a strong trend; otherwise blue). Lastly, has a relative strength index (RSI) momentum indicator overlayed to help evaluate periods of overbought or oversold conditions.

[VJ]Thor for MFIThis is a simple intraday strategy for working on Stocks or commodities . You can modify the start time and end time based on your timezones. Session value should be from market start to the time you want to square-off
Important: The end time should be at least 2 minutes before the intraday square-off time set by your broker
Comment below if you get good returns
Strategy:
Indicators used :
Moving average (MA) is a widely used technical indicator that smooths out price trends by filtering out the “noise” from random short-term price fluctuations. Here moving averages are used to identify trend direction and to determine support and resistance levels. Overbought and oversold regions are also taken into consideration
The Money Flow Index ( MFI ) is a momentum indicator that measures the flow of money into and out of a security over a specified period of time. It is related to the Relative Strength Index ( RSI ) but incorporates volume , whereas the RSI only considers price. The MFI is calculated by accumulating positive and negative Money Flow values (see Money Flow ), then creating a Money Ratio. The Money Ratio is then normalized into the MFI oscillator form.
Using the combination of Overbought and Oversold values and varying MFI and using the MA filter to ensure the direction , we can buy/sell when conditions are met
Buying with MFI
1. MFI drops below 20 and enters inside oversold zone.
2. MFI bounces back above 20.
3. MFI pulls back but remains above 20.
4. A MFI break out above its previous high is a good buy signal.
Selling with MFI
1. MFI rises above 80 and enters inside overbought zone.
2. MFI drops back below 80.
3. MFI rises slightly but remains below 80.
4. MFI drops lower than its previous low is a signal to short sell or profit booking
Usage & Best setting :
Choose a good volatile stock and a time frame - 5m.
MFI factor : 3
Moving Average : 80
Overbought & Oversold - can be varied as per user
There is stop loss and take profit that can be used to optimise your trade
The template also includes daily square off based on your time.

Stochastic MFIDue to some similarity of the Relative Strength Index(RSI) and Money Flow Index(MFI), I thought of creating a Stoch MFI inspired by the Stoch RSI.
- can be used similar to the Stoch RSI
- useful for pullback during trending markets and for S&R trading during ranging markets
TAYOR!

Featherlite RSI - Extra SensitiveFeatherlite RSI - Extra Sensitive
This is a combined relative strength index (RSI) ans stochastic RSI indicator set to the super sensitive period of 2 candles.
I use this setting particularly on higher timeframes such as M, W, D but can also be useful on 4h. However lower timeframes, will become to noisy.
If you compare to the standard setting of 14, you can see that the pump and dump structure is a lot more washed out
The RSI builds up slowly from its low point in 2015 to a single maximum in 2017. This is great for charting the longer cycle (interyear bull / bear), but is of little help for charting the intermediate swings. However, by increasing the sensitivity we can see when the RSI is maxing out on an intermonth basis. And indeed this matches the actual high points of the previous bull runs very well.
The indicator also includes a stochastic RSI indicator also set to the same candle period.
In practice it is always good to use a range of indicators to get a feel for what is going on. This is good for intermonth cycles on M and W timeframes. For longer cycles use the standard period setting of 14.

[Alerts]QQE Cross v6.0 by JustUncleLDescription:
This is a major upgrade of my original QQE indicator Tool, this version is directed at Forex and Crypto Margin trading. This version can also be used with AutoView/ProfitView Chrome add-on in a semi-automatic (turn on only when conditions are favorable) or automatic way, with Signal to Signal or Signal to Close trading.
This is a Trend following indicator that uses fast QQE crosses to capture swings in direction of the main Trend. Alerts are filtered with Two Moving Average Ribbons and/or Direction of MAs. The QQE or Qualitative Quantitative Estimation is based on the relative strength index (RSI), but uses a smoothing technique as an additional transformation. Three crosses can be selected (all selected by default):
Smooth RSI signal crossing ZERO (XZ)
Smooth RSI signal crossing Fast QQE line (XQ), this is like an early warning swing signal.
Smooth RSI signal exiting the RSI Threshhold Channel (XC), this is like a confirmed swing signal. An optimal Smooth RSI threshold level is between 5% and 10% (default=10), it helps reduce the false swings.
These signals can be selected to Open Short/Long and/or Close a trade, default is XC open trade and XQ (or opposite open) to Close trade.
The (LONG/SHORT) alerts can be optionally filtered by the Moving Average Ribbons:
For LONG alert the Close must be above the fast MA Ribbon and fast MA Ribbon must be above the slow MA Ribbon.
For SHORT alert the Close must be below the fast MA Ribbon and fast MA Ribbon must be below the slow MA Ribbon.
and/or directional filter:
For LONG alert the Close must be above the medium MA and the directional of both MA ribbons must be Bullish.
For SELL alert the Close must be below the medium MA and the directional of both MA ribbons must be Bearish.
This indicator is designed to be used as a Signal to Signal trading BOT in automatic or semi-automatic way (start and stop when conditions are suitable).
For LONG and SHORT alerts I recommend you use "Once per Bar" alarm option
For CLOSE alerts I recommend you use "Once per Bar Close" alarm option
(* The script has been designed so that long/short signals come at start of candles *)
(* and close signals come at the end of candles *)

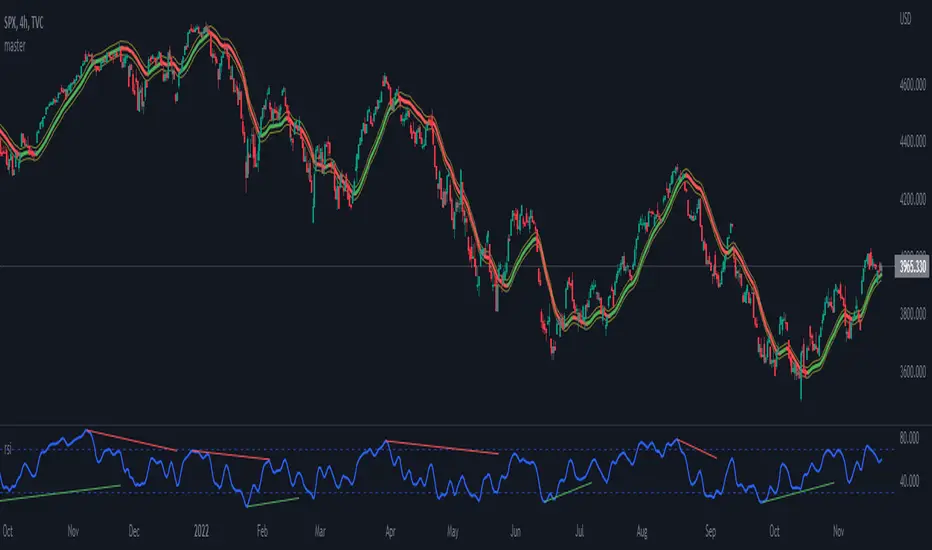
RSI Multi-TimeframeThe Relative Strength Index (RSI) is an extremely useful oscillating momentum indicator that was developed by J. Welles Wilder and is one of the most widely used indicators in technical analysis.
HOW IS IT USED ?
In the classic view, a security is thought to be overbought when its RSI reading is above 70 and oversold when its RSI reading falls below 30. This makes it a good indicator for mean-reversion systems. Wilder recommended using the 70 and 30 levels as overbought and oversold levels respectively. When the RSI moves up over the 30 line it is considered a possible bullish reversal while a move down below the 70 line is considered a possible bearish reversal.
When the RSI is above 70 it is a potential exit signal if you are in a long position and when it is below 30 it is a potential exit signal if you are in a short position. Some traders use extreme readings for entry points in the direction of the long-term trend. Thus, if the long-term trend is bullish, then you'd wait for the RSI to reach oversold territory, which would be a potential entry point for a long position. Conversely, if the long-term trend is bearish, then overbought conditions could be a potential point to short the security.
I added the possibility to add on the chart a 2nd timeframe for confirmation.
If you found this script useful, a tip is always welcome... :)

Multi-Timeframe RSI Momentum StrategyMulti-Timeframe RSI Momentum Strategy
To display two different timeframes of the Relative Strength Index (RSI) on TradingView, you can utilize the "Multi-Timeframe RSI" indicator or a similar custom script. This allows you to visualize the RSI for both your current chart's timeframe and a higher (or lower) timeframe, providing a more comprehensive view of momentum

SwingSignal RSI Overlay AdvancedSwingSignal RSI Overlay Advanced
By BFAS
This advanced indicator leverages the Relative Strength Index (RSI) to pinpoint critical market reversal points by highlighting key swing levels with intuitive visual markers.
Key Features:
Detects overbought and oversold levels with customizable RSI period and threshold settings.
Visually marks swing points:
Red star (HH) for Higher Highs.
Yellow star (LH) for Lower Highs.
Blue star (HL) for Higher Lows.
Green star (LL) for Lower Lows.
Connects swings with lines, aiding in the analysis of market structure.
Optimized for use on the main chart (overlay), tracking candles in real time.
This indicator provides robust visual support for traders aiming to identify price patterns related to RSI momentum, facilitating entry and exit decisions based on clear swing signals.

RSI+BOLLINGER (LONG & SHORT)This indicator combines two of the most popular tools in technical analysis, the Relative Strength Index (RSI) and Bollinger Bands (BB), to generate both long (BUY) and short (SELL) trading signals.
Strategy:
Entries (Buy/Short): Entry signals are based on the RSI.
A BUY is suggested when the RSI crosses above an oversold level (default: 29), indicating a possible upward reversal.
A SHORT is suggested when the RSI crosses below an overbought level (default: 71), indicating a possible downward reversal.
Exits (Position Closure): Exit signals are based on Bollinger Bands.
A long position is closed when the price crosses below the upper Bollinger Band.
A short position is closed when the price crosses above the lower Bollinger Band.
Key Features:
Cascade Filter: Includes a smart filter that prevents opening new consecutive trades if the price hasn't moved significantly in favor of a new entry, optimizing signal quality.
Automation Alerts: Generates detailed alerts in JSON format for each event (buy, sell, close), designed for easy integration with trading bots and automated systems via webhooks.
Fully Configurable: All parameters of the RSI, Bollinger Bands, and strategy filters can be adjusted from the indicator’s settings menu.

RSI Long Only with Confirmed CrossbacksThis RSI-based long-only strategy aims to identify and trade potential reversals with confirmation to reduce false signals. It enters a long position only after the Relative Strength Index (RSI) first dips below a specified oversold threshold (default 44) and then crosses back above it, signaling a possible bullish reversal with momentum. The strategy avoids premature entries by requiring this two-step confirmation. Similarly, it exits the long position only after RSI first rises above the overbought threshold (default 70) and then crosses back below it, indicating a potential loss of bullish momentum. By waiting for RSI to travel beyond the thresholds and then revert, the strategy attempts to capture stronger and more reliable directional moves while filtering out temporary spikes.

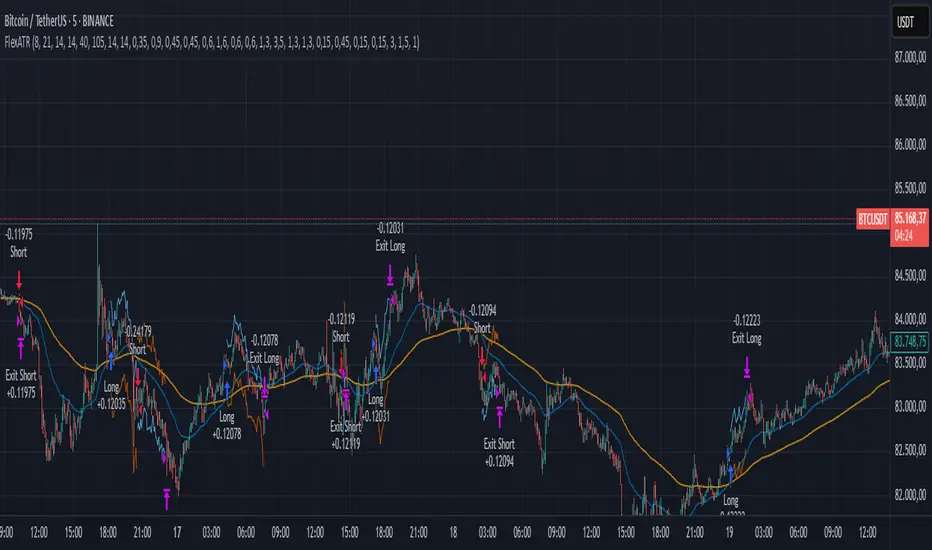
FlexATRFlexATR: A Dynamic Multi-Timeframe Trading Strategy
Overview: FlexATR is a versatile trading strategy that dynamically adapts its key parameters based on the timeframe being used. It combines technical signals from exponential moving averages (EMAs) and the Relative Strength Index (RSI) with volatility-based risk management via the Average True Range (ATR). This approach helps filter out false signals while adjusting to varying market conditions — whether you’re trading on a daily chart, intraday charts (30m, 60m, or 5m), or even on higher timeframes like the 4-hour or weekly charts.
How It Works:
Multi-Timeframe Parameter Adaptation: FlexATR is designed to automatically adjust its indicator settings depending on the timeframe:
Daily and Weekly: On higher timeframes, the strategy uses longer periods for the fast and slow EMAs and standard periods for RSI and ATR to capture more meaningful trend confirmations while minimizing noise.
Intraday (e.g., 30m, 60m, 5m, 4h): The parameters are converted from “days” into the corresponding number of bars. For instance, on a 30-minute chart, a “day” might equal 48 bars. The preset values for a 30-minute chart have been slightly reduced (e.g., a fast EMA is set at 0.35 days instead of 0.4) to improve reactivity while maintaining robust filtering.
Signal Generation:
Entry Signals: The strategy enters long positions when the fast EMA crosses above the slow EMA and the RSI is above 50, and it enters short positions when the fast EMA crosses below the slow EMA with the RSI below 50. This dual confirmation helps ensure that signals are reliable.
Risk Management: The ATR is used to compute dynamic levels for stop loss and profit target:
Stop Loss: For a long position, the stop loss is placed at Price - (ATR × Stop Loss Multiplier). For a short position, it is at Price + (ATR × Stop Loss Multiplier).
Profit Target: The profit target is similarly set using the ATR multiplied by a designated profit multiplier.
Dynamic Trailing Stop: FlexATR further incorporates a dynamic trailing stop (if enabled) that adjusts according to the ATR. This trailing stop follows favorable price movements at a distance defined by a multiplier, locking in gains as the trend develops. The use of a trailing stop helps protect profits without requiring a fixed exit point.
Capital Allocation: Each trade is sized at 10% of the total equity. This percentage-based position sizing allows the strategy to scale with your account size. While the current setup assumes no leverage (a 1:1 exposure), the inherent design of the strategy means you can adjust the leverage externally if desired, with risk metrics scaling accordingly.
Visual Representation: For clarity and accessibility (especially for those with color vision deficiencies), FlexATR employs a color-blind friendly palette (the Okabe-Ito palette):
EMA Fast: Displayed in blue.
EMA Slow: Displayed in orange.
Stop Loss Levels: Rendered in vermilion.
Profit Target Levels: Shown in a distinct azzurro (light blue).
Benefits and Considerations:
Reliability: By requiring both EMA crossovers and an RSI confirmation, FlexATR filters out a significant amount of market noise, which reduces false signals at the expense of some delayed entries.
Adaptability: The automatic conversion of “day-based” parameters into bar counts for intraday charts means the strategy remains consistent across different timeframes.
Risk Management: Using the ATR for both fixed and trailing stops allows the strategy to adapt to changing market volatility, helping to protect your capital.
Flexibility: The strategy’s inputs are customizable via the input panel, allowing traders to fine-tune the parameters for different assets or market conditions.
Conclusion: FlexATR is designed as a balanced, adaptive strategy that emphasizes reliability and robust risk management across a variety of timeframes. While it may sometimes enter trades slightly later due to its filtering mechanism, its focus on confirming trends helps reduce the likelihood of false signals. This makes it particularly attractive for traders who prioritize a disciplined, multi-timeframe approach to capturing market trends.