TechniTrend RSI (11TF)Multi-Timeframe RSI Indicator
Overview
The Multi-Timeframe RSI Indicator is a sophisticated tool designed to provide comprehensive insights into the Relative Strength Index (RSI) across 11 different timeframes simultaneously. This indicator is essential for traders who wish to monitor RSI trends and their moving averages (MA) to make informed trading decisions.
Features
Multiple Timeframes: Displays RSI and RSI MA values for 11 different timeframes, allowing traders to have a holistic view of the market conditions.
RSI vs. MA Comparison: Indicates whether the RSI value is above or below its moving average for each timeframe, helping traders to identify bullish or bearish momentum.
Overbought/Oversold Signals:
Marks "OS" (OverSell) when RSI falls below 25, indicating a potential oversold condition.
Marks "OB" (OverBuy) when RSI exceeds 75, signaling a potential overbought condition.
Real-Time Updates: Continuously updates in real-time to provide the most current market information.
Usage
This indicator is invaluable for traders who utilize RSI as part of their technical analysis strategy. By monitoring multiple timeframes, traders can:
Identify key overbought and oversold levels to make entry and exit decisions.
Observe the momentum shifts indicated by RSI crossing above or below its moving average.
Enhance their trading strategy by integrating multi-timeframe analysis for better accuracy and confirmation.
How to Interpret the Indicator
RSI Above MA: Indicates a potential bullish trend. Traders may consider looking for long positions.
RSI Below MA: Suggests a potential bearish trend. Traders may look for short positions.
OS (OverSell): When RSI < 25, the market may be oversold, presenting potential buying opportunities.
OB (OverBuy): When RSI > 75, the market may be overbought, indicating potential selling opportunities.
在腳本中搜尋"Relative"

Advanced Gold Scalping Strategy with RSI Divergence# Advanced Gold Scalping Strategy with RSI Divergence
## Overview
This Pine Script implements an advanced scalping strategy for gold (XAUUSD) trading, primarily designed for the 1-minute timeframe. The strategy utilizes the Relative Strength Index (RSI) indicator along with its moving average to identify potential trade setups based on divergences between price action and RSI movements.
## Key Components
### 1. RSI Calculation
- Uses a customizable RSI length (default: 60)
- Allows selection of the source for RSI calculation (default: close price)
### 2. Moving Average of RSI
- Supports multiple MA types: SMA, EMA, SMMA (RMA), WMA, VWMA, and Bollinger Bands
- Customizable MA length (default: 3)
- Option to display Bollinger Bands with adjustable standard deviation multiplier
### 3. Divergence Detection
- Implements both bullish and bearish divergence identification
- Uses pivot high and pivot low points to detect divergences
- Allows for customization of lookback periods and range for divergence detection
### 4. Entry Conditions
- Long Entry: Bullish divergence when RSI is below 40
- Short Entry: Bearish divergence when RSI is above 60
### 5. Trade Management
- Stop Loss: Customizable, default set to 11 pips
- Take Profit: Customizable, default set to 33 pips
### 6. Visualization
- Plots RSI line and its moving average
- Displays horizontal lines at 30, 50, and 70 RSI levels
- Shows Bollinger Bands when selected
- Highlights divergences with "Bull" and "Bear" labels on the chart
## Input Parameters
- RSI Length: Adjusts the period for RSI calculation
- RSI Source: Selects the price source for RSI (close, open, high, low, hl2, hlc3, ohlc4)
- MA Type: Chooses the type of moving average applied to RSI
- MA Length: Sets the period for the moving average
- BB StdDev: Adjusts the standard deviation multiplier for Bollinger Bands
- Show Divergence: Toggles the display of divergence labels
- Stop Loss: Sets the stop loss distance in pips
- Take Profit: Sets the take profit distance in pips
## Strategy Logic
1. **RSI Calculation**:
- Computes RSI using the specified length and source
- Calculates the chosen type of moving average on the RSI
2. **Divergence Detection**:
- Identifies pivot points in both price and RSI
- Checks for higher lows in RSI with lower lows in price (bullish divergence)
- Checks for lower highs in RSI with higher highs in price (bearish divergence)
3. **Trade Entry**:
- Enters a long position when a bullish divergence is detected and RSI is below 40
- Enters a short position when a bearish divergence is detected and RSI is above 60
4. **Position Management**:
- Places a stop loss order at the entry price ± stop loss pips (depending on the direction)
- Sets a take profit order at the entry price ± take profit pips (depending on the direction)
5. **Visualization**:
- Plots the RSI and its moving average
- Draws horizontal lines for overbought/oversold levels
- Displays Bollinger Bands if selected
- Shows divergence labels on the chart for identified setups
## Usage Instructions
1. Apply the script to a 1-minute XAUUSD (Gold) chart in TradingView
2. Adjust the input parameters as needed:
- Increase RSI Length for less frequent but potentially more reliable signals
- Modify MA Type and Length to change the sensitivity of the RSI moving average
- Adjust Stop Loss and Take Profit levels based on current market volatility
3. Monitor the chart for Bull (long) and Bear (short) labels indicating potential trade setups
4. Use in conjunction with other analysis and risk management techniques
## Considerations
- This strategy is designed for short-term scalping and may not be suitable for all market conditions
- Always backtest and forward test the strategy before using it with real capital
- The effectiveness of divergence-based strategies can vary depending on market trends and volatility
- Consider using additional confirmation signals or filters to improve the strategy's performance
Remember to adapt the strategy parameters to your risk tolerance and trading style, and always practice proper risk management.

Enhanced Reversal DetectionScript Description:
The "Enhanced Reversal Detection" indicator is a powerful tool designed to identify potential market reversals across various financial instruments. It incorporates a sophisticated algorithm that analyzes price action along with key technical indicators such as the Relative Strength Index (RSI), Bollinger Bands, and Moving Average (MA).
How to Use:
Adjustable Parameters: The indicator offers a range of adjustable parameters to cater to different trading preferences and market conditions.
RSI Length: Adjusts the length of the RSI calculation to fine-tune sensitivity.
Overbought Level: Sets the threshold for identifying overbought conditions on the RSI scale.
Oversold Level: Sets the threshold for identifying oversold conditions on the RSI scale.
Bollinger Bands Length: Determines the length of the Bollinger Bands calculation.
Bollinger Bands Multiplier: Adjusts the standard deviation multiplier for the Bollinger Bands, influencing band width.
Moving Average Length: Defines the length of the Moving Average calculation to capture trend direction.
Min Bars Between Signals: Sets the minimum number of bars required between consecutive reversal signals.
ADX Length: Adjusts the length of the Average Directional Index (ADX) calculation.
ADX Threshold: Defines the threshold value for ADX, serving as a filter for reversal signals.
Signal Generation: The indicator generates signals for both bullish and bearish reversals based on predefined criteria. A bullish reversal signal is triggered when the closing price exceeds the lower Bollinger Band and RSI falls below the oversold threshold. Conversely, a bearish reversal signal occurs when the closing price falls below the upper Bollinger Band and RSI surpasses the overbought threshold.
Alerts: Traders can opt to receive alerts for bullish and bearish reversal signals, enabling them to stay informed of potential trading opportunities even when away from the platform.
Publication Readiness:
To ensure readiness for publication in the TradingView public library, the script has been meticulously crafted and documented:
The code is extensively commented to provide clear explanations of parameters, calculations, and signal generation logic.
Best coding practices have been followed to enhance readability and maintainability.
Rigorous testing has been conducted to validate the accuracy and reliability of signal generation across various market conditions.
The script adheres to TradingView's guidelines and policies for script publication, ensuring compliance with platform standards and user expectations.
With its comprehensive features and user-friendly design, the "Enhanced Reversal Detection" indicator is poised to become a valuable asset for traders seeking to identify high-probability reversal opportunities in the financial markets.

Support Resistance base Volume RSIThe indicator displays support and resistance levels based on volume and the Relative Strength Index (RSI).
Variable and Input Assignment:
lookback: Determines the period for data lookback.
RsiVisible, RsilabelSize, OversoldForRsi, OverboughtForRsi: Various inputs to adjust RSI indicator parameters.
Indicator Calculation:
highestVol: Finds the highest volume within a certain period.
Rsi: Calculates the RSI value with a period of 14.
roc: Calculates the Rate of Change.
Support and Resistance Level Determination:
Uses a comparison between price change (roc) and RSI value to determine whether the price is rising or falling.
If the price is rising and the current volume is greater than the previous highest volume, a new resistance level is established.
If the price is falling and the current volume is greater than the previous highest volume, a new support level is established.
Support and Resistance Lines:
Creates lines indicating the latest support and resistance levels.
These lines are updated whenever there is a change in support or resistance levels.
RSI Labels:
Displays the RSI value above or below the price chart depending on whether the RSI is above or below the overbought or oversold levels.
If the RSI value is above the overbought level, the label is displayed above the price.
If the RSI value is below the oversold level, the label is displayed below the price.
Labels are removed if the corresponding conditions are not met.
Additional RSI Label:
Adds an additional label displaying the RSI value next to the price chart on the last bar.
The main purpose of this script is to assist traders in identifying support and resistance levels based on price movement, volume, and the RSI indicator. Thus, traders can use this information to make better trading decisions.

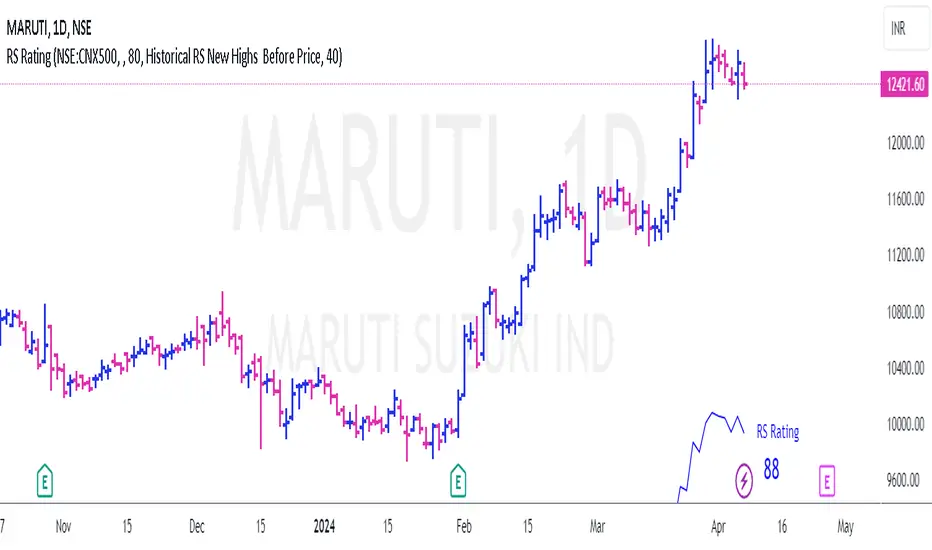
RS Rating for Indian MarketRS Rating for Trading View
This Trading View script calculates the Relative Price Strength (RS) Rating for a given stock. It's a measure of a stock's price performance over the last twelve months, compared to all stocks in a selected Index. The rating scale ranges from 1 (lowest) to 99 (highest).
Features
- Adaptation for Indian Market
- Option to choose the index to compare to (NSE:NIFTY, NSE:CNX500, NSE:NIFTYSMLCAP250, NSE:CNXSMALLCAP)
- Option to compare to a different index
- Option to hide the RS rating
- Option to plot RS new highs
- Option to adjust the offset of the line for display purposes
- Option to change the color of the RS Line & Rating
- Option to change the color of the dots for RS new highs
- Option to choose which new high to plot (RS New Highs, RS New Highs Before Price, Historical RS New Highs, Historical RS New Highs Before Price)
- Option to adjust the recent high look-back count
Please note that the script is designed to work best in the daily timeframe. Results may not be accurate in other timeframes.
This script uses three methods to calculate the RS Rating:
1. A method that calculates how the stock behaves vs SMA.
2. A classic performance method that calculates the performance of the stock's closing price vs the closing price 3 months back.
3. A method that measures how the stock performs against the comparative Symbol.
The final RS Rating is a combination of the results from these three methods. The script also includes some adjustments based on observations to improve the accuracy of the rating.
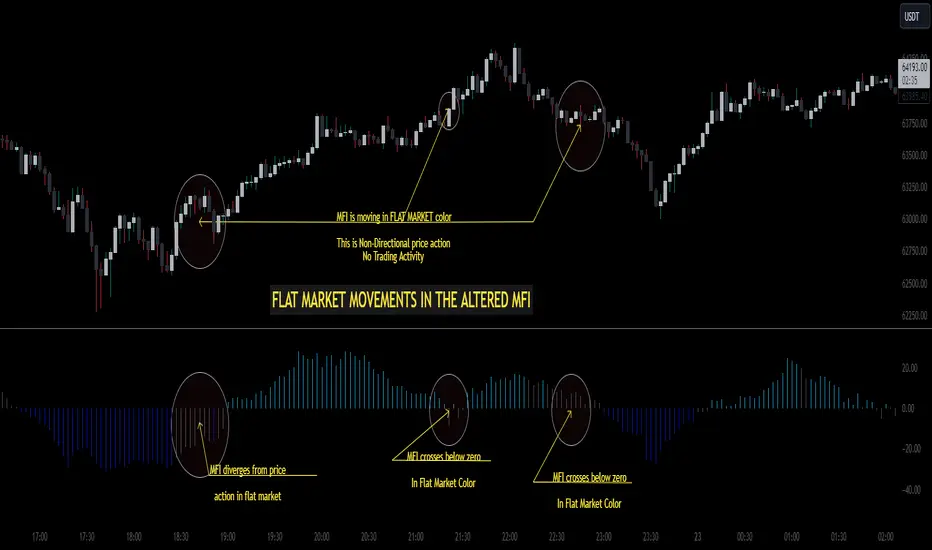
Altered Money Flow Index by CoffeeShopCrypto**Use the comments section below to request access to the script**
Market Trends need to be confirmed each and every time.
Over the years the Money Flow Index has been a tool to find where the money is flowing
either long or short in market movements.
Long confirmation and false short
Confirming a long entry:
1. Wait for price to close above a previous swing high.
2. Look to see if the MFI is in UPCOLOR and above ZERO.
Confriming a short entry:
1. Wait for price to close below a previous swing low.
2. Look to see if the MFI is in DOWNCOLOR and below ZERO.
NON-Confirmed market: (Flat Market)
Anytime you believe you have a confirmation via price action, check the MFI to see if it is in FLAT MARKET color.
If this is true, do not enter until it is out of FLAT MARKET color.
Flat Market ALtered MFI
A Flat Market Altered MFI reading can do a few things for you.
It can help to confirm the following:
1. price action is moving sideways.
2. a pullback or market stall that was deep enough where dis-intrest in the market occured.
3. a sudden loss of momentum in the short term trend of closing prices.
Utilizing the Altered Money Flow Index indicator by CoffeeShopCrypto offers traders a nuanced approach to identifying market trends, including periods of flat market conditions. Alongside its directional bias indicating bullish or bearish activity based on whether values are above or below zero, respectively, the script incorporates a distinctive feature to recognize flat markets. When neither bullish nor bearish momentum dominates, the indicator designates a flat market, denoted by a distinct color. This feature enhances traders' ability to discern not only bullish and bearish phases but also periods of market consolidation or indecision.
In addition to its ability to recognize bullish and bearish trends, the Altered Money Flow Index indicator by CoffeeShopCrypto incorporates a unique feature to signify potential pullbacks or pauses in market momentum. This is particularly evident when the MFI crosses below zero while displaying a flat market color. Such occurrences suggest that although the short-term movement may appear bearish, it's likely a temporary pullback rather than a sustained trend reversal. Similarly, when the MFI crosses above zero amidst a flat market color, it indicates a potential pause in bullish momentum, urging traders to exercise caution and await confirmation of a sustained uptrend. By incorporating these nuanced observations, traders can effectively discern between short-term fluctuations and significant trend changes, enabling them to make more judicious trading decisions and avoid premature entries or exits.
Alongside its directional bias indicating bullish or bearish activity based on whether values are above or below zero, respectively, the script integrates the Relative Strength Index (RSI) to further refine market analysis. When the Altered MFI and RSI are both above zero, it suggests a strong bullish trend, indicating significant buying pressure. Conversely, when both indicators are below zero, it indicates a strong bearish trend, signifying heightened selling pressure. By observing the confluence between the Altered MFI and RSI, traders can gain valuable confirmation of bullish or bearish money flow in the market, enabling them to make more informed trading decisions.
RSI / Connectable [Azullian]Enhance your trading approach with the modular RSI indicator, skilled in identifying market extremes. Simplify pattern visualization and signal weighting for more efficient strategy formulation.
This connectable RSI indicator is part of an indicator system designed to help test, visualize and build strategy configurations without coding. Like all connectable indicators , it interacts through the TradingView input source, which serves as a signal connector to link indicators to each other. All connectable indicators send signal weight to the next node in the system until it reaches either a connectable signal monitor, signal filter and/or strategy.
█ UNIFORM SETTINGS AND A WAY OF WORK
Although connectable indicators may have specific weight scoring conditions, they all aim to follow a standardized general approach to weight scoring settings, as outlined below.
■ Connectable indicators - Settings
• 🗲 Energy: Energy applies an ATR multiplier to the plotted shapes on the chart. A higher value plots shapes farther away from the candle, enhancing visibility.
• ☼ Brightness: Brightness determines the opacity of the shape plotted on the chart, aiding visibility. Indicator weight also influences opacity.
• → Input: Use the input setting to specify a data source for the indicator. Here you can connect the indicator to other indicators.
• ⌥ Flow: Determine where you want to receive signals from:
○ Both: Weights from this indicator and the connected indicator will apply
○ Indicator only: Only weights from this indicator will apply
○ Input only: Only weights from the connected indicator will apply
• ⥅ Weight multiplier: Multiply all weights in the entire indicator by a given factor, useful for quickly testing different indicators in a granular setup.
• ⥇ Threshold: Set a threshold to indicate the minimum amount of weight it should receive to pass it through to the next indicator.
• ⥱ Limiter: Set a hard limit to the maximum amount of weight that can be fed through the indicator.
■ Connectable indicators - Weight scoring settings
▢ Weight scoring conditions
• SM – Signal mode: Enable specific conditions for weight scoring
○ All: All signals will be scored.
○ Entries only: Only entries will score.
○ Exits only: Only exits will score.
○ Entries & exits: Both entries and exits will score.
○ Zone: Continuous scoring for each candle within the zone.
• SP – Signal period: Defines a range of candles within which a signal can score.
• SC - Signal count: Specifies the number of bars to retrospectively examine and score.
○ Single: Score for a single occurrence
○ All occurrences: Score for all occurrences
○ Single + Threshold: Score for single occurrences within the signal period (SP)
○ Every + Threshold: Score for all occurrences within the signal period (SP)
▢ Weight scoring direction
• ES: Enter Short weight
• XL: Exit long weight
• EL: Enter Long weight
• XS: Exit Short weight
▢ Weight scoring values
• Weights can hold either positive or negative scores. Positive weights enhance a particular trading direction, while negative weights diminish it.
■ Entries, exits and zone illustrated on a standard RSI indicator when the RSI is overbought.
█ RSI - INDICATOR SETTINGS
■ Main settings
• Enable/Disable Indicator: Toggle the entire indicator on or off.
• S - Source: Choose an alternative data source for the RSI calculation.
• T - Timeframe: Select an alternative timeframe for the RSI calculation.
• LE - Length: Define the number of bars or periods used in the RSI calculation.
• OB - Overbought Level: Determine the RSI value at which overbought conditions are met.
• OS - Oversold Level: Specify the RSI value at which oversold conditions are met.
■ Scoring functionality
• The RSI scores long entries when the RSI enters OS: oversold area
• The RSI scores long exits when the RSI exits OS: oversold area
• The RSI scores long zones the entire time the RSI is in OS: oversold area
• The RSI scores short entries when the RSI enters OB: overbought area
• The RSI scores short exits when the RSI exits OB: overbought area
• The RSI scores short zones the entire time the RSI is in OB: overbought area
█ PLOTTING
• Standard: Symbols (EL, XS, ES, XL) appear relative to candles based on set conditions. Their opacity and position vary with weight.
• Conditional Settings: A larger icon appears if global conditions are met. For instance, with a Threshold(⥇) of 12, Signal Period (SP) of 3, and Scoring Condition (SC) set to "EVERY", an RSI signaling over two times in 3 candles (scoring 6 each) triggers a larger icon.
█ USAGE OF CONNECTABLE INDICATORS
■ Connectable chaining mechanism
Connectable indicators can be connected directly to the signal monitor, signal filter or strategy , or they can be daisy chained to each other while the last indicator in the chain connects to the signal monitor, signal filter or strategy. When using a signal filter you can chain the filter to the strategy input to make your chain complete.
• Direct chaining: Connect an indicator directly to the signal monitor, signal filter or strategy through the provided inputs (→).
• Daisy chaining: Connect indicators using the indicator input (→). The first in a daisy chain should have a flow (⌥) set to 'Indicator only'. Subsequent indicators use 'Both' to pass the previous weight. The final indicator connects to the signal monitor, signal filter, or strategy.
■ Set up this indicator with a signal filter and strategy
The indicator provides visual cues based on signal conditions. However, its weight system is best utilized when paired with a connectable signal filter, signal monitor, or strategy .
Let's connect the RSI to a connectable signal filter and a strategy :
1. Load all relevant indicators
• Load RSI / Connectable
• Load Signal filter / Connectable
• Load Strategy / Connectable
2. Signal Filter: Connect the RSI to the Signal Filter
• Open the signal filter settings
• Choose one of the three input dropdowns (1→, 2→, 3→) and choose : RSI / Connectable: Signal Connector
• Toggle the enable box before the connected input to enable the incoming signal
3. Signal Filter: Update the filter signals settings if needed
• The default settings of the filter enable EL (Enter Long), XL (Exit Long), ES (Enter Short) and XS (Exit Short).
4. Signal Filter: Update the weight threshold settings if needed
• All connectable indicators load by default with a score of 6 for each direction (EL, XL, ES, XS)
• By default, weight threshold (TH) is set at 5. This allows each occurrence to score, as the default score in each connectable indicator is 1 point above the threshold. Adjust to your liking.
5. Strategy: Connect the strategy to the signal filter in the strategy settings
• Select a strategy input → and select the Signal filter: Signal connector
6. Strategy: Enable filter compatible directions
• Set the signal mode of the strategy to a compatible direction with the signal filter.
Now that everything is connected, you'll notice green spikes in the signal filter representing long signals, and red spikes indicating short signals. Trades will also appear on the chart, complemented by a performance overview. Your journey is just beginning: delve into different scoring mechanisms, merge diverse connectable indicators, and craft unique chains. Instantly test your results and discover the potential of your configurations. Dive deep and enjoy the process!
█ BENEFITS
• Adaptable Modular Design: Arrange indicators in diverse structures via direct or daisy chaining, allowing tailored configurations to align with your analysis approach.
• Streamlined Backtesting: Simplify the iterative process of testing and adjusting combinations, facilitating a smoother exploration of potential setups.
• Intuitive Interface: Navigate TradingView with added ease. Integrate desired indicators, adjust settings, and establish alerts without delving into complex code.
• Signal Weight Precision: Leverage granular weight allocation among signals, offering a deeper layer of customization in strategy formulation.
• Advanced Signal Filtering: Define entry and exit conditions with more clarity, granting an added layer of strategy precision.
• Clear Visual Feedback: Distinct visual signals and cues enhance the readability of charts, promoting informed decision-making.
• Standardized Defaults: Indicators are equipped with universally recognized preset settings, ensuring consistency in initial setups across different types like momentum or volatility.
• Reliability: Our indicators are meticulously developed to prevent repainting. We strictly adhere to TradingView's coding conventions, ensuring our code is both performant and clean.
█ COMPATIBLE INDICATORS
Each indicator that incorporates our open-source 'azLibConnector' library and adheres to our conventions can be effortlessly integrated and used as detailed above.
For clarity and recognition within the TradingView platform, we append the suffix ' / Connectable' to every compatible indicator.
█ COMMON MISTAKES, CLARIFICATIONS AND TIPS
• Removing an indicator from a chain: Deleting a linked indicator and confirming the "remove study tree" alert will also remove all underlying indicators in the object tree. Before removing one, disconnect the adjacent indicators and move it to the object stack's bottom.
• Point systems: The azLibConnector provides 500 points for each direction (EL: Enter long, XL: Exit long, ES: Enter short, XS: Exit short) Remember this cap when devising a point structure.
• Flow misconfiguration: In daisy chains the first indicator should always have a flow (⌥) setting of 'indicator only' while other indicator should have a flow (⌥) setting of 'both'.
• Hide attributes: As connectable indicators send through quite some information you'll notice all the arguments are taking up some screenwidth and cause some visual clutter. You can disable arguments in Chart Settings / Status line.
• Layout and abbreviations: To maintain a consistent structure, we use abbreviations for each input. While this may initially seem complex, you'll quickly become familiar with them. Each abbreviation is also explained in the inline tooltips.
• Inputs: Connecting a connectable indicator directly to the strategy delivers the raw signal without a weight threshold, meaning every signal will trigger a trade.
█ A NOTE OF GRATITUDE
Through years of exploring TradingView and Pine Script, we've drawn immense inspiration from the community's knowledge and innovation. Thank you for being a constant source of motivation and insight.
█ RISK DISCLAIMER
Azullian's content, tools, scripts, articles, and educational offerings are presented purely for educational and informational uses. Please be aware that past performance should not be considered a predictor of future results.

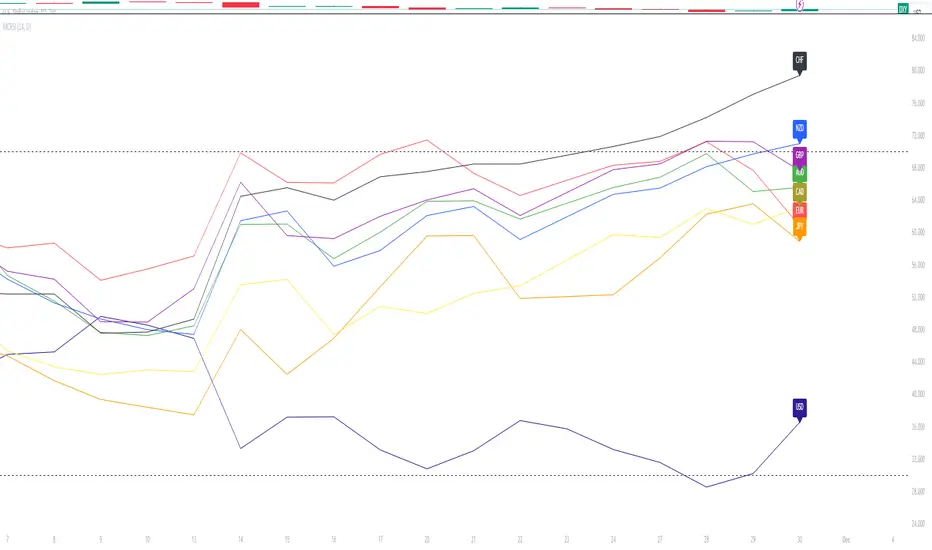
Major Currency RSI Indicator (MCRSI)Experience the power of multi-dimensional analysis with our Multi-Currency RSI Indicator (MCRSI). This innovative tool allows traders to simultaneously track and compare the Relative Strength Index (RSI) of eight different currencies in a single chart.
The MCRSI calculates the RSI for USD (DXY), EUR (EXY), JPY (JXY), CAD (CXY), AUD (AXY), NZD (ZXY), GBP (BXY), and CHF (SXY), covering a broad range of the forex market. Each RSI line is color-coded for easy differentiation and equipped with labels at the last bar for a clutter-free view.
Our indicator is designed with user-friendly customization features. You can easily adjust the length of the RSI and the time frame according to your trading strategy. It also handles gaps in the chart data with the barmerge.gaps_on option, ensuring accurate and consistent RSI calculations.
Whether you are a novice trader seeking to understand market dynamics better or an experienced trader wanting to diversify your technical analysis, the MCRSI offers a unique perspective of the forex market. This multi-currency approach can help identify potential trading opportunities that could be missed when analyzing currencies in isolation.
Harness the power of multi-currency RSI analysis with our MCRSI Indicator. It's time to step up your trading game!
Features:
Tracks 8 different currencies simultaneously
Color-coded RSI lines for easy identification
Customizable RSI length and time frame
Handles gaps in chart data
Last bar labels for a clutter-free view
Ideal for forex traders of all experience levels
How to Use:
Add the MCRSI to your TradingView chart.
Adjust the RSI length and time frame as needed.
Monitor the RSI lines and their intersections for potential trading signals.
Happy trading!
Advanced Dynamic Threshold RSI [Elysian_Mind]Advanced Dynamic Threshold RSI Indicator
Overview
The Advanced Dynamic Threshold RSI Indicator is a powerful tool designed for traders seeking a unique approach to RSI-based signals. This indicator combines traditional RSI analysis with dynamic threshold calculation and optional Bollinger Bands to generate weighted buy and sell signals.
Features
Dynamic Thresholds: The indicator calculates dynamic thresholds based on market volatility, providing more adaptive signal generation.
Performance Analysis: Users can evaluate recent price performance to further refine signals. The script calculates the percentage change over a specified lookback period.
Bollinger Bands Integration: Optional integration of Bollinger Bands for additional confirmation and visualization of potential overbought or oversold conditions.
Customizable Settings: Traders can easily customize key parameters, including RSI length, SMA length, lookback bars, threshold multiplier, and Bollinger Bands parameters.
Weighted Signals: The script introduces a unique weighting mechanism for signals, reducing false positives and improving overall reliability.
Underlying Calculations and Methods
1. Dynamic Threshold Calculation:
The heart of the Advanced Dynamic Threshold RSI Indicator lies in its ability to dynamically calculate thresholds based on multiple timeframes. Let's delve into the technical details:
RSI Calculation:
For each specified timeframe (1-hour, 4-hour, 1-day, 1-week), the Relative Strength Index (RSI) is calculated using the standard 14-period formula.
SMA of RSI:
The Simple Moving Average (SMA) is applied to each RSI, resulting in the smoothing of RSI values. This smoothed RSI becomes the basis for dynamic threshold calculations.
Dynamic Adjustment:
The dynamically adjusted threshold for each timeframe is computed by adding a constant value (5 in this case) to the respective SMA of RSI. This dynamic adjustment ensures that the threshold reflects changing market conditions.
2. Weighted Signal System:
To enhance the precision of buy and sell signals, the script introduces a weighted signal system. Here's how it works technically:
Signal Weighting:
The script assigns weights to buy and sell signals based on the crossover and crossunder events between RSI and the dynamically adjusted thresholds. If a crossover event occurs, the weight is set to 2; otherwise, it remains at 1.
Signal Combination:
The weighted buy and sell signals from different timeframes are combined using logical operations. A buy signal is generated if the product of weights from all timeframes is equal to 2, indicating alignment across timeframe.
3. Experimental Enhancements:
The Advanced Dynamic Threshold RSI Indicator incorporates experimental features for educational exploration. While not intended as proven strategies, these features aim to offer users a glimpse into unconventional analysis. Some of these features include Performance Calculation, Volatility Calculation, Dynamic Threshold Calculation Using Volatility, Bollinger Bands Module, Weighted Signal System Incorporating New Features.
3.1 Performance Calculation:
The script calculates the percentage change in the price over a specified lookback period (variable lookbackBars). This provides a measure of recent performance.
pctChange(src, length) =>
change = src - src
pctChange = (change / src ) * 100
recentPerformance1H = pctChange(close, lookbackBars)
recentPerformance4H = pctChange(request.security(syminfo.tickerid, "240", close), lookbackBars)
recentPerformance1D = pctChange(request.security(syminfo.tickerid, "1D", close), lookbackBars)
3.2 Volatility Calculation:
The script computes the standard deviation of the closing price to measure volatility.
volatility1H = ta.stdev(close, 20)
volatility4H = ta.stdev(request.security(syminfo.tickerid, "240", close), 20)
volatility1D = ta.stdev(request.security(syminfo.tickerid, "1D", close), 20)
3.3 Dynamic Threshold Calculation Using Volatility:
The dynamic thresholds for RSI are calculated by adding a multiplier of volatility to 50.
dynamicThreshold1H = 50 + thresholdMultiplier * volatility1H
dynamicThreshold4H = 50 + thresholdMultiplier * volatility4H
dynamicThreshold1D = 50 + thresholdMultiplier * volatility1D
3.4 Bollinger Bands Module:
An additional module for Bollinger Bands is introduced, providing an option to enable or disable it.
// Additional Module: Bollinger Bands
bbLength = input(20, title="Bollinger Bands Length")
bbMultiplier = input(2.0, title="Bollinger Bands Multiplier")
upperBand = ta.sma(close, bbLength) + bbMultiplier * ta.stdev(close, bbLength)
lowerBand = ta.sma(close, bbLength) - bbMultiplier * ta.stdev(close, bbLength)
3.5 Weighted Signal System Incorporating New Features:
Buy and sell signals are generated based on the dynamic threshold, recent performance, and Bollinger Bands.
weightedBuySignal = rsi1H > dynamicThreshold1H and rsi4H > dynamicThreshold4H and rsi1D > dynamicThreshold1D and crossOver1H
weightedSellSignal = rsi1H < dynamicThreshold1H and rsi4H < dynamicThreshold4H and rsi1D < dynamicThreshold1D and crossUnder1H
These features collectively aim to provide users with a more comprehensive view of market dynamics by incorporating recent performance and volatility considerations into the RSI analysis. Users can experiment with these features to explore their impact on signal accuracy and overall indicator performance.
Indicator Placement for Enhanced Visibility
Overview
The design choice to position the "Advanced Dynamic Threshold RSI" indicator both on the main chart and beneath it has been carefully considered to address specific challenges related to visibility and scaling, providing users with an improved analytical experience.
Challenges Faced
1. Differing Scaling of RSI Results:
RSI values for different timeframes (1-hour, 4-hour, and 1-day) often exhibit different scales, especially in markets like gold.
Attempting to display these RSIs on the same chart can lead to visibility issues, as the scaling differences may cause certain RSI lines to appear compressed or nearly invisible.
2. Candlestick Visibility vs. RSI Scaling:
Balancing the visibility of candlestick patterns with that of RSI values posed a unique challenge.
A single pane for both candlesticks and RSIs may compromise the clarity of either, particularly when dealing with assets that exhibit distinct volatility patterns.
Design Solution
Placing the buy/sell signals above/below the candles helps to maintain a clear association between the signals and price movements.
By allocating RSIs beneath the main chart, users can better distinguish and analyze the RSI values without interference from candlestick scaling.
Doubling the scaling of the 1-hour RSI (displayed in blue) addresses visibility concerns and ensures that it remains discernible even when compared to the other two RSIs: 4-hour RSI (orange) and 1-day RSI (green).
Bollinger Bands Module is optional, but is turned on as default. When the module is turned on, the users can see the upper Bollinger Band (green) and lower Bollinger Band (red) on the main chart to gain more insight into price actions of the candles.
User Flexibility
This dual-placement approach offers users the flexibility to choose their preferred visualization:
The main chart provides a comprehensive view of buy/sell signals in relation to candlestick patterns.
The area beneath the chart accommodates a detailed examination of RSI values, each in its own timeframe, without compromising visibility.
The chosen design optimizes visibility and usability, addressing the unique challenges posed by differing RSI scales and ensuring users can make informed decisions based on both price action and RSI dynamics.
Usage
Installation
To ensure you receive updates and enhancements seamlessly, follow these steps:
Open the TradingView platform.
Navigate to the "Indicators" tab in the top menu.
Click on "Community Scripts" and search for "Advanced Dynamic Threshold RSI Indicator."
Select the indicator from the search results and click on it to add to your chart.
This ensures that any future updates to the indicator can be easily applied, keeping you up-to-date with the latest features and improvements.
Review Code
Open TradingView and navigate to the Pine Editor.
Copy the provided script.
Paste the script into the Pine Editor.
Click "Add to Chart."
Configuration
The indicator offers several customizable settings:
RSI Length: Defines the length of the RSI calculation.
SMA Length: Sets the length of the SMA applied to the RSI.
Lookback Bars: Determines the number of bars used for recent performance analysis.
Threshold Multiplier: Adjusts the multiplier for dynamic threshold calculation.
Enable Bollinger Bands: Allows users to enable or disable Bollinger Bands integration.
Interpreting Signals
Buy Signal: Generated when RSI values are above dynamic thresholds and a crossover occurs.
Sell Signal: Generated when RSI values are below dynamic thresholds and a crossunder occurs.
Additional Information
The indicator plots scaled RSI lines for 1-hour, 4-hour, and 1-day timeframes.
Users can experiment with additional modules, such as machine-learning simulation, dynamic real-life improvements, or experimental signal filtering, depending on personal preferences.
Conclusion
The Advanced Dynamic Threshold RSI Indicator provides traders with a sophisticated tool for RSI-based analysis, offering a unique combination of dynamic thresholds, performance analysis, and optional Bollinger Bands integration. Traders can customize settings and experiment with additional modules to tailor the indicator to their trading strategy.
Disclaimer: Use of the Advanced Dynamic Threshold RSI Indicator
The Advanced Dynamic Threshold RSI Indicator is provided for educational and experimental purposes only. The indicator is not intended to be used as financial or investment advice. Trading and investing in financial markets involve risk, and past performance is not indicative of future results.
The creator of this indicator is not a financial advisor, and the use of this indicator does not guarantee profitability or specific trading outcomes. Users are encouraged to conduct their own research and analysis and, if necessary, consult with a qualified financial professional before making any investment decisions.
It is important to recognize that all trading involves risk, and users should only trade with capital that they can afford to lose. The Advanced Dynamic Threshold RSI Indicator is an experimental tool that may not be suitable for all individuals, and its effectiveness may vary under different market conditions.
By using this indicator, you acknowledge that you are doing so at your own risk and discretion. The creator of this indicator shall not be held responsible for any financial losses or damages incurred as a result of using the indicator.
Kind regards,
Ely

YD_Divergence_RSI+CMFThe ‘YD_Divergence_RSI+CMF’ indicator can find divergence using RSI (Relative Strength Index) and CMF (Chaikin Money Flow) indicators.
📌 Key functions
1. Search pivot high and pivot low points in a certain length of price.
2. Connect pivot high to pivot high , pivot low to pivot low , forming two standards for divergence in result.
The marker then plots only the higher high, lower low lines.
(higher low and lower high in prices are referred to hidden divergence, which are not considered in this indicator)
3. Compare the two standards with RSI and CMF indicators, send an alert if there is a divergence. As a result, the indicator will find four combination of divergence.
A. Higher high price / Lower RSI (Bearish RSI Divergence)
B. Lower low price / Higher RSI (Bullish RSI Divergence)
C. Higher high price / Lower CMF (Bearish CMF Divergence)
D. Lower low price / Higher CMF (Bullish CMF Divergence)
📌 Details
Developing the indicators, we put a lot of effort in making a customizable and user-friendly interface.
#1. Pivot Setting
Users can set the length to find the pivot high / pivot low in ‘Pivot Settings – Pivot Length.’
Increased pivot Length takes more candles to interpret the chart but reduce false signals since the it uses only the most certain pivot high / pivot low values. Obviously, decreased pivot length will act the opposite.
Users can choose whether to use ‘High/Low’ or ‘Close’ in ‘Pivot Reference’ to set the swing point of prices.
Users can also choose whether to display the pivot high / pivot low marker on the chart.
#2 RSI & CMF Settings
Users can adjust the length of RSI & CMF separately. (The default values are set to 14 and 20 each.)
#3 Label Setting
Users can adjust the text displayed on the chart label. (The default values is set to ‘Bullish / Bearish’, ‘RSI/CMF’, ‘Divergence’.)
Users can reduce the length of text label or simply turn the label off. Just click the ‘Bull/Bear’ or ‘None’ button. ‘Divergence’ works the same.
Users can decide whether to display the ‘Divergence Line and Label’, set custom settings for the label and line. (color, thickness, style, etc)
📌 Alert
Alert are provided as a combination of the chart's symbol and the set label text. For example,
‘BINANCE:BTCUSDT.P, Bullish RSI Divergence’
====================================================
"YD_Divergence_RSI+CMF" 지표 는 RSI와 CMF 지표를 이용해서 Divergence 를 찾아낼 수 있습니다.
📌 주요 기능
1. 정해진 가격 움직임 안에서 pivot high와 pivot low 포인트 를 찾아냅니다.
2. Pivot high로만 이어진 라인과, Pivot low로만 이어진 두 라인을 작도한 뒤 divergence의 기준으로 삼습니다.
이 지표에서는 normal divergence만 사용하기 때문에 차트에 higher high와 lower low만 표기 합니다.
(higher low와 lower high는 hidden divergence로 정의되며, 이 지표에서는 다루지 않습니다.
3. 두 기준선과 RSI, CMF 지표를 각각 비교하고, 결과적으로 4개의 조합을 구할 수 있습니다.
A. Higher high price / Lower RSI (Bearish RSI Divergence)
B. Lower low price / Higher RSI (Bullish RSI Divergence)
C. Higher high price / Lower CMF (Bearish CMF Divergence)
D. Lower low price / Higher CMF (Bullish CMF Divergence)
📌 세부 사항
지표를 개발하며 사용자들이 원하는 방향으로 지표를 설정할 수 있게 작업에 많은 공을 들였습니다. 굉장히 다양한 옵션을 선택할 수 있으며, 원하는 방식으로 지표를 사용할 수 있습니다.
#1 Pivot Setting
Pivot setting에서는 Pivot Length를 변경할 수 있습니다.
Pivot Length를 늘릴 경우, 보다 확실한 Swing High와 Swing Low만을 사용하게 되므로, False signal이 줄어들 수 있습니다. 하지만 Swing High/ Low를 판정하는 데에 더 긴 시간이 걸리게 되므로, Signal이 다소 늦게 발생하는 단점이 생기게 됩니다.
Pivot Length를 줄일 경우, 반대로 Swing High/Low의 판정이 더 빨리 일어나기 때문에, Signal을 거래에 이용하기는 좋을 수 있습니다. 다만, Swing High와 Low가 훨씬 더 잦은 빈도로 발생하기 때문에 False Signal을 줄 가능성이 높아집니다.
Pivot Reference에서는 가격의 Swing Point를 설정함에 있어, High/Low(고가/저가)를 이용할 지 Close (종가)를 이용할 지 선택할 수 있습니다.
Pivot High/Low Marker를 선택할 경우 Pivot High/ Low에 Marker가 찍히게 됩니다.
#2 RSI와 CMF Setting
RSI와 CMF Setting에서는 RSI와 CMF의 길이를 각각 설정할 수 있습니다. 기본값은 14와 20으로 설정되어 있습니다.
#3 Label Setting
Label Setting에서는 Label에 표시되는 글자를 선택할 수 있습니다.
기본값은 "Bullish / Bearish", "RSI/CMF", "Divergence"로 선택되어 있으며, 너무 길다고 느껴질 경우 "Bull/Bear" 혹은 "None"을 클릭하여 길이를 줄일 수 있습니다. 마찬가지로 Divergence의 경우도 생략이 가능합니다.
하단에서는 Divergence Line과 Label을 켜고 끌 수 있으며, 선의 색깔, 굵기, 종류, 그리고 Label의 색깔, 크기, 종류를 선택할 수 있습니다. Label의 Text 색 역시 변경이 가능합니다.
📌 얼러트
얼러트는 자신이 설정한 차트의 심볼과 Label의 문구의 조합으로 제공되며 예를 들면 다음과 같습니다.
"BINANCE:BTCUSDT.P, Bullish RSI Divergence"

Multi Time Frame RSI PanelDescription:
The "Multi Time Frame RSI Panel" indicator is a powerful tool designed to help traders analyze the Relative Strength Index (RSI) across multiple timeframes simultaneously. While the core logic of this indicator is proprietary, this description aims to provide traders with an understanding of its functionality and utility.
Key Features:
Multi-Timeframe Analysis: This indicator displays RSI values for different timeframes, including 1 minute (1m), 5 minutes (5m), 15 minutes (15m), 30 minutes (30m), 1 hour (1h), 2 hours (2h), 4 hours (4h), and 1 day (1d). Traders can choose which timeframes to display on their chart based on their trading strategy.
Customizable Thresholds: Users can set upper and lower RSI thresholds for each timeframe, allowing for the identification of overbought and oversold conditions. The indicator highlights RSI values that breach these thresholds in green (for overbought) or red (for oversold), providing visual cues for potential trading opportunities.
How to Use:
1. Add the "Multi Time Frame RSI Panel" indicator to your TradingView chart.
2. Configure the settings by selecting the timeframes you want to monitor and setting your preferred RSI thresholds.
3. Monitor the RSI values for each selected timeframe in the panel located at the top right corner of your chart.
4. Look for potential trading signals based on RSI conditions, such as overbought or oversold levels, across different timeframes.

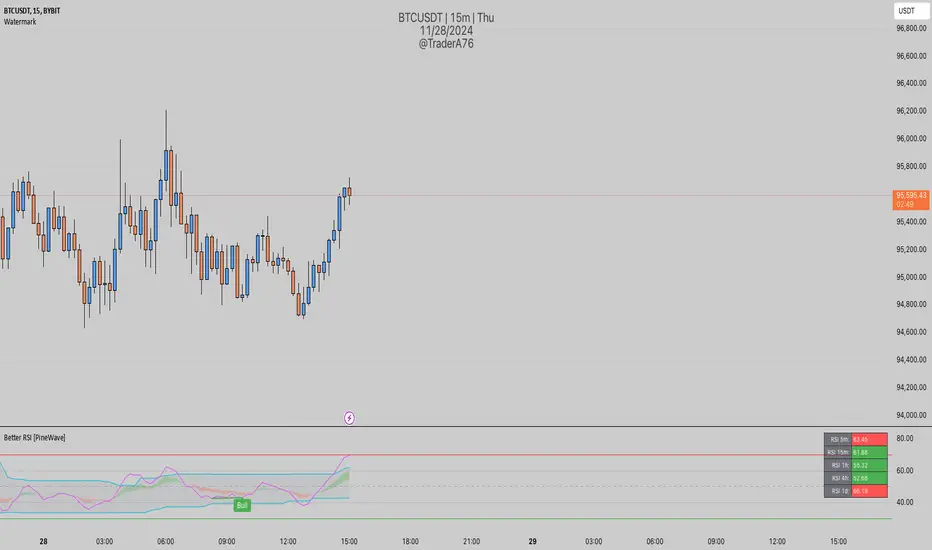
Better RSIThis script is an enhancement of the original RSI (Relative Strength Index) indicator for TradingView. While the core RSI functionality remains intact, several powerful features have been added to make it a "Better RSI" tool for traders and investors.
Key Features:
1. Divergence Detection: The script now includes both Bullish and Hidden Divergence detection. Bullish Divergence helps identify potential trend reversals when the price makes lower lows, but the RSI makes higher lows. Conversely, Hidden Divergence highlights instances where the RSI and price move in opposite directions, signaling potential trend continuation or reversal.
2. Bollinger Band Breakout Highlight: Users have the option to select "Bollinger Bands" as the Moving Average (MA) type in the settings. When enabled, this feature highlights RSI-Bollinger Band breakouts. It's a valuable tool for traders looking to capitalize on RSI movements in conjunction with Bollinger Bands.
3. Customizable Settings: The script provides a range of customizable settings, allowing you to adjust parameters like RSI length, MA type, Bollinger Bands standard deviation, and more to suit your trading strategy.
4. Clear Visuals: The script offers clear visual cues, with colored backgrounds indicating RSI overbought and oversold levels, as well as extreme breakouts. Bullish and bearish divergence points are also marked with distinct crosses, making it easy to spot potential trading opportunities.
Whether you're a seasoned trader or just starting, the "Better RSI" script empowers you with advanced tools to make more informed trading decisions. Use it to identify potential trend reversals, continuation patterns, and RSI-Bollinger Band breakouts in the market.
RMI Trend SniperThe "RMI Trend Sniper" is a powerful trend-following indicator designed to help traders identify potential buy and sell signals in the market.
It combines elements of the Relative Strength Index (RSI) and the Money Flow Index (MFI) to provide a comprehensive view of market momentum and strength.
🔷 Key Features:
🔹 Customizable Settings : Tailor the indicator to your trading preferences with customizable input parameters, including RSI and MFI lengths, threshold levels, and visual settings.
🔹 Momentum Signals : The indicator generates clear bullish and bearish momentum signals, allowing you to spot potential trend reversals or continuations.
🔹 The positive condition considers the previous RMI value, current RMI value, and positive change in the 5-period exponential moving average (EMA) of the closing price.
🔹 The negative condition looks at the current RMI value and negative change in the 5-period EMA.
🔹 Visual Bands : Visualize market volatility with dynamically plotted bands around the Range Weighted Moving Average (RWMA), providing insights into potential price fluctuations.
🔹 Candlestick Coloring : Easily identify bullish and bearish conditions with color-coded candlesticks, helping you make informed trading decisions.
The "RMI Trend Sniper" is a versatile tool suitable for traders of all experience levels. Whether you are a novice or an experienced trader, this indicator can help you enhance your technical analysis and improve your trading strategies.

SMA/EMA/RSImagic 36.963 by IgorPlahutaTwo Elements in this script:
Alerts: These are notifications that draw your attention to specific market conditions. There are two types:
RSI Higher Lows or Lower Highs: This alert triggers when the Relative Strength Index (RSI) forms higher lows or lower highs.
RSI Exiting 30 (Up) or RSI Exiting 70 (Down): These alerts activate when the RSI crosses the 30 threshold upwards or the 70 threshold downwards.
ALL BUY/SELL: to catch both of them with one setting
To Set Up an Alert: To configure an alert, select the one relevant to your trading strategy, choose the "Greater than" option, and input a value of "0" (this essentially activates the alert). Adjust other settings as per your requirements.
Please note that these alerts should be used in conjunction with a system you trust for confirmation.
Moving Averages: This involves monitoring several moving averages:
SMA12, SMA20, EMA12, EMA20: These moving averages are highlighted with background colors to help you quickly identify changes or crossovers. They are superimposed on each other for easy comparison.
SMA 50, SMA200: These moving averages are also highlighted with background colors to spot crossovers, and their lines change color depending on their direction (falling in red or rising in green).
Enjoy using these tools in your trading endeavors!

CCI RSI Trading SignalThe "CCI RSI Trading Signal" indicator combines the Commodity Channel Index (CCI) and Relative Strength Index (RSI) to provide buy and sell signals for trading. The CCI identifies potential trend reversals, while the RSI helps confirm overbought and oversold conditions.
How It Works:
The indicator generates a buy signal when the CCI crosses above -100 (indicating a potential bullish reversal) and the RSI is below the specified oversold level. On the other hand, a sell signal is produced when the CCI crosses below 100 (indicating a potential bearish reversal) and the RSI is above the specified overbought level.
Customization:
Traders can adjust the RSI and CCI periods, RSI oversold and overbought levels, as well as take profit, stop loss, and lot size settings to suit their trading preferences.
Usage:
The "CCI RSI Trading Signal" indicator can be used on various timeframes and markets to aid in decision-making, providing potential entry and exit points based on the combined analysis of CCI and RSI.
Pro RSI CalculatorThe "Pro RSI Calculator" indicator is the latest addition to a series of custom trading tools that includes the "Pro Supertrend Calculator" and the "Pro Momentum Calculator."
Building upon this series, the "Pro RSI Calculator" is designed to provide traders with further insights into market trends by leveraging the Relative Strength Index (RSI) indicator.
Its primary objective remains consistent: to analyze historical price data and make informed predictions about future price movements, with a specific focus on identifying potential bullish (green) or bearish (red) candlestick patterns.
1. RSI Calculation:
The indicator begins by computing the RSI, a widely used momentum oscillator. It calculates two crucial RSI parameters:
RSI Length: This parameter determines the lookback period for RSI calculations.
RSI Upper and Lower Bands: These thresholds define overbought and oversold conditions, typically set at 70 and 30, respectively.
2. RSI Bands Visualization:
The RSI values obtained from the calculation are skillfully plotted on the price chart, appearing as two distinct lines:
Red Line: Represents the RSI when indicating a bearish trend, anticipating potential price declines.
Teal Line: Represents the RSI in bullish market conditions, signaling the possibility of price increases.
3. Consecutive Candlestick Analysis:
The indicator's core functionality revolves around tracking consecutive candlestick patterns based on their relationship with the RSI lines.
To be included in the analysis, a candlestick must consistently close either above (green candles) or below (red candles) the RSI lines for multiple consecutive periods.
4. Labeling and Enumeration:
To communicate the count of consecutive candles displaying consistent trend behavior, the indicator meticulously assigns labels to the price chart.
Label positioning varies depending on the trend's direction, appearing either below (for bullish patterns) or above (for bearish patterns) the candlesticks.
The color scheme aligns with the candle colors: green labels for bullish candles and red labels for bearish ones.
5. Tabular Data Presentation:
The indicator enhances its graphical analysis with a customizable table that prominently displays comprehensive statistical insights.
Key data points in the table include:
- Consecutive Candles: The count of consecutive candles displaying consistent trend characteristics.
- Candles Above Upper RSI: The number of candles closing above the upper RSI threshold during the consecutive period.
- Candles Below Lower RSI: The number of candles closing below the lower RSI threshold during the consecutive period.
- Upcoming Green Candle: An estimated probability of the next candlestick being bullish, derived from historical data.
- Upcoming Red Candle: An estimated probability of the next candlestick being bearish, also based on historical data.
6. Custom Configuration:
To cater to various trading strategies and preferences, the indicator offers extensive customization options.
Traders can fine-tune parameters like RSI length, upper, and lower bands, label and table placement, and table size to align with their unique trading approaches.

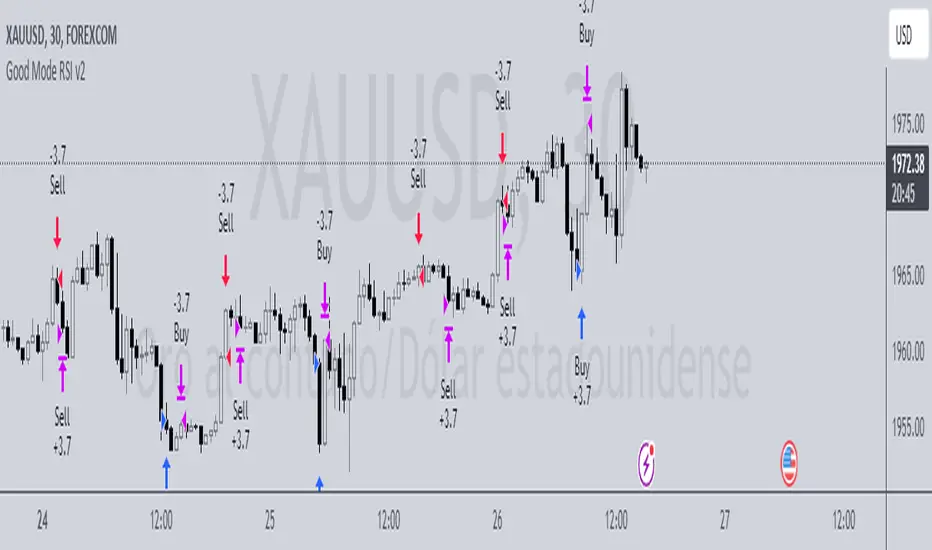
Good Mode RSI v2► Description:
"Good Mode RSI v2" is a powerful trading strategy designed to provide informed trading decisions. This script utilizes the popular RSI (Relative Strength Index) indicator to identify potential buying and selling opportunities in the market. It goes beyond the traditional use of RSI by incorporating carefully selected parameters to enhance its effectiveness. The strategy stands out for its customized combination of RSI levels and stop-loss/take-profit thresholds, allowing for precise trade entries and exits while effectively managing risk.
► How to Use:
To utilize the "Good Mode RSI v2" strategy, follow these steps:
1. Apply the script to your desired trading instrument and timeframe in TradingView.
2. Monitor the chart for trade signals generated by the strategy.
3. When the RSI reaches the sell level of 96, a sell signal is generated. Consider placing a sell order to take advantage of potential downward price movements.
4. take-profit level at 60 to secure profits in a strong downtrend.
5. When the RSI drops below the buy level of 4, a buy signal is generated. Consider placing a buy order to enter the market at a favorable price.
6. take-profit level at 30 to secure profits in a strong uptrend.
7. Monitor the RSI indicator on the chart to stay updated on its current value and anticipate potential trade signals.
Please note that trading decisions should be made based on a comprehensive analysis of multiple factors, including market conditions, trend analysis, and risk management. The "Good Mode RSI v2" strategy can serve as a valuable tool in your trading journey, but it should be used in conjunction with your own research and analysis.
► About it:
The "Good Mode RSI v2" strategy is not a mere replication or slight modification of existing strategies or indicators. It has been carefully crafted to provide traders with an original and purposeful approach to trading using the RSI indicator. The strategy's unique configuration of RSI levels and stop-loss/take-profit thresholds allows for improved performance and profitability. Backtesting results have shown impressive metrics, including a gain factor of 2.445 and a compelling profitability of 78.07% during the testing period.
► Referrals:
If you have any questions or need further assistance with the "Good Mode RSI v2" strategy, feel free to ask. Good luck with your trading endeavors!
RSI Xray + VolumeRSI Analysis:
The indicator calculates the Relative Strength Index (RSI) using a user-defined length (default: 14).
It colors the bars based on RSI levels to identify potential overbought and oversold conditions.
Bars exceeding the overbought level (default: 70) are colored, while bars below the oversold level (default: 30) are colored too.
This helps traders identify potential trend reversals or market exhaustion points.
Midpoint Analysis:
The indicator calculates the midpoint of each bar, which is the average of the high and low prices.
It colors the bars based on their relation to the midpoint.
Bars above the midpoint are colored, indicating potential bullish momentum.
Bars below the midpoint are colored, suggesting potential bearish momentum.
Volume Analysis:
The indicator offers the ability to analyze volume changes and identify high volume bars.
It colors the bars when the volume exceeds a user-defined threshold.
This feature helps traders identify potential areas of market interest and increased participation.
Moving Average (SMA):
The indicator plots a Simple Moving Average (SMA) line of the closing price over a user-defined period (default: 9).
This moving average line helps traders identify potential trends and spot areas of support or resistance.
RSI Extreme Conditions:
The indicator identifies extreme RSI conditions by comparing the current RSI value with the highest and lowest RSI values calculated from a user-defined number of previous bars (default: 10).
When the RSI exceeds the overbought level but is lower than the highest RSI value within the specified range, the bar color changes to a customizable color (default: blue).
Conversely, when the RSI falls below the oversold level but is higher than the lowest RSI value within the specified range, the bar color changes to the same customizable color.
This feature helps traders identify potential RSI-based trading opportunities and market turning points.
Customization:
The indicator offers customizable settings for colors, RSI levels, SMA length, volume thresholds, RSI extreme levels, and RSI label color.
Traders can modify these settings based on their preferences and trading strategies.
Overall, the 'RSI Xray + Volume' indicator provides a comprehensive view of RSI levels, market momentum, volume changes, and RSI extreme conditions. Traders can use this information to identify potential trade setups, validate market trends, and make more informed trading decisions. It can be applied to various timeframes and instruments, making it a valuable tool for both short-term and long-term traders.
RSI with J-Line ***For ease of use, I recommend changing the J Histogram to a line indicator, then it works like the KDJ Stochastic indicator. Full disclosure, I created this script with the help of GPT. This script was inspired by the KDJ Stochastic indicator by Dreadblitz***
The "RSI with J-Line" script is essentially a modified Relative Strength Index (RSI) indicator with an added histogram component. Here's how to use the different components of the script:
RSI Line (Blue): The RSI is a momentum oscillator that measures the speed and change of price movements. It oscillates between zero and 100, and is typically used to identify overbought and oversold conditions in a market. Traditionally, readings over 70 are considered overbought, and readings under 30 are considered oversold. However, these are not strict rules and can vary depending on the market and the overall trend.
RSI Smooth Line (Orange): This is the simple moving average of the RSI. It helps to smooth out the RSI and to identify the overall trend of the momentum. When the RSI line crosses above the RSI Smooth line, it might indicate that the momentum is moving upwards. When the RSI line crosses below the RSI Smooth line, it might indicate that the momentum is moving downwards.
RSI J-Line (Red Histogram): The J-Line is an additional line that's calculated as 3*rsiSmooth - 2*rsi. It's similar to the %J line in the Stochastic indicator and is designed to provide quicker signals than the RSI or RSI Smooth line. When the histogram is above the 0 line, it might indicate bullish momentum. When it's below the 0 line, it might indicate bearish momentum.
Please note that these interpretations are standard for these types of indicators, but actual market behavior can be complex and is influenced by many factors. Indicators should be used as part of a comprehensive trading strategy, not in isolation. Always take into account other market information and indicators before making trading decisions.

Divergence Screener [Mr_Zed]Divergence Screener
This script allows you to scan multiple assets and timeframes for bullish and bearish divergences based on the RSI (Relative Strength Index) indicator.
Features
Supports up to 40 different assets and timeframes for simultaneous scanning.
Customizable settings for RSI period and source.
Adjustable lookback periods for identifying pivot highs and pivot lows.
Flexible range limits for filtering divergences based on the number of bars since the last pivot point.
Alerts for bullish and bearish divergences on confirmed bars.

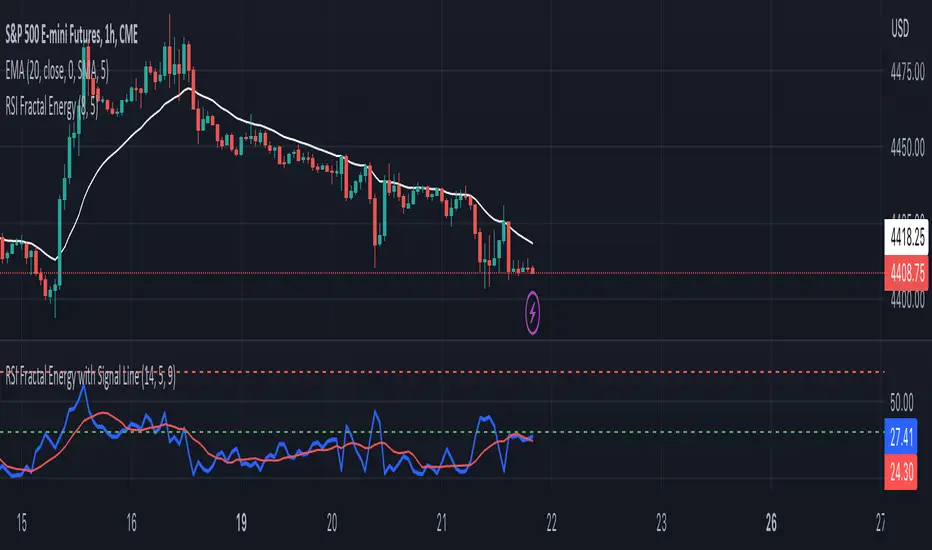
RSI Fractal Energy with Signal LineHere is my second script.
Introducing the RSI Fractal Energy Indicator.
This incorporates the Relative-Strength Index and Fractal Energy as the name implies.
This will help the trader identify:
1. Trend Strength: The higher the value of the indicator can indicate the strength of the trend and vice versa.
2. Reversal points: If the indicator is showing weakness and the market is making higher highs and lower lows this can indicate a reversal is possible.
3. Overbought and Oversold conditions: This indicator is currently set to 30(Oversold) and 70(Overbought), but this can be changed in the source code.
I also added a signal line to provide bullish/bearish crossovers.
I use this indicator on the 1 hr chart, but it can be used on any time frame.
Please let me know if you have any questions, comments, or concerns. Always open to learning more.
I will also provide updates as I continue to use my indicators.
Happy trading!
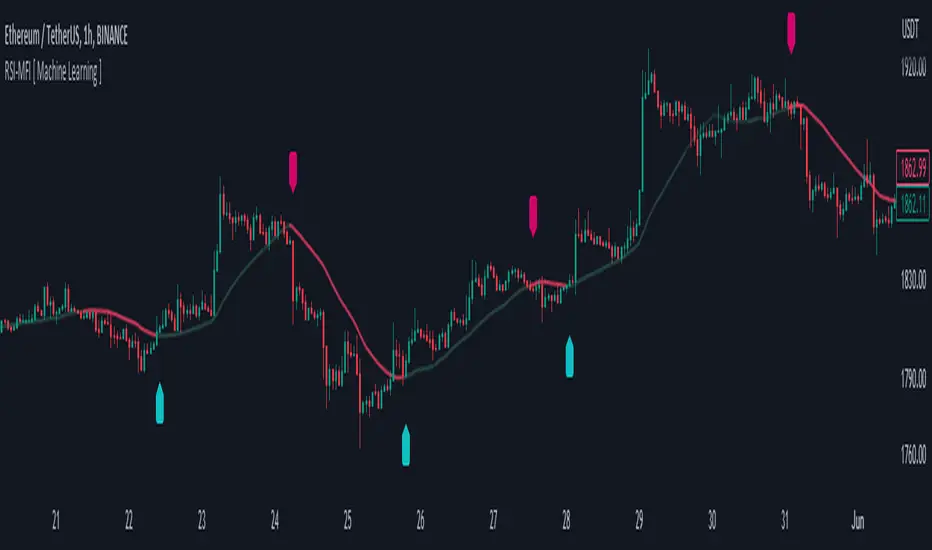
RSI-MFI Machine Learning [ Manhattan distance ]The RSI-MFI Machine Learning Indicator is a technical analysis tool that combines the Relative Strength Index (RSI) and Money Flow Index (MFI) indicators with the Manhattan distance metric.
It aims to provide insights into potential trade setups by leveraging machine learning principles and calculating distances between current and historical data points.
The indicator starts by calculating the RSI and MFI values based on the specified periods for each indicator.
The RSI measures the strength and speed of price movements, while the MFI evaluates the inflow and outflow of money in the market.
By combining these two indicators, the indicator captures both price momentum and money flow dynamics.
To apply machine learning principles , the indicator utilizes the Manhattan distance metric to quantify the similarity or dissimilarity between different data points.
The Manhattan distance is calculated by taking the absolute differences between corresponding RSI and MFI values of the current point and historical points.
Next, the indicator determines the nearest neighbors based on the calculated Manhattan distances.
The number of nearest neighbors is determined by the square root of the specified count of neighbors.
By identifying similar patterns and behaviors in the historical data, the indicator aims to uncover potential trade opportunities.
Trade signals are generated based on the calculated distances. The indicator compares each distance with the maximum distance encountered so far.
If a new maximum distance is found, it updates the value and considers the corresponding direction as a potential trade signal. The trade signals are stored in an array for further analysis.
Furthermore, the indicator considers the price action and a calculated regression line to differentiate between long and short trade signals.
Long trade signals are identified when the closing price is above the regression line, indicating a potentially bullish setup.
Short trade signals are identified when the closing price is below the regression line, indicating a potentially bearish setup.
The RSI-MFI Machine Learning Indicator visualizes the regression line on the price chart and labels the bars accordingly. It highlights the regression line with different colors based on the trade signals, making it easier for traders to identify potential entry or exit points.
Traders can use the RSI-MFI Machine Learning Indicator as a tool to analyze price movements, evaluate market conditions based on RSI and MFI, leverage machine learning concepts to find similar patterns, and make informed trading decisions.
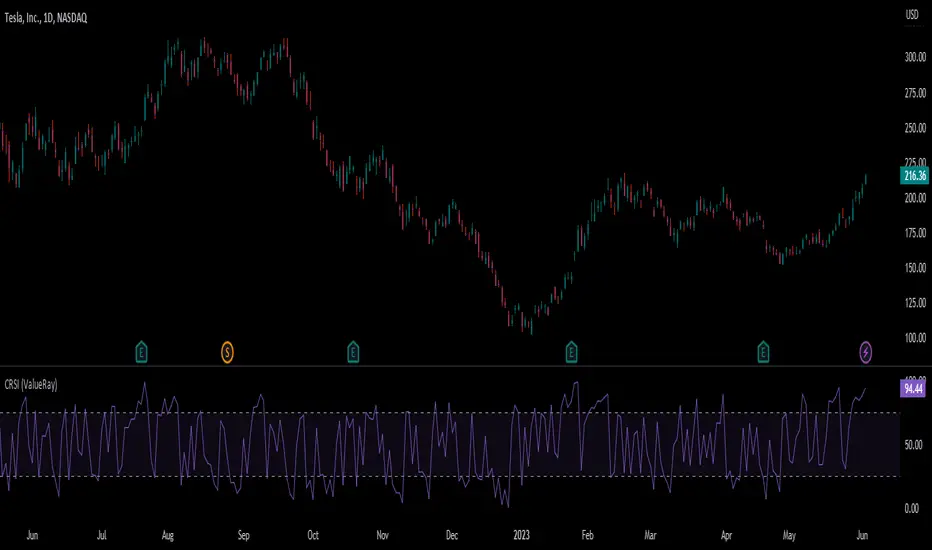
Connors RSI (ValueRay)In compare to Tradingview Connors RSI, in this one you can choose which of the parts of the CRSI you want see:
RSI
Connors RSI
Up/Down RSI
Percent Rank
The Connors RSI is a technical indicator developed by Larry Connors. It combines three different elements - price momentum, relative strength, and mean reversion - to identify potential buy and sell signals. The indicator measures the level of overbought or oversold conditions in a security, aiming to generate signals for short-term trading opportunities. It is widely used by traders to assess the strength and direction of price movements and to identify potential entry and exit points in the market.