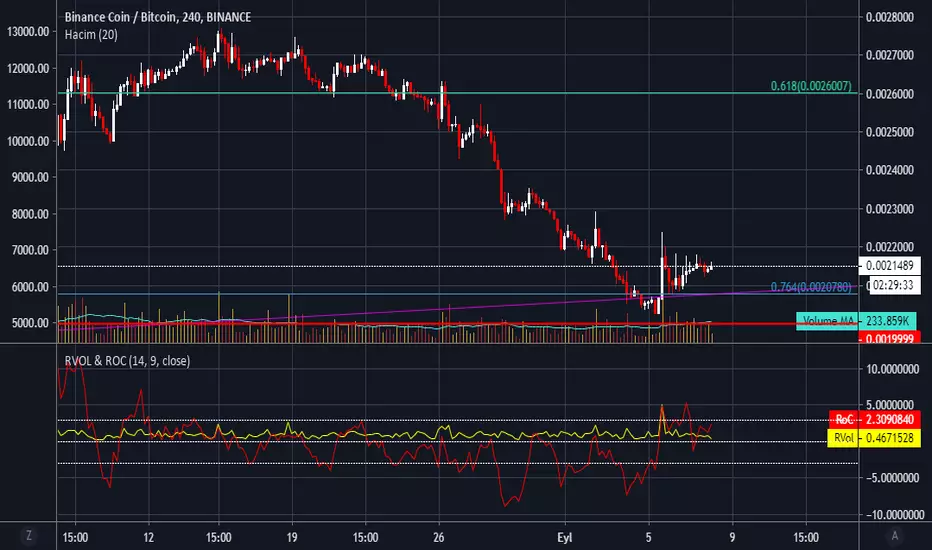
RVol & RoC - Relative Volume & Rate of Change by haciyatmazRelative Volume ( RVol ) is a critical measure of volume flows. It measures current volume in relation to the "usual" volume for this time of the day.
Rate of Change ( RoC ) is a momentum-based technical indicator that measures the percentage change in price between the current price and the price a certain number of periods ago.
在腳本中搜尋"Relative"
Relative Distance to Moving AverageThis indicator calculates the Relative Distance to a Moving Average (RDMA), a momentum oscillator that measures how overextended a price is from its moving average baseline. It expresses this distance as a percentage, oscillating around a zero line. High positive values may indicate overbought conditions, while large negative values may suggest oversold conditions.
Key Features:
Customizable MA Baseline: The oscillator's baseline is a moving average. Users can select from a wide range of MA types (e.g., EMA, SMA, WMA) and apply volume weighting (Volume weighted) for enhanced responsiveness.
Normalization (Geometric Average): Includes an optional 'Normalize' mode. When enabled, the indicator uses a Geometric Moving Average (GMA) as its baseline and measures the percentage distance from this compound growth average, making it suitable for exponential markets.
Full Divergence Suite (Class A, B, C): The indicator's primary feature is its integrated divergence engine. It automatically detects and plots all three major divergence classes between price and the RDMA:
Regular (A): Signals potential trend exhaustion and reversals.
Hidden (B): Signals potential trend continuations during pullbacks.
Exaggerated (C): Signals weakness at double tops/bottoms.
Divergence Filtering and Visualization:
Price Tolerance Filter: Divergence detection is enhanced with a percentage-based price tolerance (pivPrcTol) to filter out insignificant market noise.
Persistent Visualization: Divergence markers are plotted for the entire duration of the signal and are visually anchored to the RDMA level of the confirming pivot.
Note on Confirmation (Lag): Divergence signals rely on a pivot confirmation method to ensure they do not repaint.
The Start of a- divergence is only detected after the confirming pivot is fully formed (a delay based on Pivot Right Bars).
The End of a divergence is detected either instantly (if the signal is invalidated by price action) or with a delay (when a new, non-divergent pivot is confirmed).
Multi-Timeframe (MTF) Capability:
MTF RDMA Line: The RDMA oscillator itself can be calculated on a higher timeframe, with standard options to handle gaps (Fill Gaps) and prevent repainting (Wait for...).
Limitation: The Divergence detection engine (pivDiv) is disabled if a timeframe other than the chart's timeframe is selected. Divergences are only calculated on the active chart timeframe.
Integrated Alerts: Includes 14 comprehensive alerts for:
The start and end of all 6 divergence types.
The RDMA oscillator crossing the zero line.
DISCLAIMER
For Informational/Educational Use Only: This indicator is provided for informational and educational purposes only. It does not constitute financial, investment, or trading advice, nor is it a recommendation to buy or sell any asset.
Use at Your Own Risk: All trading decisions you make based on the information or signals generated by this indicator are made solely at your own risk.
No Guarantee of Performance: Past performance is not an indicator of future results. The author makes no guarantee regarding the accuracy of the signals or future profitability.
No Liability: The author shall not be held liable for any financial losses or damages incurred directly or indirectly from the use of this indicator.
Signals Are Not Recommendations: The alerts and visual signals (e.g., crossovers) generated by this tool are not direct recommendations to buy or sell. They are technical observations for your own analysis and consideration.

Relative Strength Trend Indicator (RSTI)This indicator is called the "Relative Strength Trend Indicator" (RSTI), designed to assess the relative strength of a trend.
Here is a detailed explanation of how it works and how traders can interpret it:
Indicator Operation:
1. Data Source (src): The indicator considers a data source, typically the closing price (close), but this can be adjusted according to the trader's preferences.
2. Period Length (Length): This determines the period used to calculate the simple moving average (SMA) of the data source. A longer period smoothes the indicator, while a shorter period makes it more responsive.
3. Multiplier (Multiplier): This is a multiplication factor applied to the Average True Range (ATR), adjusting the width of the bands.
4. Signal Length (Signal Length): This period is used to calculate the simple moving average of the relative strength (l_strength). It determines the sensitivity of the signal to changes in relative strength.
Interpretation of the Indicator:
1. Upper Strength Band (Upper Level): This line is drawn at 80 and represents a high strength level. When relative strength exceeds this value, it may indicate a potential overbought market.
2. Lower Strength Band (Lower Level): This line is drawn at 20 and represents a low strength level. When relative strength is below this value, it may indicate a potential oversold market.
3. RSTI Strength: The main line of the indicator, representing the calculated relative strength. When this line exceeds 50, it may indicate an uptrend, while a value below 50 may indicate a downtrend.
4. Filling Zones: These colored zones between levels 80 and 50, and between 50 and 20, can help quickly visualize relative strength. A colored zone above 50 indicates positive strength, while a colored zone below 50 indicates negative strength.
Qualities of the Indicator:
1. Adaptability: The use of ATR and the flexibility of parameters (length, multiplier, signal_length) allow the indicator to adapt to different market conditions.
2. Visual Clarity: Colored filling zones and horizontal lines make it easy to visualize relative strength levels.
3. Strength Signal: The signal line (RSTI Strength) allows traders to quickly spot changes in relative strength, facilitating decision-making.
4. Responsiveness: The combination of smoothed moving averages and relative strength indicators allows responsiveness to trend changes while reducing false signals.
It is essential to note that while this indicator can provide valuable insights, it is always recommended to use it in conjunction with other technical analysis tools for informed decision-making.

Relative Performance TableThis indicator is based on the Performance section in the TradingView's sidebar and uses new Pine tables functionality, originally coded by @Beeholder. It compares the current price of the symbol to its past price and calculates the rate of return to make it easier to track the performance of the symbol. Note that the Performance sidebar is not updated in real-time, while this indicator is, so on real-time charts the values between the two can differ (the indicator's values are more recent). Made a number of enhancement from Bee's script including relative performance of a selected ticker, dynamic table columns, and other options.
The formula of the calculation is (Current value - Past value) * 100 / Past value, where Past value is:
1W
1M
3M
6M
9M
52W (1 Year)
WTD (Week to Date)
MTD (Month to Date)
YTD (Year to Date
--Future development will include the ability to transpose the table columns/rows
Comparative Relative Strength(CRS), ARS,SRS,Beta,RocShows comparative relative strength(CRS) against any benchmark script , if CRS is above ARS line than ARS is Positive and if CRS turns green than SRS is positive and vice versa.

Relative Vigor IndexHere we are looking at a trend strength indicator based on the Relative Vigor Index(RVI). The RVI measures trend strength by comparing the open-close and high-low ranges for the current and three most recent periods. As a zero-centered oscillator, the RVI oscillates above and below zero to signal the strength of the trend.
As there are different ways to interpret the RVI, we have included 3 different modes for traders to choose from in the input option menu:
1. Zero-Crossing:
The RVI Histogram will turn green when it crosses above zero and red when it crosses below. Therefore, a green RVI means the trend is bullish and red means bearish. This mode is better for longer-term swing trading in comparison to the other 2 modes.
2. Increasing / Decreasing:
The RVI histogram will turn green when it is increasing(rvi >= rvi ) and red when it is decreasing. A green RVI is viewed as a bullish signal and red means bearish. This mode is a good middle-ground between the Zero-Crossing and Signal Comparison modes.
3. Signal Comparison:
Here, the RVI is compared to its signal line. If the RVI is greater than its signal line, the histogram is green, indicating a bullish trend, while red means bearish. This mode is preferred for scalping.
Hope everyone finds this one useful!
You can check out our other invite only studies/strategies at our website: profitprogrammers.com

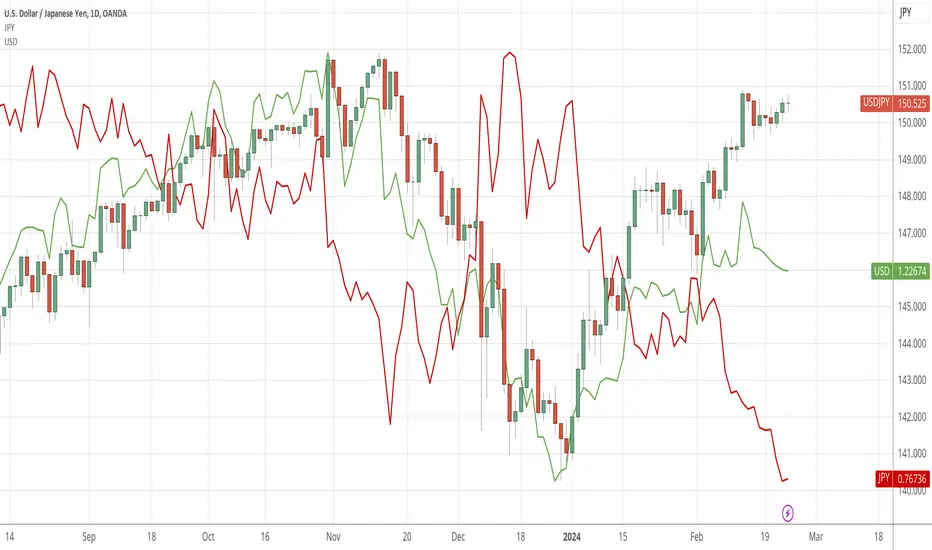
USD Relative Strength Comparison (RSC)Simple indicator implementing relative strength against the equally weighted basket of major currencies. Perhaps I will coin it the Equally Weighted Index (EWI) and trademark it like ICE did with DXY.
usd = (usdjpy/100 + usdcad + 1/gbpusd + 1/eurusd + usdchf + 1/audusd + 1/nzdusd)/7
DXY is hard to compare against other indices because of it's weightening. Secondly it does not compare against all majors and includes SEK which is not a major currency. Source: Wikipedia .
In this chart it becomes more clear why GU is in an uptrend. From April 25th USD has been consolidating against the basket of majors while GBP has gained in strength against the same basket.
gbp = (gbpusd + gbpjpy/100 + gbpcad + 1/eurgbp + gbpchf + gbpaud + gbpnzd)/7
Relative Body Indicator by VtsRBI:
The EMA of the relative body (RB) of Japanese candles is evaluated.
The RB of a candle (my definition) is simply the ratio of the body with respect to its full length
and taken positive for bull candles and negative for bear candles:
e.g. a bull "marubozo" has RB=1 a bear "marubozo" has RB=-1;
a "doji" has RB=0.
This simple indicator grasps the essence of the market by filtering out a great deal of noise.
A flag can be selected to calculate its very basic binary version, where a bull candle counts as a one
and a bear candle counts as a minus one.
Enter (or exit) the market when the signal line crosses the base line.
When the market is choppy we have a kind of alternating bear and bull candles so that
RBI is FLAT and usually close to zero.
Therefore avoid entering the market when RBI is FLAT and INSIDE the Exclusion level.
The exclusion level is to be set by hand: go back in history and check when market was choppy; a good
way to set it is to frame the oscillations of RBI whe price was choppy.
RBI is more effective when an EMA of price is used as filtering. I found EMA(13) to be
a decent filter: go long when base crosses signal upwards AND closing price is above EMA(13);
same concept for going short.
As any other indicator, use it with responsibility: THERE CAN'T BE A SINGLE MAGIC INDICATOR winning
all trades.
Above all, have fun.
Vitelot/Yanez/Vts March 31, 2019
Note: I'm not aware of any indicator like this. My apologies to whoever had this idea before me.

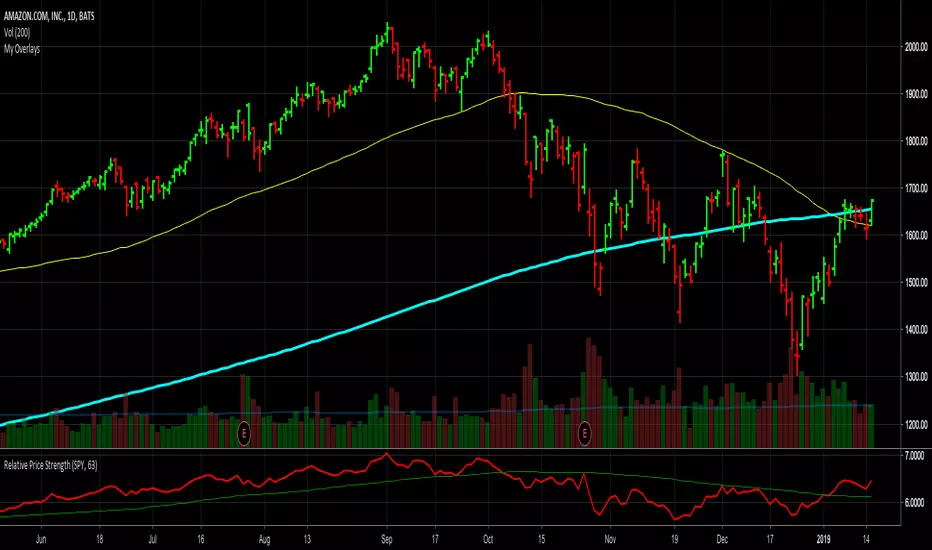
Relative Price StrengthThe strength of a stock relative to the S&P 500 is key part of most traders decision making process. Hence the default reference security is SPY, the most commonly trades S&P 500 ETF.
Most profitable traders buy stocks that are showing persistence intermediate strength verses the S&P as this has been shown to work. Hence the default period is 63 days or 3 months.
IBD Relative strengtHThis code is to replicate the relative strength indicator as used on investors.com (on lists like the IBD 50, big cap 20 etc).
Let me know if any issues / any updates wanted.

Reverse Cutlers Relative Strength IndexIntroduction
The Reverse Cutlers Relative Strength Index (RCRSI) is an indicator which tells the user what price is required to give a particular Cutlers Relative Strength Index (RSI) value, or cross its Moving Average (MA) signal line.
Overview
Background & Credits:
The relative strength index (RSI) is a momentum indicator used in technical analysis that was originally developed by J. Welles Wilder Jr. and introduced in his seminal 1978 book, “New Concepts in Technical Trading Systems.”.
Cutler created a variation of the RSI known as “Cutlers RSI” using a different formulation to avoid an inherent accuracy problem which arises when using Wilders method of smoothing.
Further developments in the use, and more nuanced interpretations of the RSI have been developed by Cardwell, and also by well-known chartered market technician, Constance Brown C.M.T., in her acclaimed book "Technical Analysis for the Trading Professional” 1999 where she described the idea of bull and bear market ranges for RSI, and while she did not actually reveal the formulas, she introduced the concept of “reverse engineering” the RSI to give price level outputs.
Renowned financial software developer, co-author of academic books on finance, and scientific fellow to the Department of Finance and Insurance at the Technological Educational Institute of Crete, Giorgos Siligardos PHD. brought a new perspective to Wilder’s RSI when he published his excellent and well-received articles "Reverse Engineering RSI " and "Reverse Engineering RSI II " in the June 2003, and August 2003 issues of Stocks & Commodities magazine, where he described his methods of reverse engineering Wilders RSI.
Several excellent Implementations of the Reverse Wilders Relative Strength Index have been published here on Tradingview and elsewhere.
My utmost respect, and all due credits to authors of related prior works.
Introduction
It is worth noting that while the general RSI formula, and the logic dictating the UpMove and DownMove data series as described above has remained the same as the Wilders original formulation, it has been interpreted in a different way by using a different method of averaging the upward, and downward moves.
Cutler recognized the issue of data length dependency when using wilders smoothing method of calculating RSI which means that wilders standard RSI will have a potential initialization error which reduces with every new data point calculated meaning early results should be regarded as unreliable until enough calculation iterations have occurred for convergence.
Hence Cutler proposed using Simple Moving Averaging for gain and loss data which this Indicator is based on.
Having "Reverse engineered" prices for any oscillator makes the planning, and execution of strategies around that oscillator far simpler, more timely and effective.
Introducing the Reverse Cutlers RSI which consists of plotted lines on a scale of 0 to 100, and an optional infobox.
The RSI scale is divided into zones:
• Scale high (100)
• Bull critical zone (80 - 100)
• Bull control zone (62 - 80)
• Scale midline (50)
• Bear critical zone (20 - 38)
• Bear control zone (0 - 20)
• Scale low (0)
The RSI plots are:
• Cutlers RSI
• RSI MA signal line
• Test price RSI
• Alert level high
• Alert level low
The info box displays output closing price levels where Cutlers RSI value will crossover:
• Its previous value. (RSI )
• Bull critical zone.
• Bull control zone.
• Mid-Line.
• Bear control zone.
• Bear critical zone.
• RSI MA signal line
• Alert level High
• Alert level low
And also displays the resultant RSI for a user defined closing price:
• Test price RSI
The infobox outputs can be shown for the current bar close, or the next bar close.
The user can easily select which information they want in the infobox from the setttings
Importantly:
All info box price levels for the current bar are calculated immediately upon the current bar closing and a new bar opening, they will not change until the current bar closes.
All info box price levels for the next bar are projections which are continually recalculated as the current price changes, and therefore fluctuate as the current price changes.
Understanding the Relative Strength Index
At its simplest the RSI is a measure of how quickly traders are bidding the price of an asset up or down.
It does this by calculating the difference in magnitude of price gains and losses over a specific lookback period to evaluate market conditions.
The RSI is displayed as an oscillator (a line graph that can move between two extremes) and outputs a value limited between 0 and 100.
It is typically accompanied by a moving average signal line.
Traditional interpretations
Overbought and oversold:
An RSI value of 70 or above indicates that an asset is becoming overbought (overvalued condition), and may be may be ready for a trend reversal or corrective pullback in price.
An RSI value of 30 or below indicates that an asset is becoming oversold (undervalued condition), and may be may be primed for a trend reversal or corrective pullback in price.
Midline Crossovers:
When the RSI crosses above its midline (RSI > 50%) a bullish bias signal is generated. (only take long trades)
When the RSI crosses below its midline (RSI < 50%) a bearish bias signal is generated. (only take short trades)
Bullish and bearish moving average signal Line crossovers:
When the RSI line crosses above its signal line, a bullish buy signal is generated
When the RSI line crosses below its signal line, a bearish sell signal is generated.
Swing Failures and classic rejection patterns:
If the RSI makes a lower high, and then follows with a downside move below the previous low, a Top Swing Failure has occurred.
If the RSI makes a higher low, and then follows with an upside move above the previous high, a Bottom Swing Failure has occurred.
Examples of classic swing rejection patterns
Bullish swing rejection pattern:
The RSI moves into oversold zone (below 30%).
The RSI rejects back out of the oversold zone (above 30%)
The RSI forms another dip without crossing back into oversold zone.
The RSI then continues the bounce to break up above the previous high.
Bearish swing rejection pattern:
The RSI moves into overbought zone (above 70%).
The RSI rejects back out of the overbought zone (below 70%)
The RSI forms another peak without crossing back into overbought zone.
The RSI then continues to break down below the previous low.
Divergences:
A regular bullish RSI divergence is when the price makes lower lows in a downtrend and the RSI indicator makes higher lows.
A regular bearish RSI divergence is when the price makes higher highs in an uptrend and the RSI indicator makes lower highs.
A hidden bullish RSI divergence is when the price makes higher lows in an uptrend and the RSI indicator makes lower lows.
A hidden bearish RSI divergence is when the price makes lower highs in a downtrend and the RSI indicator makes higher highs.
Regular divergences can signal a reversal of the trending direction.
Hidden divergences can signal a continuation in the direction of the trend.
Chart Patterns:
RSI regularly forms classic chart patterns that may not show on the underlying price chart, such as ascending and descending triangles & wedges, double tops, bottoms and trend lines etc.
Support and Resistance:
It is very often easier to define support or resistance levels on the RSI itself rather than the price chart.
Modern interpretations in trending markets:
Modern interpretations of the RSI stress the context of the greater trend when using RSI signals such as crossovers, overbought/oversold conditions, divergences and patterns.
Constance Brown, CMT, was one of the first who promoted the idea that an oversold reading on the RSI in an uptrend is likely much higher than 30%, and that an overbought reading on the RSI during a downtrend is much lower than the 70% level.
In an uptrend or bull market, the RSI tends to remain in the 40 to 90 range, with the 40-50 zone acting as support.
During a downtrend or bear market, the RSI tends to stay between the 10 to 60 range, with the 50-60 zone acting as resistance.
For ease of executing more modern and nuanced interpretations of RSI it is very useful to break the RSI scale into bull and bear control and critical zones.
These ranges will vary depending on the RSI settings and the strength of the specific market’s underlying trend.
Limitations of the RSI
Like most technical indicators, its signals are most reliable when they conform to the long-term trend.
True trend reversal signals are rare, and can be difficult to separate from false signals.
False signals or “fake-outs”, e.g. a bullish crossover, followed by a sudden decline in price, are common.
Since the indicator displays momentum, it can stay overbought or oversold for a long time when an asset has significant sustained momentum in either direction.
Data Length Dependency when using wilders smoothing method of calculating RSI means that wilders standard RSI will have a potential initialization error which reduces with every new data point calculated meaning early results should be regarded as unreliable until calculation iterations have occurred for convergence.

Esqvair's Relative Strength IndexThe Indicator
Esqvair's Relative Strength Index is the another modification of very popular Relative Strength Index by J. Welles Wilder
The Modification
This version uses de-lagged price as source, de-lagging price improves performance of the indicator.
How to use
The ways of usage are same as original Relative Strength Index that means you can use it as overbought and oversold indicator or as divergence indicator.

Relative Strength ComparisonThis script plots the ratio between a ticker and the selected index. Currently, I have US equities indexes listed + BTC. It's a great way to check for relative strength, determine if absolute highs relative to the ratio are being made, etc.
Additionally, optional comparison of the RSI is included. I was just testing something out but figured I'd leave in here because why not. If you use this, enable the 1.0 line.
Script is a bit slow, will try to optimize eventually.

Relative Strength Index of Moving AveragePine script version 3
Author CryptoJoncis
RSIOMA is the abbreviation for Relative Strength index (RSI) of moving averages (MA). This custom built indicator is based on calculating the relative strength of two moving averages and the smoothes out the RSI using a moving average. Combined, the RSIOMA oscillator depicts trend changes in prices relative to the time frame. The RSIOMA can be used as a signal generator by itself. (www.ProfitF.com)
There are some minor things which you can use to modify this version of RSIOMA:
Choose 2 levels of Over Sold and Over Bought for RSI
Set the middle level to easier visualize the trend
Set x% wider MA line to avoid too many fake signals and gain higher precision
You can choose which MA would you like to use from the following list:
Tillson Moving Average (T3)
Double Exponential Moving Average ( DEMA )
Arnaud Legoux Moving Average ( ALMA )
Least Squares Moving Average ( LSMA )
Simple Moving Average ( SMA )
Exponential Moving Average ( EMA )
Weighted Moving Average ( WMA )
Smoothed Moving Average ( SMMA )
Triple Exponential Moving Average ( TEMA )
Hull Moving Average ( HMA )
Adaptive moving average (AMA)
Fractal Adaptive Moving Average (FAMA)
Variable Index Dynamic Average ( VIDYA )
Triangular Moving Average (TRIMA)
Any questions/suggestions/errors or spelling mistakes? Please leave a comment and let me know.
You can use,publish,modify this code in any way as you wish, but only if you reference me after.
You are not allowed to sell it as it is.
If this code is useful to you, then consider to buy me a coffee 2.17% (or better a pint of beer) by donating Bitcoin 0.64% or Etherium to:
BTC: 3FiBnveHo3YW6DSiPEmoCFCyCnsrWS3JBR
ETH: 0xac290B4A721f5ef75b0971F1102e01E1942A4578
References:
www.profitf.com

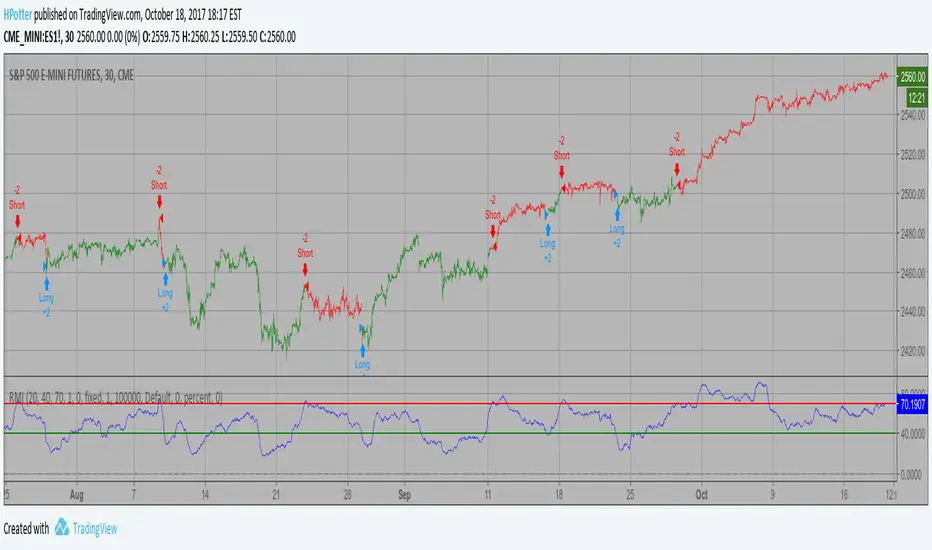
Relative Momentum Index Backtest The Relative Momentum Index (RMI) was developed by Roger Altman. Impressed
with the Relative Strength Index's sensitivity to the number of look-back
periods, yet frustrated with it's inconsistent oscillation between defined
overbought and oversold levels, Mr. Altman added a momentum component to the RSI.
As mentioned, the RMI is a variation of the RSI indicator. Instead of counting
up and down days from close to close as the RSI does, the RMI counts up and down
days from the close relative to the close x-days ago where x is not necessarily
1 as required by the RSI). So as the name of the indicator reflects, "momentum" is
substituted for "strength".
You can change long to short in the Input Settings
WARNING:
- For purpose educate only
- This script to change bars colors.
Relative Momentum Index Strategy The Relative Momentum Index (RMI) was developed by Roger Altman. Impressed
with the Relative Strength Index's sensitivity to the number of look-back
periods, yet frustrated with it's inconsistent oscillation between defined
overbought and oversold levels, Mr. Altman added a momentum component to the RSI.
As mentioned, the RMI is a variation of the RSI indicator. Instead of counting
up and down days from close to close as the RSI does, the RMI counts up and down
days from the close relative to the close x-days ago where x is not necessarily
1 as required by the RSI). So as the name of the indicator reflects, "momentum" is
substituted for "strength".
WARNING:
- This script to change bars colors.

Real Relative Strength Indicator### What is RRS (Real Relative Strength)?
RRS is a volatility-normalized relative strength indicator that shows you – in real time – whether your stock, crypto, or any asset is genuinely beating or lagging the broader market after adjusting for risk and volatility. Unlike the classic “price ÷ SPY” line that gets completely fooled by volatility regimes, RRS answers the only question that actually matters to professional traders:
“Is this ticker moving better (or worse) than the market on a risk-adjusted basis right now?”
It does this by measuring the excess momentum of your ticker versus a benchmark (SPY, QQQ, BTC, etc.) and then dividing that excess by the average volatility (ATR) of both instruments. The result is a clean, centered-around-zero oscillator that works the same way in calm markets, crash markets, or parabolic bull runs.
### How to Use the RRS Indicator (Aqua/Purple Area Version) in Practice
The indicator is deliberately simple to read once you know the rules:
Positive area (aqua) means genuine outperformance.
Negative area (purple) means genuine underperformance.
The farther from zero, the stronger the leadership or weakness.
#### Core Signals and How to Trade Them
- RRS crossing above zero → one of the highest-probability long signals in existence. The asset has just started outperforming the market on a risk-adjusted basis. Enter or add aggressively if price structure agrees.
- RRS crossing below zero → leadership is ending. Tighten stops, take partial or full profits, or flip short if you trade both sides.
- RRS above +2 (bright aqua area) → clear leadership. This is where the real money is made in bull markets. Trail stops, add on pullbacks, let winners run.
- RRS below –2 (bright purple area) → clear distribution or capitulation. Avoid new longs, consider short entries or protective puts.
- Extreme readings above +4 or below –4 (background tint appears) → rare, very high-conviction moves. Treat these like once-a-month opportunities.
- Divergence (not plotted here, but easy to spot visually): price making new highs while the aqua area is shrinking → distribution. Price making new lows while the purple area is shrinking → hidden buying and coming reversal.
#### Best Settings by Style and Asset Class
For stocks and ETFs: keep benchmark as SPY (or QQQ for tech-heavy names) and length 14–20 on daily/4H charts.
For crypto: change the benchmark to BTCUSD (or ETHUSD) immediately — otherwise the reading is meaningless. Length 10–14 works best on 1H–4H crypto charts because volatility is higher.
For day trading: drop length to 10–12 and use 15-minute or 5-minute charts. Signals are faster and still extremely clean.
#### Highest-Edge Setups (What Actually Prints Money)
- RRS crosses above zero while price is still below a major moving average (50 EMA, 200 SMA, etc.) → early leadership, often catches the exact bottom of a new leg up.
- RRS already deep aqua (+3 or higher) and price pulls back to support without RRS dropping below +1 → textbook add-on or re-entry zone.
- RRS deep purple and suddenly turns flat or starts curling up while price is still falling → hidden accumulation, usually the exact low tick.
That’s it. Master these few rules and the RRS becomes one of the most powerful edge tools you will ever use for rotation trading...

Relative Directional Index (RDI)🔍 Overview
The Relative Directional Index (RDI) is a hybrid tool that fuses the Average Directional and the Relative Strength Indices (ADX and RSI) into a single, highly visual interface. While the former captures trend strength, the latter reveals momentum shifts and potential exhaustion. Together, they can confirm trend structure, anticipate reversals, and sharpen the timing entries and exits.
📌 Why Combine ADX with RSI?
Most indicators focus on either trend-following (like ADX) or momentum detection (like RSI)—but rarely both. Each comes with trade-offs:
- ADX alone confirms trend strength but ignores momentum.
- RSI alone signals overbought/oversold, but lacks trend context.
The RDI resolves this by integrating both, offering:
- Smarter filters for trend entries
- Early warnings of momentum breakdowns
- More confident signal validation
🧠 Design Note: Fibonacci Harmony
All default values—5, 13, 21—are Fibonacci numbers. This is intentional, as these values reflect the natural rhythm of market cycles, and promote harmonic calibration between price action and indicator logic.
🔥 Key Features
✅ ADX Histogram
- Green bars = trend gaining strength
- Red bars = trend weakening
- Adjustable transparency for visual tuning
✅ ADX Line (Orange)
- Measures trend strength over time
- Rising = accelerating trend
- Falling = trend may be fading
✅ RSI Line (Lemon Yellow)
- Captures momentum surges and slowdowns
- Above 50 = bullish control
- Below 50 = bearish pressure
✅ Trend Strength Squares
- Bright green = strong uptrend
- Bright red = strong downtrend
- Faded colors = range-bound or indecisive
✅ ADX/RSI Crossover Markers
- Yellow square = RSI crosses above ADX → momentum building
- Orange square = ADX crosses above RSI → trend still dominant
✅ Customizable Reference Lines
- Yellow (50) = strong trend threshold
- Red (30) = weak trend zone
- Green (70) = overextended, potential exhaustion
_______________________________________________________
🎯 How to Trade with the RDI
The RDI helps traders identify momentum-supported trends, catch early reversals, and avoid false signals during consolidation.
✅ Trend Confirmation Entries
🔼 Bullish → Enter long on pullbacks or resistance breakouts
- ADX rising above 30
- RSI above 50
- Green trend square visible
🔽 Bearish → Enter short on breakdowns or failed retests
- ADX rising
- RSI below 50
- Red trend square visible
🧯 Exit if RSI crosses back against trend direction or ADX flattens
🚨 Reversal Setups Using Divergence
📈 Bullish Divergence → Long entry after confirmation (e.g. engulfing bar, volume spike)
- Price prints lower low
- RSI prints higher low
- Green triangle
📉 Bearish Divergence → Short entry on breakdown
- Price prints higher high
- RSI prints lower high
- Red triangle
Tip: Stronger if ADX is declining (fading trend strength)
🔂 Breakout Detection via Cross Markers
- Yellow square = RSI > ADX → breakout brewing
- Orange square = ADX > RSI → trend continuation likely
⏸️ Avoid Choppy Markets
- RSI between 45–55
- Faded trend squares
- Flat ADX below 20–30
🧠 Pro Tips
- Combine RDI with VWAPs, moving averages and/or pitchforks
- Watch for alignment between trend and momentum
- Use divergence markers as confirmation, not stand-alone triggers
_______________________________________________________
⚠️ Hidden Divergence (Optional)
The RDI includes optional hidden divergence detection. These signals suggest trend continuation but are off by default. Use with discretion—best in established trends, not sideways markets.
🙈 Hidden Bullish
- Price prints higher low
- RSI prints lower low
🙈 Hidden Bearish
- Price prints lower high
- RSI prints higher high

Multi Timeframe Relative Strength Index {DCAquant}Overview
The Multi Timeframe Relative Strength Index (MTF RSI) is a powerful technical analysis tool designed to provide insights into market momentum and potential trend reversals across multiple timeframes. Leveraging the Relative Strength Index (RSI) formula, this indicator offers traders a comprehensive view of market sentiment and identifies overbought and oversold conditions.
Key Features
RSI Calculation:
Utilizes the standard RSI calculation formula to measure the magnitude of recent price changes and assess the strength of market trends.
Employs a user-defined length parameter to customize the sensitivity of the RSI calculation based on trading preferences.
Multiple Timeframe Analysis:
Allows traders to analyze RSI values across up to six different timeframes, ranging from minutes to days, providing a holistic perspective on market dynamics.
Calculates RSI values independently for each selected timeframe, enabling comparison and trend identification.
Threshold Levels:
Defines overbought and oversold levels to highlight potential reversal points in market trends.
Offers flexibility in adjusting threshold levels based on individual risk tolerance and trading strategies.
Neutral Zone:
Establishes upper and lower neutral thresholds to identify periods of consolidation or sideways movement in price.
Helps traders distinguish between trending and ranging market conditions for more accurate analysis.
Moving Average Smoothing:
Provides the option to apply moving average smoothing to aggregated RSI values for enhanced clarity and reduced noise.
Enables smoother visualization of RSI trends, facilitating easier interpretation for traders.
Visual Representation:
Plots the aggregated MTF RSI values on the price chart, allowing traders to visually assess market momentum and potential reversal points.
Utilizes color-coded backgrounds to indicate Long, Short, or Neutral conditions for quick identification.
Dynamic Table Display:
Displays trading signals alongside graphical indicators (rocket for Long, snowflake for Short, and star for Neutral) in a customizable table format.
Offers flexibility in table placement and size to accommodate user preferences.
How to Use:
Parameter Configuration:
Adjust the length parameter to fine-tune the sensitivity of the RSI calculation based on the desired timeframe and trading strategy.
Define overbought and oversold levels to identify potential reversal points in market trends.
Customize upper and lower neutral thresholds to differentiate between trending and ranging market conditions.
Interpretation:
Monitor the aggregated MTF RSI values plotted on the price chart for signals of overbought or oversold conditions.
Pay attention to color-coded backgrounds and graphical indicators in the table for actionable trading insights.
Trading Strategy:
Consider entering Long positions when the aggregated MTF RSI is above the upper neutral threshold, indicating potential bullish momentum.
Evaluate Short opportunities when the aggregated MTF RSI falls below the lower neutral threshold, signaling possible bearish momentum.
Exercise caution during Neutral conditions, as there may be uncertainty in market direction.
Risk Management:
Combine MTF RSI analysis with robust risk management strategies, including stop-loss and take-profit levels, to manage trading risks effectively.
Practice prudent risk management and trade within your risk tolerance to minimize potential losses.
Disclaimer
Trading in financial markets involves risk, and past performance is not indicative of future results. The use of the MTF RSI indicator does not guarantee profits or prevent losses. Traders should conduct their own analysis, exercise caution, and seek advice from qualified financial professionals before making trading decisions.

Dow Factor Relative Strength IndexThis script was written to create a new, rapid relative strength index inspired by the Dow Theory.
More info about Dow Theory : www.investopedia.com
According to the Dow Theory, volume should confirm market trends.
The correlation coefficient between prices and volume is negative in weakening trends and negative trends , positive in strengthening or positive trends.a factor was formed based on the correlation coefficient between volume and prices.
This factor was added to the relative strength index.
Period 5 is selected because the volume is very volatile and can be slow.
You can use the period you want, but I recommend the period as a minimum of 5.
It is suitable for all instruments and timeframes and thanks to its design, it provides control over gradual buying and selling points.
I haven't fully tested it, it's open to updates. For now, just use it to create ideas.
If I find it necessary,
I'll update after the tests.
If you have suggestions on these issues,
Leave your comments in the comment window.
This code is open source under the MIT license. If you have any improvements or corrections to suggest, please send me a pull request via the github repository github.com
Stay tuned , best regards.
Kairi Relative IndexKairi Relative Index indicator script. The Kairi Relative index is an old Japanese metric with unknown origins.
Relative Strength Index (RSI) w/ Multi Time Frame w/ DivergencesThis indicator is an advanced evolution of the classic Relative Strength Index (RSI), designed to provide deeper market context by combining Momentum, Multi-Timeframe (MTF) analysis, and Divergences into a single, clean visual tool.
Unlike standard indicators, RSI MTF Pro v2 allows you to configure the Main RSI and the Background Trend Zone independently, giving you full control over your strategy (e.g., watching a 15m RSI while monitoring the 4H trend).
Key Features:
🚀 Dual MTF Engine: Completely independent settings for the Main RSI Line and the Background Zone. You can choose different Timeframes, Lengths, and Levels for each.
heatmap Style Background: The indicator background changes color (Red/Green) based on the MTF RSI trend, helping you filter out bad trades and stick to the dominant trend.
🎨 Smart Gradient Fills: To keep your chart clean, the gradient colors (Red/Green fills) only appear when the RSI breaches the Overbought or Oversold levels.
🎯 Divergence Detector: Automatically spots and marks Regular Bullish and Bearish divergences with pivot-based logic.
How to Use:
Trend Confirmation: Use the Background Color to determine the higher timeframe direction (e.g., Red Background = Uptrend).
Entry Signals: Look for RSI signals that align with the background color (e.g., RSI Oversold/Green Gradient + Green Background).
Reversals: Use the built-in Divergence circles to spot potential trend reversals.
Settings:
Main RSI: Customizable Timeframe, Length, OB/OS Levels.
MTF Background: Independent Timeframe, Length, and Zone thresholds (e.g., >60 Red, <40 Green).
Divergences: Toggle On/Off and adjust Pivot lookback periods.
Disclaimer: This tool is for informational purposes only and does not constitute financial advice.

Relative Strength Index Custom [BRTLab]RSI Custom — Strategy-Oriented RSI with Multi-Timeframe Precision
The Relative Strength Index Custom is designed with a focus on developing robust trading strategies. This powerful indicator leverages the logic of calculating RSI on higher timeframes (HTFs) while allowing traders to execute trades on lower timeframes (LTFs). Its unique ability to extract accurate RSI data from higher timeframes without waiting for those candles to close provides a real-time advantage, eliminating the "look-ahead" bias that often
distorts backtest results.
Key Features
Multi-Timeframe RSI for Strategy Development
This indicator stands out by allowing you to calculate RSI on higher timeframes, even while operating on lower timeframe charts. This means you can, for example, calculate RSI on the 1-hour or daily chart and execute trades on a 1-minute chart without needing to wait for the higher timeframe candle to close. This feature is crucial for strategy-building as it eliminates backtesting issues where data from the future is inadvertently used, providing more reliable backtest results.
Example: On a 15-minute chart, you can use the 1-hour RSI to open positions based on higher timeframe momentum, but you get this signal in real-time, improving timing and accuracy.
Accurate Data Extraction from Higher Timeframes
The indicator's custom logic ensures that accurate RSI data is retrieved from higher timeframes, providing an edge by delivering timely information for lower timeframe decisions. This prevents delayed signals often encountered when waiting for higher timeframe candles to close, which is crucial for high-frequency and intraday traders looking for precise entries based on multi-timeframe data.
Customizable RSI Settings for Strategy Tuning
The script offers full customization of the RSI, including length and source price (close, open, high, or low), allowing traders to tailor the RSI to fit specific trading strategies. These settings are housed in the "RSI Settings" section, enabling precise adjustments that align with your overall strategy.
No Future-Looking in Backtests
Traditional backtests often suffer from "future-looking" bias, where calculations unintentionally use data from candles that haven’t yet closed. This indicator is specifically designed to prevent such issues by calculating RSI values in real-time. This is particularly important when creating and testing strategies, as it ensures that the conditions under which trades would have been made are accurately represented in historical tests.
RSI-Based Moving Average for Additional Filtering
The built-in moving average (MA) based on RSI values helps filter out noise, making it easier to identify genuine trend shifts. This is particularly useful in strategies where moving average crossovers act as additional confirmation for trade entries and exits.
Overbought and Oversold Zone Detection
Visual gradient fills on the RSI chart help traders identify overbought and oversold zones (above 70 and below 30, respectively). These zones are crucial for timing reversal trades or confirming momentum-based strategies.
How This Indicator Enhances Your Strategy
Increased Accuracy for Intraday Strategies
For traders who operate on lower timeframes, using higher timeframe RSI data gives a broader perspective of market momentum while still maintaining precision for short-term trade entries. The real-time data extraction means you don't need to wait for HTF candles to close, which can dramatically improve your entry timing.
Strategic Edge in Backtesting
One of the greatest challenges in backtesting strategies is avoiding future-looking bias. This indicator is built to overcome this by using real-time multi-timeframe data, ensuring the accuracy and reliability of historical strategy testing, which provides confidence in your strategies when applied to live markets.
Advanced Filtering for Trend Strategies
By combining the RSI values with a customizable moving average (MA) and visualizing key momentum zones with overbought/oversold fills, the indicator allows for more refined trade filters. This ensures that signals generated by your strategy are based on solid momentum data and not short-term price fluctuations.
