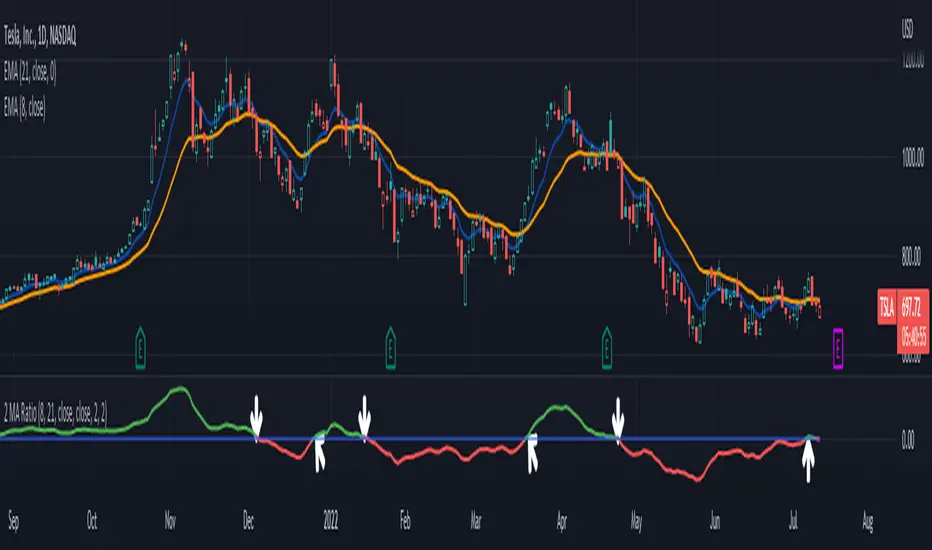
2 MA Ratio Can Help with Moving AveragesMany technical analysts use moving average crosses to assess trend changes. A faster-moving MA crossing above a slower-moving line may be viewed as a bullish signal. The opposite can apply to the downside.
While these methods may help analyze price direction, they can often force traders to wait until the cross occurs. Sometimes it may be useful to anticipate the event – or at least know it’s getting close.
That’s where the custom script 2 MA Ratio can be useful because it tracks the fast and slow moving averages. The fast MA is then shown as a percent of the slow MA. Positive readings indicate a bullish condition and vice versa for the negative.
It’s also color-coded to clearly illustrate when the crosses occur.
2 MA Ratio can handle simple moving averages (SMAs) and exponential moving averages (EMAs). It even lets you compare SMAs to EMAs. Users can choose between using open, high, low or closing prices as the inputs. (It defaults to Close.)
The chart above shows the short-term pair of the 8- and 21-day EMAs on Tesla (TSLA). The second chart below shows the same stock with the slower 50- and 200-day SMAs. Notice the “Golden Cross” last summer and the “Death Cross” in May:
TradeStation has, for decades, advanced the trading industry, providing access to stocks, options, futures and cryptocurrencies. See our Overview for more.
Important Information
TradeStation Securities, Inc., TradeStation Crypto, Inc., and TradeStation Technologies, Inc. are each wholly owned subsidiaries of TradeStation Group, Inc., all operating, and providing products and services, under the TradeStation brand and trademark. You Can Trade, Inc. is also a wholly owned subsidiary of TradeStation Group, Inc., operating under its own brand and trademarks. TradeStation Crypto, Inc. offers to self-directed investors and traders cryptocurrency brokerage services. It is neither licensed with the SEC or the CFTC nor is it a Member of NFA. When applying for, or purchasing, accounts, subscriptions, products, and services, it is important that you know which company you will be dealing with. Please click here for further important information explaining what this means.
This content is for informational and educational purposes only. This is not a recommendation regarding any investment or investment strategy. Any opinions expressed herein are those of the author and do not represent the views or opinions of TradeStation or any of its affiliates.
Investing involves risks. Past performance, whether actual or indicated by historical tests of strategies, is no guarantee of future performance or success. There is a possibility that you may sustain a loss equal to or greater than your entire investment regardless of which asset class you trade (equities, options, futures, or digital assets); therefore, you should not invest or risk money that you cannot afford to lose. Before trading any asset class, first read the relevant risk disclosure statements on the Important Documents page, found here: www.tradestation.com .
在腳本中搜尋"TESLA"
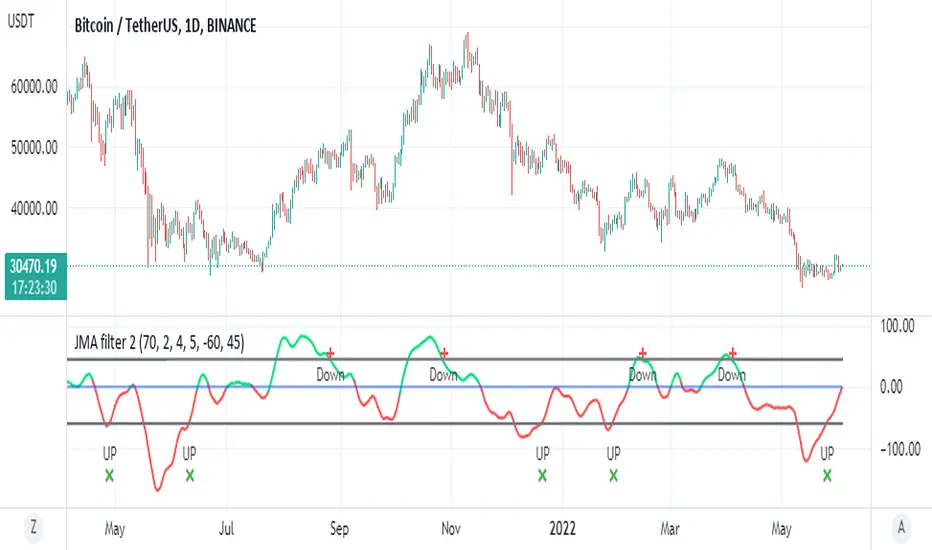
JMA filter 2This is based on ChuckBanger Juric indicator (a modification of it)
things you need to know how to work with this one
to control the wave setting you need to adjust the length , slow ,fast and c in menu for optimal result
positive trend is above zero in green
negative trend bellow zero red
the best part herein this indicator is to finding of high and low based on lower treshold =trel
higher threshold for high =treh
there is signals once it crossed up or down
for each time frame you need to set the threshold for optimal results as it change for each TF it will be different so be careful about it
so rule of thumb is to look for the previous peaks either up or down and to set the threshold according to it
it more sensitive then RSI to my opinion and very good to detect sweet spot either for sell or buy
one can add alerts (not included)
or modify it to make it better
here on Tesla
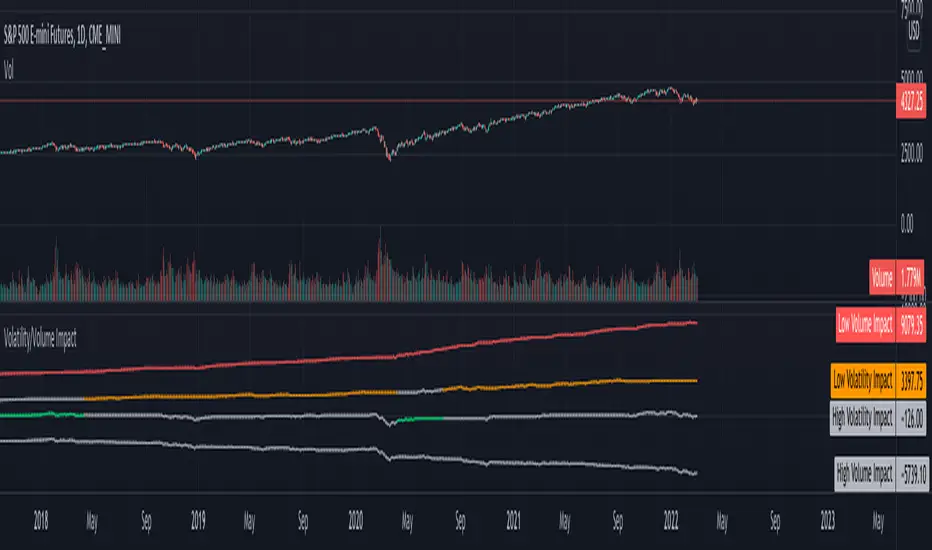
Volatility/Volume ImpactWe often hear statements such as follow the big volume to project possible price movements. Or low volatility is good for trend. How much of it is statistically right for different markets. I wrote this small script to study the impact of Volatility and Volume on price movements.
Concept is as below:
Compare volume with a reference median value. You can also use moving average or other types for this comparison.
If volume is higher than median, increment positive value impact with change in close price. If volume is less than median, then increment negative value impact with change in close price.
With this we derive pvd and nvd which are measure of price change when volume is higher and lower respectively. pvd measures the price change when volume is higher than median whereas nvd measures price change when volume is lower than median.
Calculate correlation of pvd and nvd with close price to see what is impacting the price by higher extent.
Colors are applied to plots which have higher correlation to price movement. For example, if pvd has higher correlation to price movement, then pvd is coloured green whereas nvd is coloured silver. Similarly if nvd has higher correlation to price then nvd is coloured in red whereas pvd is coloured in silver.
Similar calculation also applied for volatility.
With this, you can observe how price change is correlated to high/low volume and volatility.
Let us see some examples on different markets.
Example 1: AMEX:SPY
From the chart snapshot below, it looks evident that SPY always thrive when there is low volatility and LOW VOLUME!!
Example 2: NASDAQ:TSLA
The picture will be different if you look at individual stocks. For Tesla, the price movement is more correlated to high volume (unlike SPY where low volume days define the trend)
Example 3: KUCOIN:BTCUSDT
Unlike stocks and indices, high volatility defined the trend for BTC for long time. It thrived when volatility is more. We can see that high volume is still major influencer in BTC price movements.
Settings are very simple and self explanatory.
Hint: You can also move the indicator to chart overlay for better visualisation of comparison with close price.
Long Term Buy/Sell Signal by BonyThis script attempts to use Exponential Moving averages (short-term and long-term convergence) of different lengths in order to identify trade entries and exits for bullish & bearish trades. I would strongly recommend using this as a guide to enter or exit long-term swing trades on growth names such as Apple, Tesla, Microsoft to keep your emotions out of the trading. You use this script by entering a trade when it signals a green BUY signal with a UP arrow and exiting when it signals red. The general idea is that one is fast and one is slow-moving EMA and these indicate when to buy/sell when they crossover the overbought/sold lines.
Disclaimer:
This script is for educational purposes only. The market is always moving up or down, so always trade with caution and use your best judgment for every trade.

[CP]Pivot Boss Floor Pivots with ATR Dilation and Dynamic LevelsINTRODUCTION:
Compared to all the Pivot Indicators available on Trading View Public Library, this Floor Pivots Indicator differentiates itself in two major original ways:
Dilates the Pivot Support/Resistance Levels into Support/Resistance Bands based on volatility
Displays the S/R Levels Dynamically , that is, only those levels will be shown that are close enough to the price resulting in much cleaner looking charts.
There were a few features whose logic I had figured out, but I could not implement them due Pine Script’s Limitation (they should really work on increasing Pine Script’s capacity instead of adding more and more features to the language in order to make it look ‘better’):
Showing multiple timeframe pivots at the same time (not possible due to Pine Script’s limitation on the ‘Max Number of Outputs’ )
Automatic Detection of highly profitable Double Hot Pivot Zones (DPZ), also due to the ‘Max Number of Outputs’ limit
GENERAL USER INPUTS:
Most of the settings are self-explanatory, however, a few of them need some explanation:
Show Floor Pivots Dynamically – This will turn ON the dynamic pivot levels, please note that this function will work ONLY IN INTRADAY timeframes.
Dynamic Pivot ATR Period – Period over which the ATR value is calculated to show the pivots dynamically.
ATR Threshold for Dynamic Floor Pivots – Simply put, the indicator will start displaying Pivot Levels if they fall within the 2*ATR distance (default value) of the price. You can increase this number if the volatility increases and vice-versa.
Use ATR to Dilate Intraday Pivot Levels – This will turn ON Floor Pivot Dilation, turning pivot ‘lines’ into ‘bands’ .
ATR Dilation Factor – This number decides the width of the Pivot bands. Larger this number, thicker the bands. Typically, high volatility stocks will require a higher number.
ATR Period – Same as Dynamic Pivot ATR Period, but for Pivot Level Dilation.
INDICATOR USAGE EXAMPLES:
This indicator works great in conjunction with my Pivot Boss Candlestick Scanner indicator.
There are a lot of optimizations I have done in the code, although it looks trivial at first glance, but it's fairly complex.
Feel free to use it and modify it as you wish.
Here are a few examples where the indicator has shown great entries and exits, with the default settings:
NIFTY 5m Chart
Reliance 5m Chart
Tesla 5m Chart
Bitcoin-USDT 15m Chart
FINAL WORDS:
Please understand that I have Cherry Picked the examples to showcase the capability of the indicator and its usage.
DO NOT conflate the accuracy of examples with the accuracy of this indicator.
Once you start using floor pivots, you will realize that a lot of days simply don’t give any high probability setups and you will simply sit out of the market and do nothing (which is a good thing).
If you really want to learn how to use Pivots, read the book ’Secrets of a Pivot Boss’ . This book can change your life.

Vwap mtf Swing Stock StrategyThis is a trending strategy designed for stock market, especially long trending assets such as TSLA, NIO, AMAZON and so on.
Its made of volatility bands and weekly VWAP, in this case daily and weekly.
This strategy has been adapted to go long only.
Rules for entry
For long , we want to enter close of a candle is above vwap weekly, and at the same time the close of a candle cross-under the lower volatility band.
For exit , we want to enter close of a candle is below vwap weekly, and at the same time the close of a candle cross-over the upper volatility band.
This strategy does not have a risk management inside, so use it with caution.
If you have any questions, let me know !

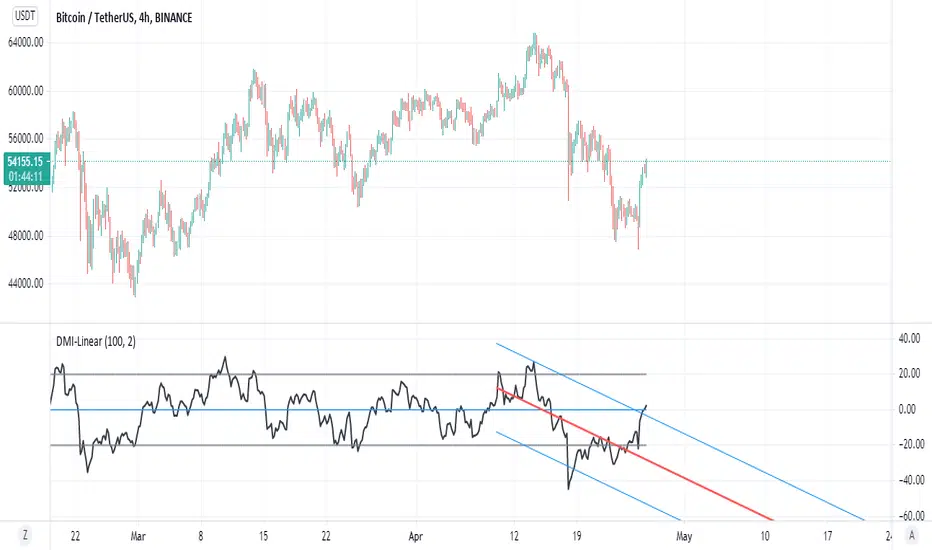
DMI-LinearThis indicator based on DMI + a modified version of it and a modified version of linear regression
so best enter point is either when it cross mid-line of linear regression line or cross zero
1 hour chart
can enter when it bellow low line and lower part of linear channel
exit on opposite direction
you can modify this script and make it better no need for my approval
tesla
TreLThis indicator based on linear regression trend
blue line is trend postive or buy trend. red line trend is sell
there is MTF non repiant to add for it so you can see the trend at differnt TF
upper and lower of chanel are i gray line
very simple and effective way to use linear regression in a diffrent approach
tesla
withot mtf

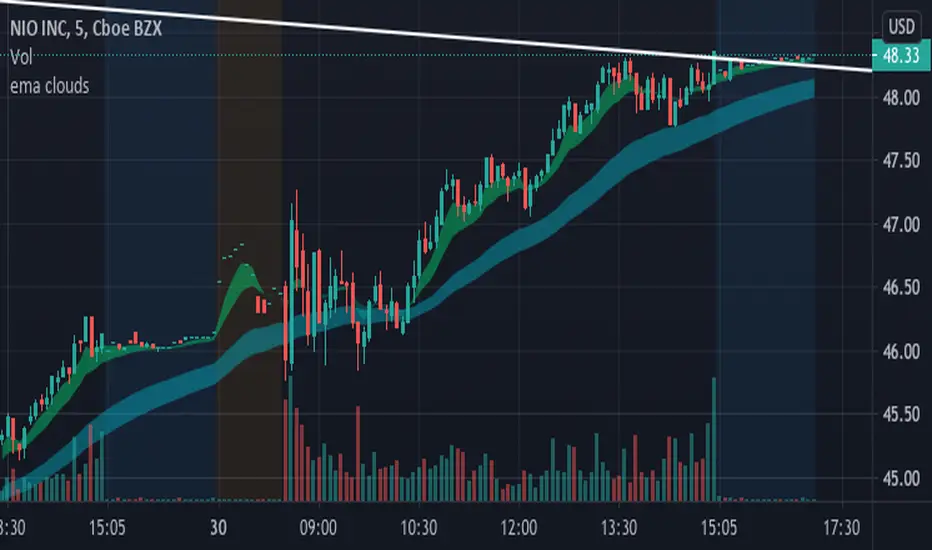
EMA clouds (5/12 and 34/50)This is a custom ema cloud script with a 5/12 cloud and a 34/50 cloud.
Personally, I used to trade with the 20 ema and 50 ema, but wanted something with a little more robust. These clouds are especially great for the first hour of market open since strong bullish stocks that have gapped up overnight tend to follow these trends.
For example, Tesla opened above the clouds and used them as support before running all day.
NIO happened to do a similar move.
Percentage Relative StrengthA relative strength indicator that compares your main symbol (one on your chart) strength to another symbol by percentage.
The result is plotted as a histogram showing which symbol is rising or falling more in percentage.
In case your chart symbol is TSLA (Tesla) and the indicator 'Symbol to compare' is SPX:
GREEN area (above zero) means TSLA is rising more than the SPX.
RED area (below zero) means TSLA is falling more than the SPX.
To these who wants to understand calculation, it's pretty straightforward.
For each asset we calculate everyday percentage change based on previous close and current close.
We take main asset (chart symbol) percentage and subtract it from percent of change of the symbol we want to compare to.
Result are smoothed by SMA (Simple Moving Average)
You can select different indexes or cfds such as S&P500 (SPX), NASDAQ 100 (NSX), RUSSELL 2000 (RUT) and NASDAQ (IXIC).
Default is S&P 500 (SPX).
Enjoy and Like if you like.

Stock Market Strategy : VWAP, MACD, EMA, Breakout, BBHello there,
Today I bring you a stock market strategy, specialized in NASDAQ stocks.
Its a daytrading strategy, that can only do a max of 1 trade per day. In this case it only trades the first 2 opening hours of the market.
The rules are simple :
We follow the trend based on a big EMA, in this case 200, after that, we check for VWAP direction , then, we check histogram from MACD. This is the simple logic of the strategy.
Inside there is another strategy, that not just do the above, but also uses Bollinger bands, and checks for breakout of bottom or top line. Also it uses Average directional Index, for even a bigger criteria .
So for example a long condition it would be : candle is above the ema, and candle is above vwap, and histogram is positive, and candle break the top bb level and ADI < 40 -> long signal . The opposite works for short(ADI > 20).
In this case all this criterias are between the first 2 hours of market. So we enter between the first hour, and exit in the next hour. For this we need to use very short time frames.
Hope you enjoy it.
Let me know if you have any questions

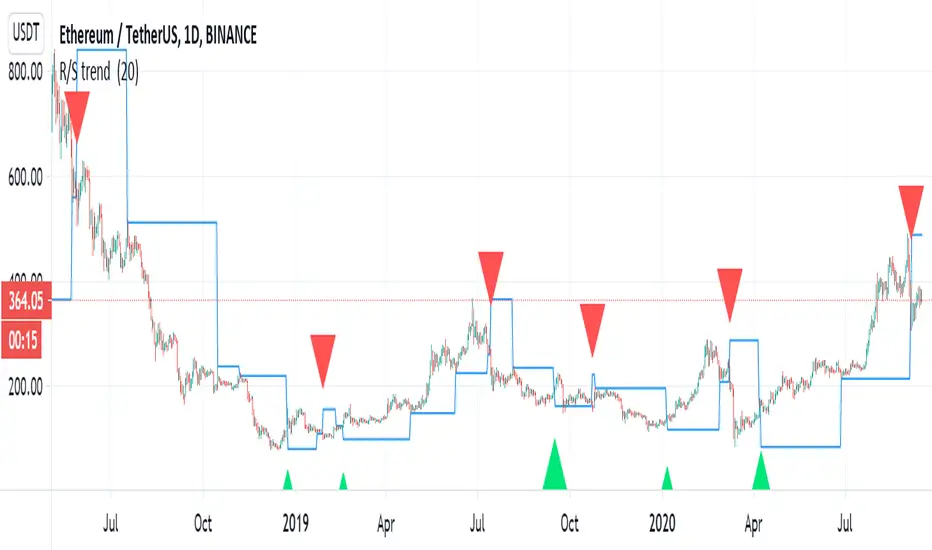
R/S trend my stupid country go to lockdown again due to covid 19, so at least i can play with some scripts:)
This is not super trend but by the same logic, we can make a trend based on support and resistance.
r =length so if you want it to buy more make it shorter or vice versa
alerts inclusded plus signals
the trend based o finding highest high and lowest low
i hope you like this one
tesla
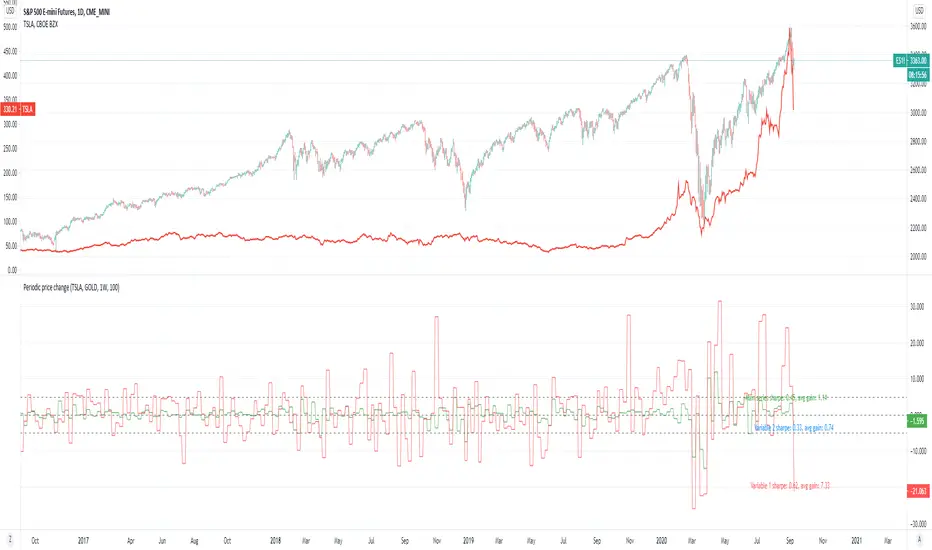
Periodic price change comparisonPeriodic price change.
Application:
Sector rotation analysis by comparing different tickers.
Simple statistical analysis (with lookback period) for knowing how good they were.
If you are a believer in sector rotation, you can add different sector stocks to see which of them are lagged behind and buy them.
In this example, you could see tesla periodically fall behind the market. You can buy it when it is on that zone.
And you can also refer to the sharpe ratio and the average gain rate on the chart to see how good the stocks were.
JMA filter 1This my adapt version of juric filter
I took the script from chuck berger
I just add my adaptation to it
i think it make this filter more accurate
Lazy Bear is the original creator of this filter
by time it has many version
So I try to make my to this great script
buy is lime
sell is red
thanks to original authors
tesla
dow 30
etc etc:)

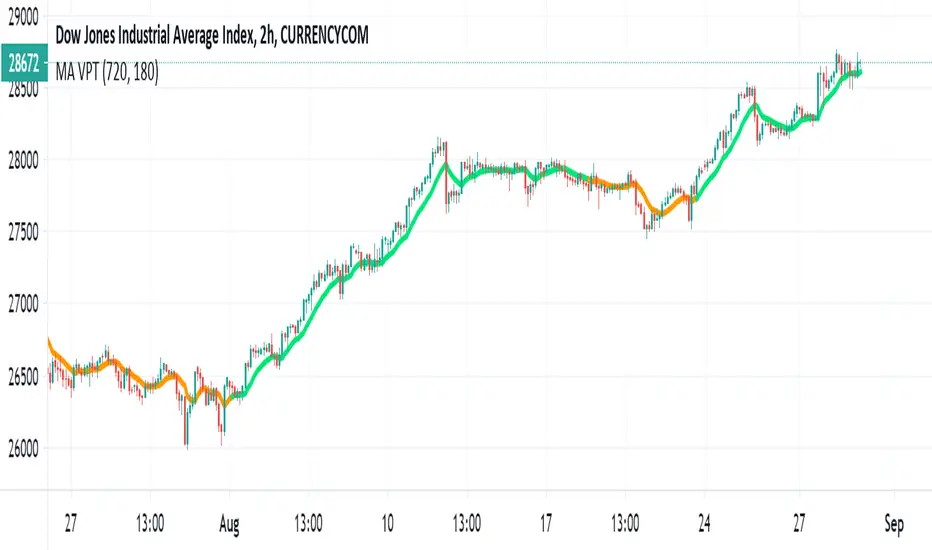
MA VPTVery nice trend follower based on VPT from my early stuff
and MA that i created from indicator step V (in my indicator list)
when one is above the other we get signal
buy is lime
sell is orange
here the TF is set to 180 for indicator MA and 720 for the VPT
if you want i can add alerts and symbols later
very simple indicator but show the trend very nicely
tesla 4 hour
msf
gold
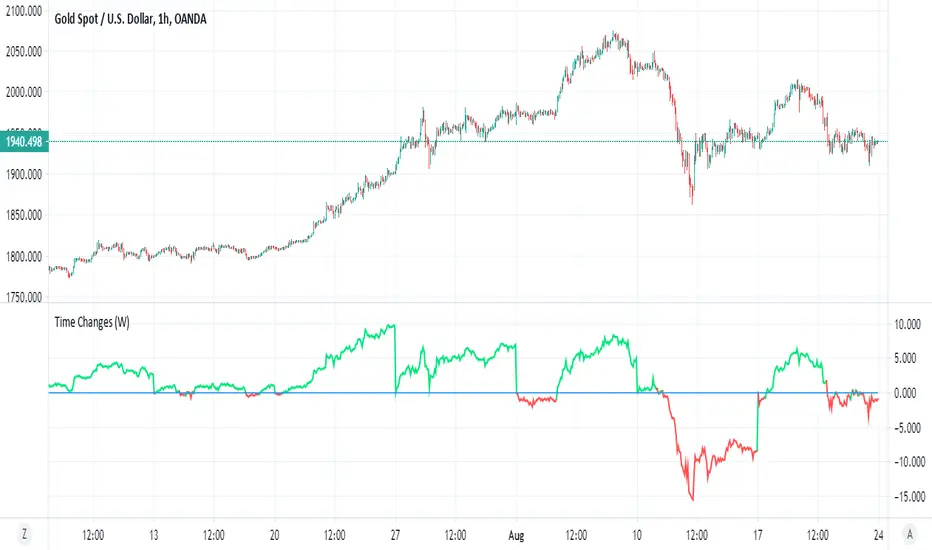
Time ChangesThis is very cool and simple script
I just play around with non security MTF and this is the end result:)
buy period is lime, sell period is red
since it based on the changes of the MTF by time it give us very nice signal of bullish or bearish period
since no security is here so no repaint fear..
if you use 1 hour candle choose either daily (better for crypto ) or weekly MTF (better for stocks ) or even higher
if you use lower TF then try to see which MTF is best suited for it
simple and nice I think :)
here on tesla
facebook
boeing
nifty
forex
etc
Mean Deviation Detector - Throw Out All Other IndicatorsI set out this morning to create a script that searches out price moves that went too far too fast relative to historical pricing, given that such situations often result in the most profitable trading opportunities. I came up with the mean deviation detector. This script should be used as a means of judging how far a price is trading, in percent terms, from it's "average trading zone".
This is extremely helpful in a couple scenarios.
First, it can be used to judge a move's volatility relative to it's previous volatility. Put simply, a 5% move in the stock of Coca Cola is a lot more meaningful than a 5% move in the stock of Tesla, and the detector puts moves into historical (visual) perspective.
Second, the indicator can be used in real time as a means of determining when the chances of mean reversion are high or low. Extreme values are unsustainable and often lead to EITHER A.) price mean reversion or B.) time mean reversion. Put simply, prices either went too far and are due to fall back to a historical mean, or they need more time to digest a potentially new pricing zone.
Without getting too deep into volume profile analysis, the MDD can be a simple way of telling that a stock has moved into an "air pocket", where prices will either come back to the previous volume node (price mean reversion) or set up shop in a new, uncharted area (time mean reversion).
An extreme value doesn't always mean a trading opportunity, but it means that something interesting is happening in the stock / instrument.
I use this indicator to help me trade covered calls. Lots of high yielding weekly opportunities are stocks that have moved too far too fast, and I like to use this indicator as a means of either a.) scooping up stocks that have gotten beat up from a historical mean perspective & have likely seen the risk already "beaten" out of them, or to b.) stay away from stocks that have a very high chance of price correcting lower. In situations where I say that the risk has been "beaten" out of something, it doesn't mean that the stock won't continue to fall, it simply means that the degree and acceleration of the fall has peaked and that risk premiums in selling options will / should easily pay for continued losses. In the event that it's a price correction and not a time correction, you also increase your bat rate because you get auto-liquidated at a max profit. It's a really valuable tool in my kit.
You can also feel free to put a Keltner Chanel overlay onto the MDD to filter out noise, identify "extreme" values, and place mean reversion trades if you expect price mean reversion is likely, if you want to use this as the basis of a proper trading strategy. For a high extreme value, you could sell short term OTM call spreads, for example.
The MDD is adaptable to your own trading style & preferences.

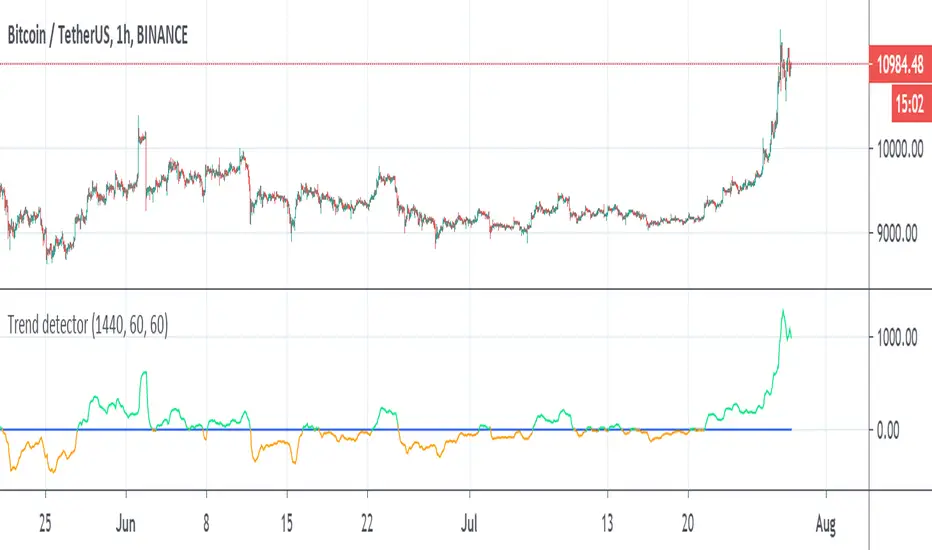
Trend detectorThis is trend detector
buy above 0 sell bellow zero (lime and orange color)
you can set it using min distance (now set to 1440)
The MTF sytem source original idea by Duyck
perfect indicator for the day trader
you can use the Low scanner that i put early for entry or use this system for it
tesla
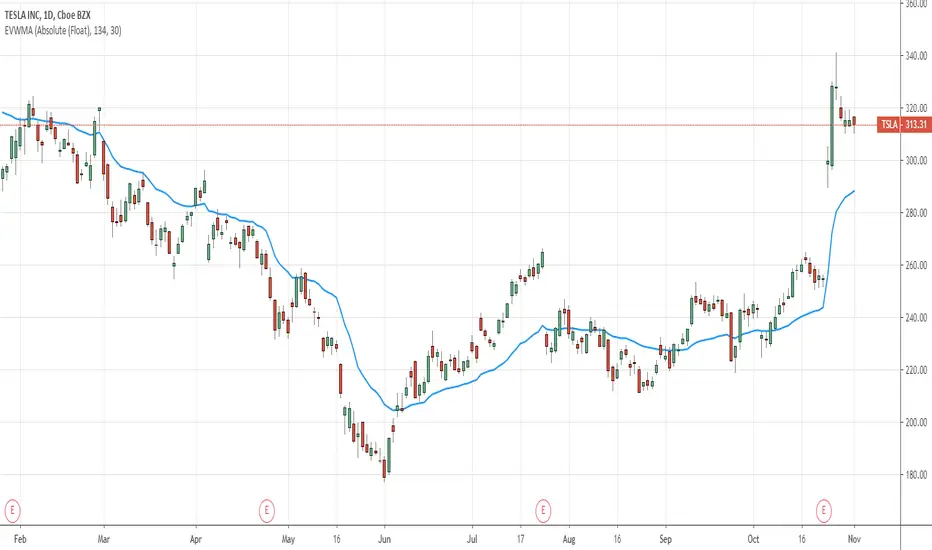
QuantNomad - Elastic Volume Weighted Moving AverageEVWMA is a quite interesting moving average where period of the MA is defined from volume itself.
It incorporates volume information in a natural and logical way. The eVWMA can be looked at as an approximation to the average price paid per share.
As a volume period you can use:
- Absolute volume value, for example floating number of shares. 134M for Tesla for example.
- Sum of the last x bars volumes.
Indicator was developer by Christian P. Fries, Ph.D.
QuantNomad - SuperTrend - TSLA - 1mInteresting performance for Super Trend strategy for Tesla ( TSLA ) 1m chart.
Params: ST Mult: 3, ST Period 120.
Performance:61% profit, 637 trades, only 33% prof, 4.84% dd , 0.4 Sharpe.
On its own, it might be not a very good strategy, but the big amount of trades allows you to add more filters and improve it.
The strategy is not bad both with "when" params when strategy executed on open of next bar and with stop orders when strategy enters on exact Super Trend level.
You can comment/uncomment lines in the code and switch from one approach to another.
And remember:
Past performance does not guarantee future results.
