⚪ SILVER — RISK MATRIX + UQ vC (Final HUD)Silver RISK MATRIX + UQ vC is an advanced Pine Script v5 indicator for silver futures (SIL) trading, featuring a 3-column bottom-right HUD combining a 7-factor risk matrix with UQ predictive scoring. It quantifies position, structure, trend conflicts, impulse, volume, fake breaks, and VWAP deviation into total risk levels (LOW/MEDIUM/HIGH) while fusing predictive BUY/SELL probabilities with directional risk and multi-timeframe trend boosts.
Risk Matrix Breakdown
Position Risk
Measures % distance to 18-period support/resistance: <0.10% resistance = high risk (🟥🟥), <0.25% = medium (🟧⬜), <0.10% support = safe (🟩⬜). Silver-tuned for tight proximity sensitivity.
Structure Risk
Detects pivot-based CHoCH conflicts (close breaks prior HH/HL but structure opposes) or fake breaks, scoring 2 for conflicts using tight 2-left/2-right pivots suited to silver's volatility.
Other Factors
Trend Conf: 5m vs 30m EMA40 mismatch (2 points).
Impulse: Body >1.2x 4-period EMA abs body (exhaustion).
Volume: >3.2x/2.2x 20-SMA thresholds for extreme/obvious surges.
Fake Break: Wick >1.2x body (top/bottom).
VWAP: >1.2%/0.6% deviation. Total ≥6=HIGH (red), ≥3=MEDIUM (orange).
UQ Predictive Engine
Base Prediction
Averages flow (OBV+price), momentum (RSI/MFI), VWAP, trend (EMA20/50), turbo (BB width expansion) into pred_buy/sell (0-1 normalized).
Directional Risk
BUY risk weights fakeUp wicks, impulse, bear vol, low position; SELL mirrors. Clamped 0-1.
Trend Boost
Adds 15% for 2H alignment, 10% for 30m, 5% for VWAP (directional).
Final Fusion
BUY_FINAL = 55% pred + 25% risk + 20% boost; normalized vs SELL counterpart. Displays blocks (🟩🟩🟩🟩=≥80%) and stars (⭐⭐⭐⭐⭐=≥85%).
HUD Layout & Usage
20-row table separates RISK MATRIX (rows 1-10) from UQ (11-18): metric | visual box/block | Chinese explanation. Perfect for silver's high-volatility scalping, balancing exhaustive risk scanning with probabilistic edge quantification. Ready in both English and Chinese
在腳本中搜尋"VC+投资动态"

Vc trend analysisCan be used to find the direction of a trend
Determination of support and resistance levels
In combination, it can assess the short and long term
Main functions
Trend Short Perspective - Shows the trend at short distances.
Main Market Trend - Reflects the main market trend, can be used as a signal.
Intermediate Moving Average - Typically the last support line in an uptrend
The buyback zone is a basic and strong support level
Swing - displays the long-term direction. Also used as a deeper retracement level

UtilsLibrary "Utils"
Utility functions. Mathematics, colors, and auxiliary algorithms.
setTheme(vc, theme)
Set theme for levels (predefined colors).
Parameters:
vc : (valueColorSpectrum) Object to associate a color with a value, taking into account the previous value and its levels.
theme : (int) Theme (predefined colors).
0 = 'User defined'
1 = 'Spectrum Blue-Green-Red'
2 = 'Monokai'
3 = 'Green'
4 = 'Purple'
5 = 'Blue'
6 = 'Red'
Returns: (void)
setTheme(vc, colorLevel_Lv1, colorLevel_Lv1_Lv2, colorLevel_Lv2_Lv3, colorLevel_Lv3_Lv4, colorLevel_Lv4_Lv5, colorLevel_Lv5)
Set theme for levels (customized colors).
Parameters:
vc : (valueColorSpectrum) Object to associate a color with a value, taking into account the previous value and its levels
colorLevel_Lv1 : (color) Color associeted with value when below Level 1.
colorLevel_Lv1_Lv2 : (color) Color associeted with value when between Level 1 and 2.
colorLevel_Lv2_Lv3 : (color) Color associeted with value when between Level 2 and 3.
colorLevel_Lv3_Lv4 : (color) Color associeted with value when between Level 3 and 4.
colorLevel_Lv4_Lv5 : (color) Color associeted with value when between Level 4 and 5.
colorLevel_Lv5 : (color) Color associeted with value when above Level 5.
Returns: (void)
setCurrentColorValue(vc)
Set color to a current value, taking into account the previous value and its levels
Parameters:
vc : (valueColorSpectrum) Object to associate a color with a value, taking into account the previous value and its levels
Returns: (void)
setCurrentColorValue(vc, gradient)
Set color to a current value, taking into account the previous value.
Parameters:
vc : (valueColor) Object to associate a color with a value, taking into account the previous value
gradient
Returns: (void)
setCustomLevels(vc, level1, level2, level3, level4, level5)
Set boundaries for custom levels.
Parameters:
vc : (valueColorSpectrum) Object to associate a color with a value, taking into account the previous value and its levels
level1 : (float) Boundary for level 1
level2 : (float) Boundary for level 2
level3 : (float) Boundary for level 3
level4 : (float) Boundary for level 4
level5 : (float) Boundary for level 5
Returns: (void)
getPeriodicColor(originalColor, density)
Returns a periodic color. Useful for creating dotted lines for example.
Parameters:
originalColor : (color) Original color.
density : (float) Density of color. Expression used in modulo to obtain the integer remainder.
If the remainder equals zero, the color appears, otherwise it remains hidden.
Returns: (color) Periodic color.
dinamicZone(source, sampleLength, pcntAbove, pcntBelow)
Get Dynamic Zones
Parameters:
source : (float) Source
sampleLength : (int) Sample Length
pcntAbove : (float) Calculates the top of the dynamic zone, considering that the maximum values are above x% of the sample
pcntBelow : (float) Calculates the bottom of the dynamic zone, considering that the minimum values are below x% of the sample
Returns: A tuple with 3 series of values: (1) Upper Line of Dynamic Zone;
(2) Lower Line of Dynamic Zone; (3) Center of Dynamic Zone (x = 50%)
valueColorSpectrum
# Object to associate a color with a value, taking into account the previous value and its levels.
Fields:
currentValue
previousValue
level1
level2
level3
level4
level5
currentColorValue
colorLevel_Lv1
colorLevel_Lv1_Lv2
colorLevel_Lv2_Lv3
colorLevel_Lv3_Lv4
colorLevel_Lv4_Lv5
colorLevel_Lv5
theme
valueColor
# Object to associate a color with a value, taking into account the previous value
Fields:
currentValue
previousValue
currentColorValue
colorUp
colorDown

Combo The "Combo" Indicator is a visual tool for TradingView that allows traders to clearly display their analysis based on OrderBloque concepts.
Key points to understand:
The indicator does NOT perform automatic market analysis
It serves as a configurable visualization tool for your personal analysis
Key Features:
Manual Configuration: You select a timeframe and function for each variable (V1 to V4)
Function Options:
VC (Volume Confirmation)
FP (Fractal Point)
LI (Liquidity)
EX (Execution)
Combinations like VC, VC, VC (EX)
Timeframe Range: Selectable from 5 minutes to 1 month
Tabular Display: Shows your inputs in a clear table on the chart
Customizable Appearance: Adjustable table position, colors, and text size

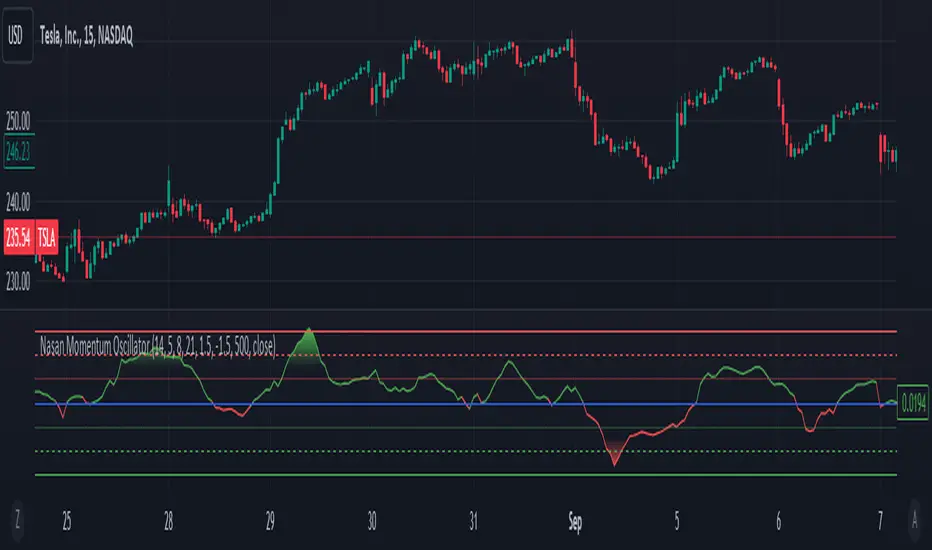
Dynamic Volume-Volatility Adjusted MomentumThis Indicator in a refinement of my earlier script PC*VC Moving average Old with easier to follow color codes, overbought and oversold zones. This script has converted the previous script into a standardized measure by converting it into Z-scores and also incorporated a volatility based dynamic length option. Below is a detailed Explanation.
The "Dynamic Volume-Volatility Adjusted Momentum" or "Nasan Momentum Oscillator" is designed to capture market momentum while accounting for volume and volatility fluctuations. It leverages the Typical Price (TP), calculated as the average of high, low, and close prices, and introduces the Price Coefficient (PC) based on deviations from the simple moving average (SMA) across various time frames. Additionally, the Volume Coefficient (VC) compares current volume to SMA, and calculates Intraday Volatility (IDV) which gauges the daily price range relative to the close. Then intraday volatility ratio is calculated ( IDV Ratio) as the ratio of current Intraday Volatility (IDV) to the average of IDV for three different length periods, which provides a relative measure of current intraday volatility compared to its recent historical average. An inter-day ATR based Relative Volatility (RV) is calculated to adjusts for changing market volatility based on which the dynamic length adjustment adapts the moving average (standard length is 14). The PC *VC/IDV Ratio integrates price, volume, and volatility information which provides a volume and volatility adjusted momentum. This volume and volatility adjusted momentum is converted into a standardized Z-Score. The Z-Score measures deviations from the mean. Color-coded plots visually represent momentum, and thresholds aid in identifying overbought or oversold conditions.
The indicator incorporates a nuanced approach to emphasize the joint impact of price and volume while considering the stabilizing effect of lower intraday volatility. Placing the volume ratio (VC) in the numerator means that higher volume positively contributes to the overall ratio, aligning with the observation that increased volumes often accompany robust price movements. Simultaneously, the decision to include the inverse of intraday volatility (1/IDV) in the denominator acts as a dampener, reducing the impact of extreme intraday volatility on the momentum indicator. This design choice aims to filter out noise, giving more weight to significant price changes supported by substantial trading activity. In essence, the indicator's design seeks to provide a more robust momentum measure that balances the influence of price, volume, and volatility in the analysis of market dynamics.
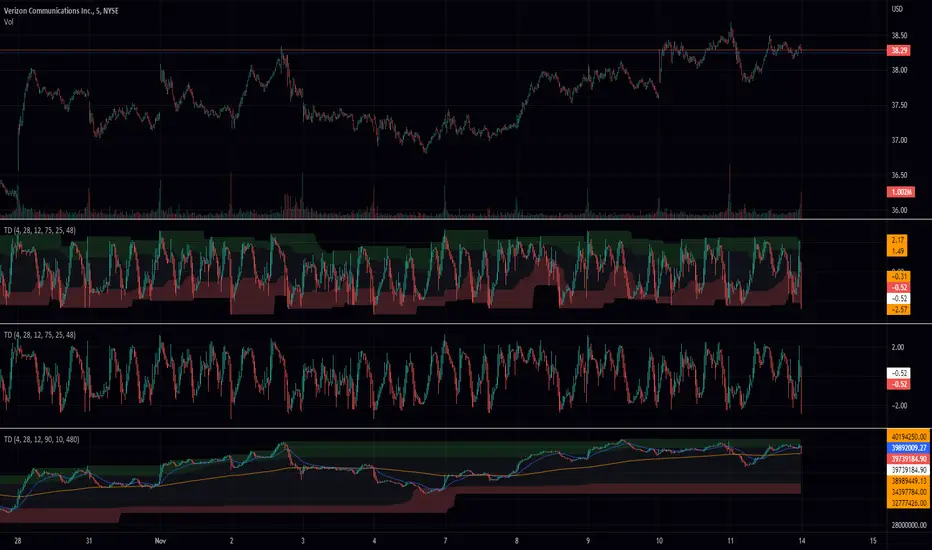
Average True Range (ATR %) Stop Loss CalculatorThis indicator takes the average of a series of ATR to calculate what I would consider an optimum stop loss placement represented in percentage (read below for full overview).
While the data is plotted what is most helpful are the actual numbers presented and for my charts I remove most of the plotting.
This indicator is most helpful on the daily timeframe but can be used for all timeframes such as the 4HR, 1HR or even 15M.
This indicator should not be used alone. It should be used in conjunction with proper price action analysis. It’s also a great indicator if you chart using Value Channels. Ideally you want your stop placement to be below at least one core Value Channel boundary range. In addition to standard support and resistance and some key moving averages the market respects. This also works best when trading with the prevailing BIAS of the instrument (bull or bear).
Cryptos: Generally, that means you’re buying on retracements that fit the end of a structured move. The other option is using this in a clear up trending market where the pull backs are clearly being supported with buying.
FOREX: I built another indicator for FOREX search: ATRPIPS with SL
WTI: Helpful but I have different rules for when I trade WTI. I rely upon VCs and diagnal VCs much more when trading this.
Equities: Helpful but with the increase of volatility as well as uncertainty of Bias of the market-- this should be used as more of a guide than
What is most important is the actual percentage numbers but I've found graphing 1-3 of the actual ATRs is helpful. The rest just uncheck the checkbox in the options.
Indicator Overview:
Value 1 - 3 Period ATR (maroon)
Value 2 - 7 Period ATR (green)
Value 3 - 30 Period ATR (blue)
Value 4 - 90 Period ATR (blue, bold)
Value 5 - 1 Period ATR (green)
Value 6 - 1 Period ATR (red)
Value 6 – Prime Stop Loss Placement (maroon). This is the average of all above ATRs multiplied by 1.5
Value 7 - Move Left (red). Experimental value. This is the difference between (prime stop loss) and 1 day period move. Two ways to use this value. Use as a tighter stop loss placement. The other option is to use as a retrace target for purchase and using the Prime Stop Placement value as you’re stop loss.
All ATRs use the LOW price of the period. After testing both the low and close I’ve settled on the low to capture the most volatility you will typically experience.
Once again, this indicator should be used in conjunction with your proven trade system.
Also, by knowing what the values are within the indicator you could just eye ball what would be the best stop placement depending on the ATR or 1 or 2 ATRs you find most represent the volatility of what you are trading.
I will be expanding on this indicator by bringing in average measured moves as well as volume analysis and most likely with color changes and modifications.
Background:
While using and refining my trade system I've noticed that most moves happen in 3 periods. So we start there. The 7 period is good for a 24 hour market such as crypto (although weekend trading can be a hit or miss) and to some extent FOREX. The longer periods of 30 & 90 are to smooth out the data set. The final value of the 1 period is to bring a little more recency to the calculation.
Why multiply the average by 1.5? I've found in my own trading and system I built to be the best placement (in conjunction with VCs) to ensure you're stop isn't to close and is within the instrument you are trading volatility .
I'm looking at making this more intelligent as well as take into account volume and structured moves.

oct25libLibrary of technical indicators for use in scripts.
1) salmav3(src, length, smooth, mult, sd_len)
Parameters:
src (float)
length (int)
smooth (simple int)
mult(float)
sd_len(int)
2) boltzman(src, length, T, alpha, smoothLen)
Parameters:
src (float)
length (int)
T(float)
Alpha(float)
smoothLen (simple int)
3) shannon(src, vol, len, bc, vc, smooth)
Parameters:
src (float)
vol (float)
len (int)
bc (bool)
vc (bool)
smooth (simple int)
4) vama(src, baseLen, volLen, beta)
Parameters:
src (float)
baseLen (int)
volLen (int)
beta (float)
5) fwma(src, period, lambda, smooth)
Parameters:
src (float)
period (int)
lambda (float)
smooth (simple int)
6) savitzky(srcc, srch, srcl, length)
Parameters:
srcc (float)
srch (float)
srcl (float)
length (int)
7) butterworth(src, length, poles, smooth)
Parameters:
src (float)
length (int)
poles (int)
smooth (simple int)
8) rti(src, trend_data_count, trend_sensitivity_percentage, midline, smooth)
Parameters:
src (float)
trend_data_count (int)
trend_sensitivity_percentage (int)
midline (int)
smooth (simple int)
9) chandemo(src, length, smooth)
Parameters:
src (float)
length (int)
smooth (simple int)
10) hsma(assetClose, length, emalen, midline)
Parameters:
assetClose (float)
length (int)
emalen (simple int)
midline (float)
11) rsi(src, rsiLengthInput, rsiemalen, midline)
Parameters:
src (float)
rsiLengthInput (simple int)
rsiemalen (simple int)
midline (float)
12) lacoca(src, lookback, malen, matype)
Parameters:
src (float)
lookback (int)
malen (simple int)
matype (string)

Z-Score Based Momentum Zones with Advanced Volatility ChannelsThe indicator "Z-Score Based Momentum Zones with Advanced Volatility Channels" combines various technical analysis components, including volatility, price changes, and volume correction, to calculate Z-Scores and determine momentum zones and provide a visual representation of price movements and volatility based on multi timeframe highest high and lowest low values.
Note: THIS IS A IMPROVEMNT OF "Multi Time Frame Composite Bands" INDICATOR OF MINE WITH MORE EMPHASIS ON MOMENTUM ZONES CALULATED BASED ON Z-SCORES
Input Options
look_back_length: This input specifies the look-back period for calculating intraday volatility. correction It is set to a default value of 5.
lookback_period: This input sets the look-back period for calculating relative price change. The default value is 5.
zscore_period: This input determines the look-back period for calculating the Z-Score. The default value is 500.
avgZscore_length: This input defines the length of the momentum block used in calculations, with a default value of 14.
include_vc: This is a boolean input that, if set to true, enables volume correction in the calculations. By default, it is set to false.
1. Volatility Bands (Composite High and Low):
Composite High and Low: These are calculated by combining different moving averages of the high prices (high) and low prices (low). Specifically:
a_high and a_low are calculated as the average of the highest (ta.highest) and lowest (ta.lowest) high and low prices over various look-back periods (5, 8, 13, 21, 34) to capture short and long-term trends.
b_high and b_low are calculated as the simple moving average (SMA) of the high and low prices over different look-back periods (5, 8, 13) to smooth out the trends.
high_c and low_c are obtained by averaging a_high with b_high and a_low with b_low respectively.
IDV Correction Calulation : In this script the Intraday Volatility (IDV) is calculated as the simple moving average (SMA) of the daily high-low price range divided by the closing price. This measures how much the price fluctuates in a given period.
Composite High and Low with Volatility: The final c_high and c_low values are obtained by adjusting high_c and low_c with the calculated intraday volatility (IDV). These values are used to create the "Composite High" and "Composite Low" plots.
Composite High and Low with Volatility Correction: The final c_high and c_low values are obtained by adjusting high_c and low_c with the calculated intraday volatility (IDV). These values are used to create the "Composite High" and "Composite Low" plots.
2. Momentum Blocks Based on Z-Score:
Relative Price Change (RPC):
The Relative Price Change (rpdev) is calculated as the difference between the current high-low-close average (hlc3) and the previous simple moving average (psma_hlc3) of the same quantity. This measures the change in price over time.
Additionally, std_hlc3 is calculated as the standard deviation of the hlc3 values over a specified look-back period. The standard deviation quantifies the dispersion or volatility in the price data.
The rpdev is then divided by the std_hlc3 to normalize the price change by the volatility. This normalization ensures that the price change is expressed in terms of standard deviations, which is a common practice in quantitative analysis.
Essentially, the rpdev represents how many standard deviations the current price is away from the previous moving average.
Volume Correction (VC): If the include_vc input is set to true, volume correction is applied by dividing the trading volume by the previous simple moving average of the volume (psma_volume). This accounts for changes in trading activity.
Volume Corrected Relative Price Change (VCRPD): The vcrpd is calculated by multiplying the rpdev by the volume correction factor (vc). This incorporates both price changes and volume data.
Z-Scores: The Z-scores are calculated by taking the difference between the vcrpd and the mean (mean_vcrpd) and then dividing it by the standard deviation (stddev_vcrpd). Z-scores measure how many standard deviations a value is away from the mean. They help identify whether a value is unusually high or low compared to its historical distribution.
Momentum Blocks: The "Momentum Blocks" are essentially derived from the Z-scores (avgZScore). The script assigns different colors to the "Fill Area" based on predefined Z-score ranges. These colored areas represent different momentum zones:
Positive Z-scores indicate bullish momentum, and different shades of green are used to fill the area.
Negative Z-scores indicate bearish momentum, and different shades of red are used.
Z-scores near zero (between -0.25 and 0.25) suggest neutrality, and a yellow color is used.

TVMC - Composite Indicator with Technical RatingsDescription:
The TVMC (Trend, Volume, Momentum, Composite) indicator is a powerful multi-component tool designed to provide traders with a comprehensive understanding of market conditions. By combining four essential technical analysis components—trend, momentum, volume, and volatility—this indicator offers clear and actionable insights to assist in decision-making.
Key Features:
1. Trend Component (TC):
* Based on MACD (Moving Average Convergence Divergence), this component analyzes the relationship between two exponential moving averages (fast and slow) to determine the prevailing market trend.
* The MACD signal is normalized to a range of -1 to +1 for consistency and clarity.
2. Momentum Component (MC):
* Utilizes RSI (Relative Strength Index) to measure the strength and speed of price movements.
* This component highlights overbought or oversold conditions, which may indicate potential market reversals.
3. Volume Confirmation (VC):
* Compares the current trading volume to its moving average over a specified period.
* High volume relative to the average confirms the validity of the current trend.
4. Volatility Filter (VF):
* Uses ATR (Average True Range) to gauge market volatility.
* Adjusts and smooths signals to reduce noise during periods of high volatility.
5. Technical Ratings Integration:
* Incorporates TradingView’s Technical Ratings, allowing users to validate signals using moving averages, oscillators, or a combination of both.
* Users can choose their preferred source of ratings for enhanced signal confirmation.
How It Works:
The TVMC indicator combines the weighted contributions of the Trend, Momentum, and Volume components, further refined by the Volatility Filter. Each component plays a specific role:
* Trend: Identifies whether the market is bullish, bearish, or neutral.
* Momentum: Highlights the strength of price action.
* Volume: Confirms whether the current price action is supported by sufficient trading activity.
* Volatility: Filters out excessive noise in volatile market conditions, providing a smoother and more reliable output.
Visualization:
1. Bullish Signals:
* The indicator line turns green and remains above the zero line, indicating upward momentum.
2. Bearish Signals:
* The indicator line turns red and falls below the zero line, signaling downward momentum.
3. Neutral Signals:
* The line is orange and stays near zero, indicating a lack of strong trend or momentum.
4. Zones:
* Horizontal lines at +30 and -30 mark strong bullish and bearish zones, respectively.
* A zero line is included for clear separation between bullish and bearish signals.
Recommended Usage:
* Best Timeframes: The indicator is optimized for higher timeframes such as 4-hour (H4) and daily (D1) charts.
* Trading Style: Suitable for swing and positional trading.
* Customization: The indicator allows users to adjust all major parameters (e.g., MACD, RSI, volume, and ATR settings) to fit their trading preferences.
Customization Options:
* Adjustable weights for Trend, Momentum, and Volume components.
* Fully configurable settings for MACD, RSI, Volume SMA, and ATR periods.
* Timeframe selection for multi-timeframe analysis.
Important Notes:
1. Originality: The TVMC indicator combines multiple analysis methods into a unique framework. It does not replicate or minimally modify existing indicators.
2. Transparency: The description is detailed enough for users to understand the methodology without requiring access to the code.
3. Clarity: The indicator is explained in a way that is accessible even to users unfamiliar with complex technical analysis tools.
Compliance with TradingView Rules:
* The indicator is written in Pine Script version 5, adhering to TradingView’s language standards.
* The description is written in English to ensure accessibility to the global community, with a clear explanation of all components and functionality.
* No promotional content, links, or unrelated references are included.
* The chart accompanying the indicator is clean and demonstrates its intended use clearly, with no additional indicators unless explicitly explained.

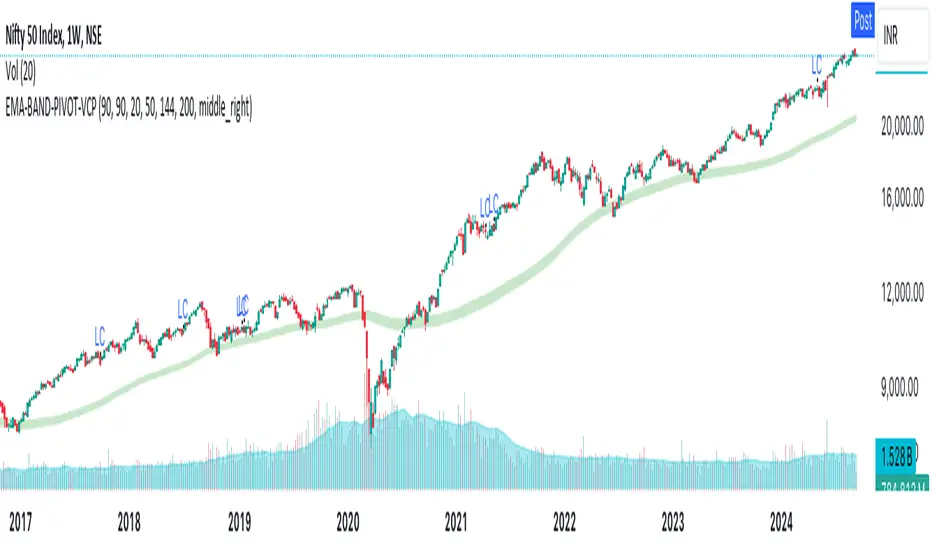
EMA-BAND-PIVOT-VCPThis indicator is named "EMA-BAND-PIVOT-VCP" and integrates multiple elements such as moving averages, volume, volatility contraction patterns (VCP), pivot points, and a table to display key market metrics.
Key Features:
Moving Averages: ( 4 - EMA) default settings 20 , 50 ,144 , 200 . Can be changed in settings.
Pivot Highs and Lows:
The script detects pivot highs and pivot lows using customizable left and right lengths and plots labels to mark these points on the chart.
TIG BAND : This is setting of 2 sma - with the high and low of 90 day average which forms like a band . Its a very strong indicator of trend . Buying is suggestable above this .This has to be tested on your own to knowhow it works wonders ( price magnet). Works on all timeframes . (credit : Bhushan Sir from TIG ) .These are the best buy areas.
Volatility Contraction :
It identifies specific price contraction pattern .
vc marked - used 4 candles - first candle is the mother bar ., 2,3 and 4th candles complete range ( high to low ) is within the range of mother candle.
lc marked -here the closing is considered not the wicks. used 8 candles., the 7 candles closing is within the range of motherbar. Crosses are plotted on the last candle
Table Display:
A table is displayed on the chart with data such as EMA values, relative volume (RVol), Average Daily Range (ADR), and volume ratios. This gives a comprehensive overview of current market conditions.(RVol) compared to the 50-period volume SMA, percentage volume change, and other metrics is also displayed.
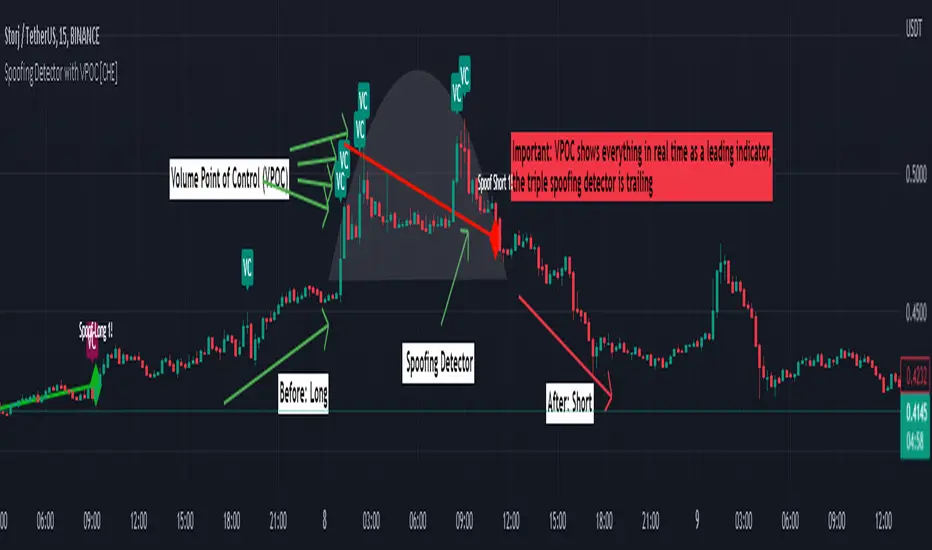
Spoofing Detector with VPOC [CHE]"We're keeping an eye on the market makers, zooming in for a closer look."
Spoofing and Volume Point of Control (VPOC) are terms used in the context of market manipulation and market analysis in financial markets.
A spoofing detector is a tool developed to detect the spoofing of orders. Spoofing refers to a practice where a market participant places large orders to deceive other market participants and influence the price of a stock. These large orders, however, are not executed but cancelled shortly after, creating a false demand for a specific stock and influencing the price. A spoofing detector can use algorithms to detect and report these practices to maintain the integrity of the market.
The Volume Point of Control (VPOC) is a concept in technical analysis aimed at identifying the key price level at which a stock was bought and sold. VPOC is calculated by analyzing the volume data of a stock and determining the price level at which the largest volume was traded for a specific period. This price level can serve as an indicator of the current market trend and market interest in a specific stock.
There is a substantive connection between a spoofing detector and VPOC because both tools can be used to gain a better understanding of the stock markets and detect potential forms of market manipulation. For example, VPOC can be used as an indicator of potential market manipulation when an abnormal distribution of trading volume is observed at a specific price level. A spoofing detector can then be used to detect and report these activities.
Pine Script Indicator Analysis:
This is a Pine Script code for a spoofing detector and volume point of control (VPOC) indicator. The purpose of the indicator is to detect and highlight potential spoofing activities in the market, as well as to plot the volume point of control on the chart.
Inputs:
Median Lookback: This input defines the length of the median calculation, with a default value of 25.
Range To Edges Threshold: This input sets a threshold value for the range to edges calculation, with a default value of 200.
Multiplier 1: This input sets a multiplier value to be used in the average true range calculation, with a default value of 0.8.
Multipler 2: This input sets a multiplier value to be used in the average true range calculation, with a default value of 2.0.
Multipler 3: This input sets a multiplier value to be used in the average true range calculation, with a default value of 3.0.
Variables:
y, x, ds, os: These are arrays and a variable used for the first part of the spoofing detection process.
y1, x1, ds1, os1: These are arrays and a variable used for the second part of the spoofing detection process.
y2, x2, ds2, os2: These are arrays and a variable used for the third part of the spoofing detection process.
Calculation:
The code starts by defining some variables, such as the bar index (n), the close price (src), and the average true range (atr) with different multipliers.
Next, the median of the close price is calculated over the lookback period specified by the "Median Lookback" input.
Then, the difference between the current median and the previous median is calculated, and the value is compared with the average true range with different multipliers to determine the state of the market (up, down, or unchanged).
The code then checks if the state has changed from the previous bar, and if so, the code performs a spoofing detection calculation.
The spoofing detection calculation involves determining the range between the first and last bar in the median calculation, and dividing it by the sum of the absolute differences calculated earlier. If the result is below the "Range To Edges Threshold" input, the code plots a line and a label on the chart indicating a potential spoofing activity.
The process is repeated for each of the three parts of the spoofing detection process.
VPOC:
The VPOC code is used to calculate the Volume Point of Control (VPOC) on a chart. The VPOC is the price level with the highest volume over a specified lookback period. The script contains several functions and inputs that allow the user to customize the calculation.
Inputs:
i_source: This input allows the user to specify the source for the VPOC price calculation. The options are the close price of the bar.
i_vpocThreshold: This input allows the user to set the threshold percentage for the VPOC highlight.
Functions:
timeStep_translate(): This function returns a string representing the time step of the lower time frame based on the current time frame of the chart.
ltfStats(): This function returns an array of the source and volume of the lower time frame.
ltfSrc, ltfVolume: This line requests the lower time frame data using the request.security_lower_tf function, with the lower time frame step calculated by the timeStep_translate() function.
maxVolume and indexOfMaxVolume: These variables store the maximum volume value and its corresponding index in the ltfVolume array.
maxVol: This variable stores the source value corresponding to the maximum volume.
vpocThresholdMet: This variable is a boolean that is true when the volume at the maximum volume price level is greater than or equal to the threshold percentage of the total volume.
vpocColor: This variable stores the color for the VPOC plot.
vh: This variable stores the highest volume in the lookback period.
plotshape(): This function plots the VPOC on the chart. The shape will be plotted only if the volume is greater than the specified threshold percentage of the highest volume in the lookback period. The shape will be labeled with the text "VC".
Overall, this script calculates the VPOC for a chart by aggregating volume data from a lower time frame and plotting a shape at the price level with the highest volume. The user can specify the source for the VPOC calculation and the threshold percentage for the VPOC highlight.
Important: VPOC shows everything in real time as a leading indicator, the triple spoofing detector is trailing
Best regards
Chervolino
Volume RSIThis is an indicator that shows the inflow and outflow of volume into a financial instrument. Volume is likely one of the most underrated source of data in trading unfortunately so there seems to be a lack of studies on it. The size of the candle is related to the strength of the move. The calculations for this are: cumulative sum of +volume if open < close OR -volume if open > close. This has been now transformed into an rsi style indicator to give a distinct advantage (or atleast thats the idea). The idea is that we take rsi of candles so we might as well take the rsi of volume candles. As far as I can tell it is faster/its own thing compared to regular rsi. I ave also added a smoothing option. Dont forget you can change the settings and you wont die. Thank you for your interest in this release I hope you find great piles of money with it.
link to the script I used to make this

Volume Candles Standardized (VCS)This is an indicator that shows the inflow and outflow of volume into a financial instrument. Volume is likely one of the most underrated source of data in trading unfortunately so there seems to be a lack of studies on it. The size of the candle is related to the strength of the move. The calculations for this are: cumulative sum of +volume if open < close OR -volume if open > close. I have added percentile bands so you know where the neutral zones and strong zones are. Interestingly you can also see what the volume is doing by watching where the neutral zone is. If the volume is in the red or green it is a strong move. This is standardized to make it more useful. Now you can see where the exhaustion points are on the short term. Dont forget you can change the settings and you wont die. Thank you for your interest in this release I hope you find great piles of money with it.

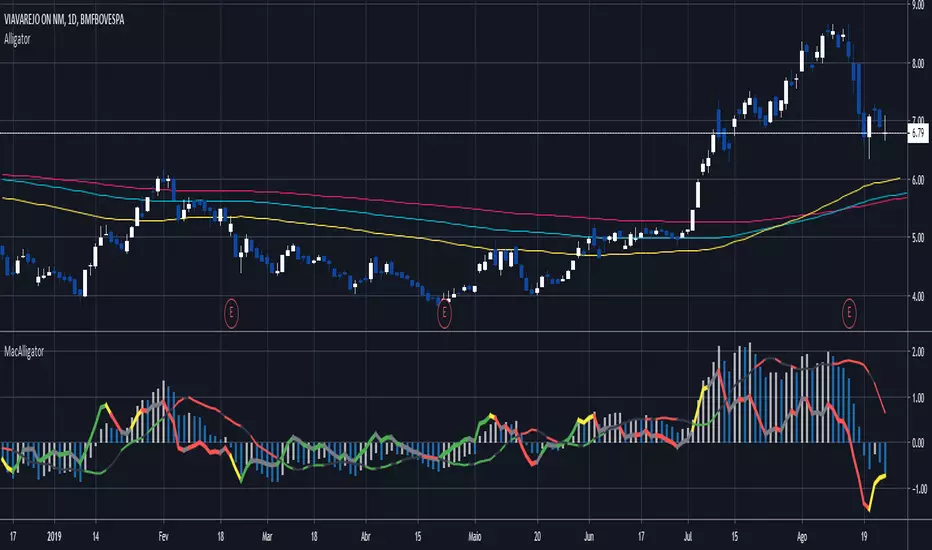
MacAlligatorO indicador é baseado nos parâmetros do Alligator de Bill Wiliams, onde o histograma mostra a diferença do preço médio em relação à mandíbula, vc consegue extrair setups como Ponto Contínuo, Breakout, Power Breakout, entre outros Ficou mais rápido do que o Awsome Oscilator. já que utiliza o pm puro ao invés da mediana entre os lábios e mandíbula.
A linha mais grossa é o acelerador, refere-se à diferença do preço médio e os lábios e com sua coloração medida pelos dentes, ficou mais ágil que o Accelerator Oscilator, já que usa o pm puro ao invés de subtrair do AO.
E a linha mais fina é por minha conta e demonstra a qualidade da tendência e divergências. 'É relativamente simples de se operar, mas precisa acostumar os olhos. Um setup simples é esperar uma boa tendência no histograma e entrar quando o acelerador voltar próximo ou menor que zero, no rompimento da máxima do candle ou abertura, dependendo da sua confiança.
Value Chart [TMC]*** April 20, 2015 - NEW UPDATE ***
Added classic color scheme and additional lines. Updated source: pastebin.com
April 10, 2015 - Updated version of Value Chart - candles draw correctly now.
Requires cover layer to be set as same color as your background. (white in default)
I hope you will enjoy it. :)
