RSI VWAP POC [Uncle Sam Trading]Category: Oscillators, Volume, Market Profile
Timeframe: Suitable for all timeframes
Markets: Crypto, Forex, Stocks, Commodities
Overview
The RSI VWAP POC indicator is a powerful and innovative oscillator that combines the Relative Strength Index (RSI), Volume-Weighted Average Price (VWAP), and Point of Control (POC) from market profile analysis. Designed to provide traders with clear, high-probability trading signals, this indicator helps you identify key market levels, spot overbought/oversold conditions, and time your entries and exits with precision. Whether you’re a day trader, swing trader, or scalper, this free tool adds significant value to your trading strategy by offering a unique blend of momentum, volume, and market profile insights.
How It Works
This indicator integrates three core components to deliver actionable insights:
RSI (Relative Strength Index): Measures momentum to identify overbought (above 70) and oversold (below 30) conditions, helping you anticipate potential reversals.
VWAP (Volume-Weighted Average Price): Calculates a volume-weighted price benchmark, which is used to compute a more accurate, volume-sensitive RSI. This ensures the indicator reflects true market dynamics.
POC (Point of Control): Derived from market profile analysis, the POC represents the price level with the highest traded volume in a session, acting as a critical support or resistance level.
The indicator plots a smoothed RSI based on VWAP, overlaid with market profile data on a user-defined higher timeframe (default: 4H). The POC is displayed as a red line, with aqua bars indicating the value area where the majority of trading volume occurred. When the RSI crosses the POC, the indicator generates clear buy and sell signals:
Strong Buy (SBU): RSI crosses above the POC in an oversold zone.
Strong Sell (SBD): RSI crosses below the POC in an overbought zone.
Additional features include:
Background colors to highlight bullish (green) or bearish (red) trends.
Shaded zones for overbought (70/60) and oversold (30/40) levels.
Customizable settings to fit your trading style and timeframe.
How This Indicator Adds Value
The RSI VWAP POC indicator offers several key benefits that enhance your trading performance:
High-Probability Signals: By combining RSI, VWAP, and POC, this indicator identifies trades at key market levels where price is likely to react, increasing your win rate.
Improved Timing: Clear buy and sell signals, such as ‘SBU’ and ‘SBD’, help you enter and exit trades at optimal points, maximizing profitability.
Risk Management: Overbought/oversold zones and trend confirmation via background colors help you avoid false signals, protecting your capital.
Versatility: Suitable for all markets (crypto, forex, stocks) and timeframes, making it a valuable tool for traders of all experience levels.
Time Efficiency: The indicator does the heavy lifting by analyzing momentum, volume, and market profile data, allowing you to focus on executing trades.
Real-World Performance Example: On a 1-hour Bitcoin chart with a 4-hour higher timeframe, this indicator identified a strong sell signal on April 6th at 12:00 ($82,000), leading to a 9% drop to $74,600. A subsequent strong buy signal on April 7th at 04:00 ($76,200) captured a 6% rise to $81,200 – a potential 25% profit with 5x leverage if exited at 5%.
How to Use
Add the Indicator: Search for “RSI VWAP POC ” in TradingView’s indicator library and add it to your chart.
Set Your Timeframe: The indicator works on any timeframe but is optimized for a 1-hour chart with a 4-hour higher timeframe (set in the settings).
Interpret Signals:
Look for ‘SBU’ (strong buy) labels when the RSI crosses above the POC in an oversold zone, indicating a potential buying opportunity.
Look for ‘SBD’ (strong sell) labels when the RSI crosses below the POC in an overbought zone, signaling a potential selling opportunity.
Use the background colors (green for bullish, red for bearish) to confirm the trend.
Combine with Your Strategy: Use the indicator alongside your existing analysis (e.g., support/resistance, candlestick patterns) for best results.
Settings and Customization
The indicator is highly customizable to suit your trading needs:
RSI Length (Default: 14): Adjust the sensitivity of the RSI. Use a shorter length (e.g., 10) for scalping, or a longer length (e.g., 20) for smoother signals.
EMA Smoothing Length (Default: 3): Smooths the RSI line. Increase to 5 or 7 for less choppy signals in volatile markets.
Higher Timeframe (Default: 240 minutes): Set to 240 (4 hours) for a 1-hour chart. Adjust based on your chart’s timeframe (e.g., 60 minutes for a 15-minute chart).
Value Area Percentage (Default: 100%): Defines the size of the value area around the POC. Lower to 70% for a tighter focus on key levels.
Overbought/Oversold Thresholds (Defaults: 70/30): Adjust these levels to match market conditions (e.g., 80/20 for trending markets).
Show POC Line (Default: True): Toggle the red POC line on or off.
Show Buy/Sell Signals: Enable ‘Show Strong Breakup Signals’ and ‘Show Strong Breakdown Signals’ to focus on high-probability trades.
Why Choose This Indicator?
The RSI VWAP POC indicator stands out by offering a unique combination of momentum, volume, and market profile analysis in a single, easy-to-use tool. It’s designed to help traders of all levels make informed decisions, reduce risk, and increase profitability. Whether you’re trading Bitcoin, forex pairs, or stocks, this indicator provides the clarity and precision you need to succeed.
在腳本中搜尋"VWAP"

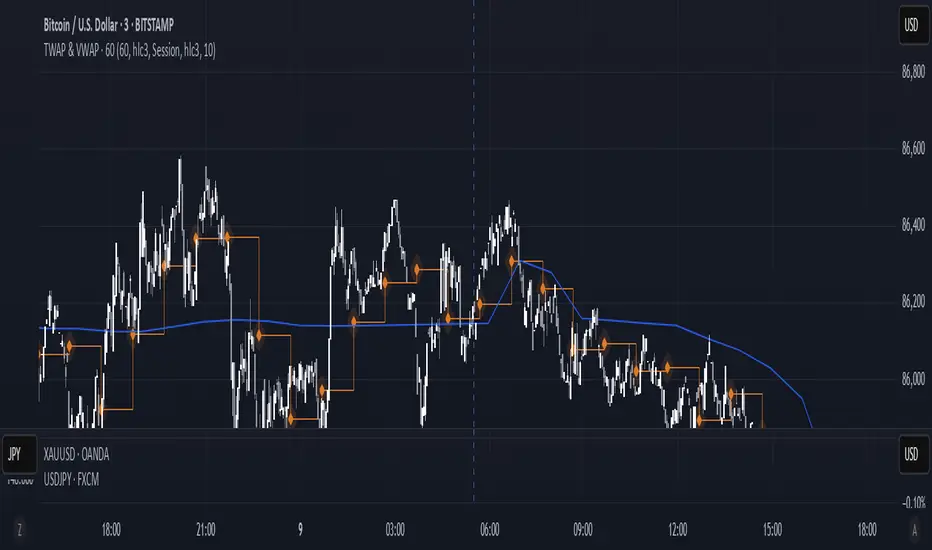
TWAP & VWAP CombinedThis script integrates Time Weighted Average Price (TWAP) and Volume Weighted Average Price (VWAP) into a single TradingView indicator, allowing traders to analyze both price-weighted and volume-weighted trends simultaneously.
Features:
TWAP Calculation:
Computes the average price over a specified anchor period (e.g., daily).
Resets and recalculates TWAP when the anchor period changes.
Uses the OHLC4 (Open, High, Low, Close average) as the default price source.
VWAP Calculation:
Computes the VWAP based on the selected anchor period (Session, Week, Month, etc.).
Allows the option to hide VWAP when the timeframe is 1D or higher.
Uses HLC3 (High, Low, Close average) as the default source.
Dynamically resets VWAP at the start of a new period.
Customization Options:
Users can modify the source price for TWAP and VWAP calculations.
Adjustable offsets for both indicators to shift plots forward or backward.
Ability to select different VWAP anchor periods, including earnings, dividends, and splits.
Error Handling:
Displays an error message if volume data is missing, ensuring VWAP functions correctly.
Salman Indicator: Multi-Purpose Price ActionSalman Indicator: Multi-Purpose Price Action Tool for Pin Bars, Breakouts, and VWAP Anchoring
This indicator provides a comprehensive suite of price action insights, designed for active traders looking to identify key market structures and potential reversals. The script incorporates a Quarterly VWAP for trend bias, marks pin bars for possible reversal points, highlights outside bars for volatility signals, and indicates simple breakouts and pivot-level breaks. Customizable settings allow for flexibility in various trading styles, with default settings optimized for daily charts.
Outside Bars : Represented by an ⤬ symbol on the chart, these indicate bars where the current high is greater than the previous bar’s high, and the low is lower than the previous bar’s low, signaling high volatility and potential market reversals.
Pin Bars : Denoted by a small dot at the top or bottom of a candle’s wick, these are crucial signals of potential reversal areas. Pin bars are identified based on the percentage length of their shadows, with adjustable strictness in settings.
Quarterly VWAP : The light blue line on the chart represents the VWAP (Volume-Weighted Average Price), which is anchored to the Quarterly period by default. The VWAP acts as a directional bias filter, helping you to determine underlying market trends. This period, source, and offset are fully adjustable in the script’s settings.
Simple Breaks : Hollow candles on the chart indicate "simple breaks," defined when the current bar closes above the previous high or below the previous low. This is an effective way to highlight directional momentum in the market.
Bonus Pivot Breaks : The tilde symbol ~ appears when the price closes above or below prior pivot high/low levels, helping traders spot significant breakout or breakdown points relative to recent pivots.
Alerts
Simple Breaks : Alerts you when a breakout occurs beyond the previous bar’s high or low. Pin Bars : Notifies you of potential reversal points as indicated by bullish or bearish pin bars. Outside Bars : Triggers an alert whenever an outside bar is detected, indicating possible volatility changes.
How to Use
VWAP for Trend Bias : Use the Quarterly VWAP line to gauge overall market trend, with settings that allow adjustment to daily, weekly, monthly, or even larger time frames.
Pin Bars for Reversal Potential : Look for the dot markers on candle wicks, where the strictness of the pin bar detection can be adjusted via settings to match your trading preference.
Simple and Pivot Breaks for Momentum : Watch for hollow candles and the tilde symbol ~ as indicators of potential breakout momentum and pivot break levels, respectively.
This script can serve traders on multiple timeframes, from daily to weekly and beyond. The flexible configuration allows for adjustments in VWAP anchoring and pin bar criteria, providing a tailored fit for individual trading strategies.

Expanding Volume Range with Anchored VWAPExpanding Volume Range with Anchored VWAP Indicator Summary
This Pine Script indicator is designed for intraday trading, particularly for timeframes of 60 minutes or less. It combines several technical analysis concepts to provide traders with a comprehensive view of price action, volume, and potential support/resistance levels.
## Key Features
1. **Anchored VWAP (Volume Weighted Average Price)**
- Calculates and displays an Anchored VWAP line
- Resets at the start of each new day or when a new highest volume bar is detected
2. **Expanding Volume Range (EVR)**
- Identifies and highlights high volume bars
- Creates a box around the price range of the last three high volume bars
- Generates additional support/resistance lines based on this range
3. **Custom Multiplier Calculations**
- Allows users to customize the calculation of support/resistance levels
- Includes options for separate top and bottom multipliers
- Provides an exponential adjustment for fine-tuning
4. **Volume-Based Candle Coloring**
- Colors candles differently based on their volume relative to recent history
- Highlights the first candle of each session in a distinct color
5. **VWAP-Based Line and Fill Colors**
- Changes colors of lines and fills based on price position relative to VWAP
6. **Alert Generation**
- Creates alerts when price breaks above or below the EVR high and low levels
## User Inputs
The indicator offers several customizable inputs grouped into categories:
1. **Volume Colors**
- Customize colors for various elements (lines, fills, candles) based on volume and VWAP relationship
2. **Target Levels**
- Set multipliers for calculating target levels
3. **Multiplier Calculations**
- Enable/disable custom multiplier calculations
- Set base multipliers and exponents for top and bottom levels
## Functionality Breakdown
1. The indicator tracks the highest volume bars for the current and previous day.
2. It creates an Expanding Volume Range (EVR) based on the last three high volume bars.
3. Using the EVR, it calculates and draws support and resistance levels.
4. The levels can be calculated using either simple multipliers or a more complex exponential formula, depending on user preference.
5. Candles are colored based on their volume and whether they're the first candle of a session.
6. An Anchored VWAP is calculated and displayed, resetting at the start of each day or on new highest volume bars.
7. Alerts are generated when price moves beyond the EVR high or low levels.
## Use Cases
This indicator can be particularly useful for:
- Identifying potential support and resistance levels based on high volume price action
- Spotting changes in volume patterns throughout the trading session
- Recognizing price action relative to the Anchored VWAP
- Setting up potential entry and exit points based on the expanding volume range
Traders should use this indicator in conjunction with other forms of analysis and risk management strategies for best results.

BabyShark VWAP Strategy What the code does:
This Pine Script implements a trading strategy based on two indicators: Volume Weighted Average Price (VWAP) and On Balance Volume (OBV) Relative Strength Index (RSI). The strategy aims to identify potential buy and sell signals based on deviations from VWAP and OBV RSI crossing certain threshold levels.
How it does it:
**VWAP Calculation**: The script calculates the VWAP using either standard deviation or average deviation over a specified length. It then plots the VWAP and its upper and lower deviation bands.
**OBV RSI Calculation**: It computes the OBV and then calculates the RSI using the cumulative changes in OBV. The RSI is plotted and compared against predefined levels.
**Table Visibility and Occurrence Counting**: It allows the user to display a table showing the number of occurrences where the price is above Upper Dev 2, below Lower Dev 2, crosses above a higher RSI level, or crosses below a lower RSI level.
**Entries**: Long and short entry conditions are defined based on the position of the price relative to the VWAP deviation bands and the color of the OBV RSI. Entries are made when specific conditions are met, and there hasn't been a recent entry.
**Exit Conditions**: The script includes stop-loss and take-profit mechanisms. It exits positions based on price crossing the VWAP or a certain percentage, and it prevents further trading after a certain number of consecutive losses.
What traders can use it for:
**Trend Identification**: Traders can use the VWAP and its deviation bands to identify potential trend reversals or continuations.
**Volume Confirmation**: The inclusion of OBV RSI provides confirmation of price movements based on volume changes.
**Entry and Exit Signals**: The script generates buy and sell signals based on the specified conditions, allowing traders to enter and exit positions with defined stop-loss and take-profit levels.
**Statistical Analysis**: The visibility of occurrence counts in the table allows traders to perform statistical analysis on the frequency of price movements relative to the VWAP and OBV RSI levels.

Multi-Time AVWAP_BEARConcept
Collaboration Highlight:
This was a collaboration with @Chart_School and @KioseffTrading Thank you to both, along with Ricardo Santos for his awesome library we used.
Overview
See how you view different time frame charts with one indicator and little to no adjustment.
Innovation:
The concept of using Anchored VWAP (AVWAP) with time events is a powerful technique in trading and technical analysis. Anchored VWAP differs from the traditional Volume Weighted Average Price (VWAP) by allowing traders to select a specific starting point or "anchor," from which the VWAP calculation begins. This approach is particularly useful for assessing price movements in relation to significant market events or specific periods of interest.
Utility and Flexibility:
Explaining the flexibility in turning on and off different time slices without much adjustment showcases a user-friendly design.
Key Uses and Benefits
Comparative Performance:
Anchoring the VWAP at the start of different time frames (e.g., weekly, monthly, quarterly) enables traders to compare the current price performance against previous periods. This comparison can highlight trends or shifts in trading momentum relative to past activity.
Support and Resistance Levels:
AVWAP lines can act as dynamic support and resistance levels. When anchored to significant time events, these levels gain additional relevance as they reflect the market's valuation of an asset since a notable point in time. Traders often watch for price interactions with these levels to make informed trading decisions.
Risk Management:
Anchored VWAP can serve as a benchmark for setting stop-loss orders or profit targets. By considering the price's relation to the AVWAP of a specific period or after a key event, traders can define exit points that are aligned with market-generated information.
Trend Confirmation: The direction and stability of the price relative to an anchored VWAP can indicate the strength of a trend. If the price consistently remains above an AVWAP anchored at a bullish event (or below for a bearish event), it may confirm the trend's continuation.
Further Reading
Educational Resource:
Becuase we are using Volume with a relation to price AVWAP is very powerful to show data that cannot be eye balled on its own. Brian Shannon's book "Maximum Trading Gains With Anchored VWAP - The Perfect Combination of Price, Time & Volume", is an excellent guide to best practices on how to use AVWAP to your advatage while trading. His book goes into depth about the best way to use this indicator to its fullest potencial.
Tips for Using This Indicator
Weekly / Monthly / Quarterly Settings:
All the settings for the lower timeframe charts are similar. Here is an example of seeing a Weekly AVWAP for 6 weeks, showing:
1. The start of the 6-week AVWAP is using a High Low Close source for the first candle of the 6 weeks.
2. The lines are colored "Red" for the AVWAPs.
3. The line thickness is "1".
Yearly Settings
Simlair to the other settings with the Yearly we give you a couple more options along with 3 years to toggle on and off. The idea was to allow the user to see which AVWAP most effected by price and quickly toggle them on and off to unclutter their chart.
Watch for how and if the labels over lap and choose the one you feel is most in play. In Shannon's Book he talks about "Hand off's" and "Pinches". These concepts are easy to spot with being able to see all the Major Time Events, then simply toggle off the one you dont need.
A great benefit to how we coded this script you can buzz through a watch list without having to re-adjust the Anchor points. This will save you time if following a basket of symbols and show coorlations in the overall market.
Secret Feature
When looking at these becuase the user doesn't need to hand plot the anchor points and we are fouced on major time slices, I encourge you to use the Trading View "Bar Replay" Feature. You think that you are missing a high or low AVWAP but what is happening is the indicator is re-plotting a level that is super hard to see, then you will see the hand-offs like Shannon discusses in his book. This blew me away while we were discussing it post development.
Conclusion
There are so many uses of how to use VWAP and therories on its best practice. We are only using "TIME EVENTS". For more ways to use AVWAP, I would encourge you to also handplot them with Trading View's new "Anchored VWAP", as seen in the standard toolbar.
Using your ideas along with this indicator i think its a powerful combination.
Also Check Out: allanster's - Anchored VWAP Pinch & Handoff, Intervals, and Signals
He has a great AVWAP script that incorporates many AVWAP ideas.

Noa: Z-distance from VWAP with Kalman Smoother
Title: Noa: Z-distance from VWAP with Kalman Smoother
Description:
The "Z-distance from VWAP with Kalman Smoother" is a tool constructed on the premise that price evolves in distinct stages: normal or extreme trends (upward or downward) and transitional periods, termed as 'flips'. The Volume Weighted Average Price (VWAP) serves as a benchmark, representing the market's expectation of a fair value over a given time frame. However, since each stock trades on its unique price scale, direct comparisons are not feasible. This script introduces a standardized method, using the Z-score from the VWAP, to understand and compare these relationships across diverse scales.
Core Principles:
Stages of Price Movement:
- Prices don't move purely randomly; while they contain a random element, they oscillate in discernible patterns or stages—either maintaining a trend (normal or extreme) or undergoing transition (flip).
- VWAP as Fair Value: VWAP offers a dynamic representation of what the market perceives as fair value for a stock over a specific period.
- Standardizing Price Relations: Given the varied scales at which different stocks trade, a model was imperative to standardize these relations. The Z-score from the VWAP fulfills this role, offering a normalized measure of how far the price deviates from its perceived fair value.
Features:
Z-score Levels:
The indicator demarcates various stages of price movements, offering clarity on potential overbought or oversold conditions.
- Extreme Up Trend: Indicated when the Z-score surpasses the upper limit.
- Normal Up Trend: Represented when the Z-score lies between the flip upper and the upper limit.
- Transition (Flip): Recognized when the Z-score oscillates within the flip range.
- Normal Down Trend: Denoted when the Z-score is between the flip lower and the lower limit.
- Extreme Down Trend: Marked when the Z-score falls below the lower limit.
Visual Aids:
- Color-coded regions between specific Z-score levels and the Z-score plot itself elucidate the current market state.
- Kalman Filter: By incorporating a Kalman filter, the indicator offers a less noisy and smoother representation of the Z-score, enhancing its interpretability.
Usage:
Trend Analysis:
- The Z-score states and the color-coded plot facilitate a nuanced understanding of the prevailing market trend.
- Potential Reversal Points: Extremely positive or negative Z-scores might hint at impending reversals.
- Buy/Sell Signals: Z-score's interactions with the flip level can be interpreted as potential trading signals.
Example (for illustration purposes only):
AAPL since April 2022: The stock exited from a normal uptrend and transitioned potentially towards a downtrend. By the end of April, AAPL flipped twice before transitioning to a normal downtrend. By early May, the stock moved into an aggressive downtrend. Market buyers were able to counter this downtrend by June, but selling pressure persisted, pushing the stock back into an aggressive downtrend. By the end of June, buyers halted the aggressive selling and transitioned the stock from an aggressive to normal downtrend, then to a flip, and finally to a normal uptrend by the end of August. AAPL briefly peaked into an aggressive uptrend before being pressured back to a normal downtrend. The rest of 2022 saw AAPL attempting several short-lived uptrend flips. However, 2023 brought a change, with AAPL flipping into a normal uptrend by the end of January, maintaining it until August of that year.
Credits:
This script, inspired by Z distance from VWAP by LazyBear and Kalman Smoother by alexgrover, was revamped and enriched by nord-ouestadvisors to embed these core principles and heighten its usability. A special acknowledgment to ChatGPT by OpenAI for the guidance.

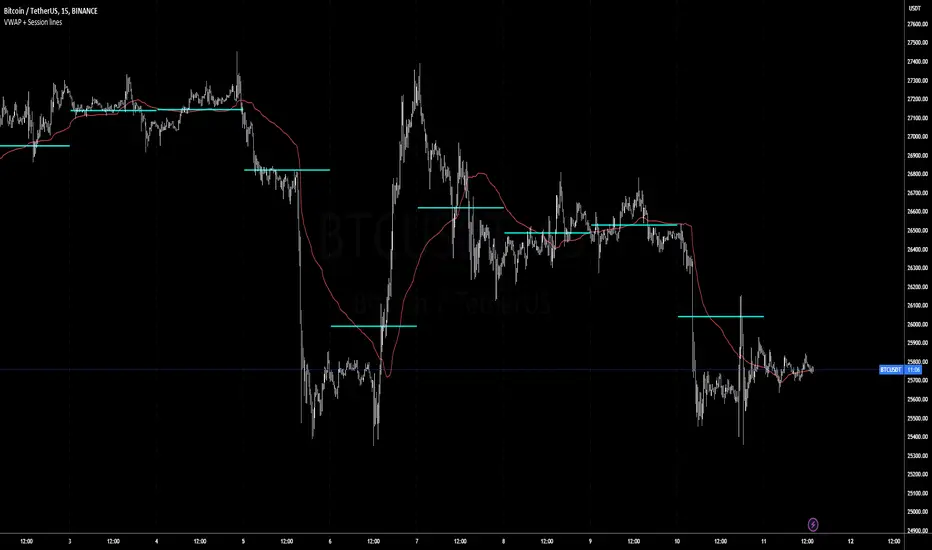
Volatility Weighted Moving Average + Session Average linesHi Traders !
Just finished my Y2 university finals exams, and thought I would cook up a quick and hopefully useful script.
VWAP + Session Average Lines :
Volatility Weighted Average Price in the standard case is a trading indicator that measures the average trading price for the user defined period, usually a standard session (D timeframe), & is used by traders as a trend confirmation tool.
This VWAP script allows for altering of the session to higher dimensions (D, W, M) or those of lower dimension (H4, or even H1 timeframes), furthermore this script allows the lookback of data to be switched from the standard session to a user defined amount of bars (e.g. the VWAP of 200 bars as opposed to the VWAP of a standard session which contains 95 bars in M15 timeframe for 24/7 traded assets e.g. BTCUSD), lastly this script plots Session VWAP Average Lines (if true in settings) so tradaes can gauge the area of highest liquidity within a session, this can be interpreted as the fair price within a session. If Average lines are increasing and decreasing consistently like a monotonic function this singles traders interest is at higher / lower prices respectively (Bullish / Bearish bias respectively ?), However if Average lines are centered around the same zones without any major fluctuations this signals a ranging market.
VWAP calculation :
VWAP is derived from the ratio of the assets value to total volume of transactions where value is the product of typical price (Average of high, low and close bars / candles) and corresponding bar volume, value can be thought of as the dollar value traded per bar.
How is VWAP used by Institutions / Market movers :
For some context and general information, VWAP is typically used by Market movers (e.g. Hedge funds, Mutual funds ,..., ...) in their trade execution, as trading at the VWAP equals the area of highest market volume, trading in line with the volume of the market reduces transaction costs by minimizing market impact (extra liquidity lowers spreads and lag time between order fills), this overall improves market efficiency.
In my opinion the script is best used with its standard settings on the M15 timeframe, note as of now the script is not functional on certain timeframes, however this script is not intended to be used in these timeframes, i will try fix this code bug as soon as possible.
Custom Weighted Moving Average with SMA, EMA, and VWAPThe Custom Weighted Moving Average with SMA, EMA, and VWAP (CWMA-SMA-EMA-VWAP) is a versatile and comprehensive trading indicator that combines the strength of Simple Moving Averages (SMAs), Exponential Moving Averages (EMAs), and the Volume Weighted Average Price (VWAP) to create a custom weighted moving average. This indicator is designed to provide a more holistic view of the market and enhance trading decisions by considering multiple moving average types and their respective timeframes. The indicator also highlights intersections between the custom weighted moving average and the individual SMA, EMA, and VWAP lines by changing their color to yellow, which can be used as potential entry or exit signals.
How to Use:
The CWMA-SMA-EMA-VWAP indicator can be used in various ways to make informed trading decisions. Here are some possible strategies:
Trend Identification: The custom weighted moving average (CWMA) can act as a dynamic support and resistance level, smoothing out the price movements and revealing the underlying trend. When the price is above the CWMA, it may indicate an uptrend, and when it's below, a downtrend. Traders can use this information to align their trades with the prevailing market trend.
Crossovers: The intersections between the CWMA and individual SMA, EMA, and VWAP lines are highlighted in yellow, which can serve as potential entry or exit signals. For instance, when the price or one of the moving averages crosses above the CWMA, it may signal a bullish trend, and traders could consider entering a long position. Conversely, when the price or one of the moving averages crosses below the CWMA, it may signal a bearish trend, and traders could consider entering a short position.
Confirmation of Signals: The CWMA-SMA-EMA-VWAP indicator can be used in conjunction with other technical analysis tools to confirm or strengthen trading signals. For example, traders may use oscillators like the RSI or MACD to confirm overbought or oversold conditions and identify potential reversals in tandem with the CWMA-SMA-EMA-VWAP crossovers.
Stop Loss and Take Profit Levels: The CWMA, SMAs, EMAs, and VWAP lines can serve as dynamic support and resistance levels, helping traders set stop loss and take profit targets. For example, a trader might set a stop loss below the CWMA during an uptrend or above the CWMA during a downtrend. Similarly, they might set take profit targets near significant SMA or EMA levels, anticipating that the price may reverse or consolidate at these points.
It's important to note that the CWMA-SMA-EMA-VWAP indicator, like any other technical analysis tool, should not be used in isolation. Combining it with other technical analysis methods, proper risk management, and a well-defined trading plan will increase the chances of success in the market. Additionally, traders should backtest and validate any strategy using historical data before applying it to real-world trading.

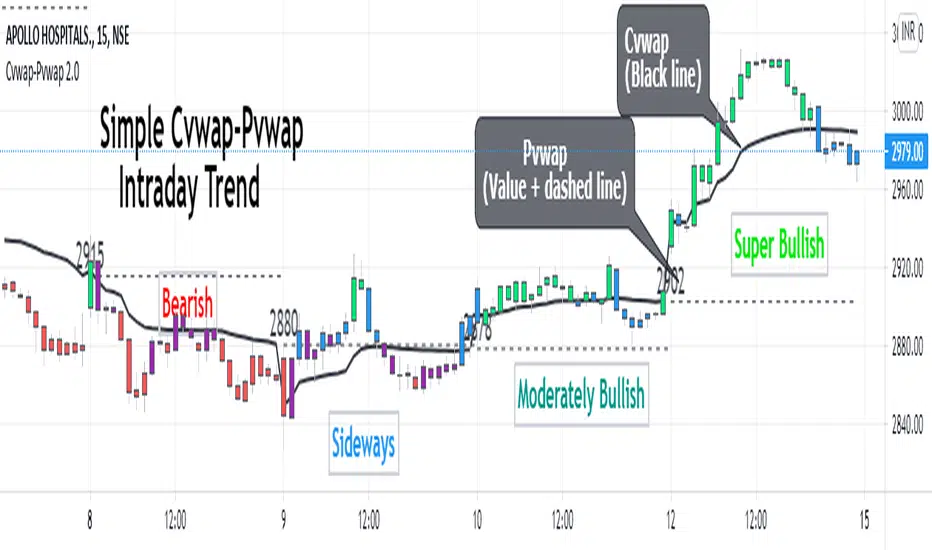
Cvwap-Pvwap 2.0A simple vwap based Intraday trend indicator.
Volume-Weighted Average Price (VWAP) - the average price weighted by volume, starts when trading opens and ends when it closes. This can help institutions buy or sell in large orders, without disturbing the market.
After buying or selling, institutions compare instrument price to closing VWAP values at end of the day.
For big financial institutions;
A buy order executed below the VWAP value, considered a good fill because the security was bought at a below average price.
A sell order executed above the VWAP would be deemed a good fill because it was sold at an above average price.
Simple price based moving average is not helpful for them; = as it doesn't incorporates volume traded. Hence - VWAP :)
So how it helps us in decoding the IntraDay-trend? - Through a 2 day vwap co-relation.
So, Closing value of previous day vwap = Pvwap
Today's running vwap = Cvwap
Defining the IntraDay Trend:
Moderately Bullish = candle closing price above Pvwap but below Cvwap
Super Bullish = Closing price is above both (Cvwap and Pvwap)
Moderately Bearish = Closing price is above Cvwap but below Pvwap
Super Bearish = Closing Price is below both (Cvwap and Pvwap)
A big gap between the Cvwap and the candle closing price defines the strong participation from institutions in that direction. (Strong Trend)
Moving with the smart money, in the overall trend is a wise decision for any intraday trader and this helps at its best.
RSI of VWAP [SHORT selling]This is SHORT selling version of RSIofVWAP strategy. Settings and Logic are totally different from LONG side version , hence I am publishing it as a new strategy.
Settings
============
VWAP of RSI Length 15
Slow EMA Length 200
Short entry level 25
Cover short level 70
stop loss 5
SHORT Entry
============
condition1 : When RSIofVWAP crossdown below 25 and VWAP is below ema200
condition2: When weekly RSIofVWAP crossdown 70 and VWAP (note : session vwap , not weekly vwap) is below ema200
condition3: Use VIX value , if you want to short when the price is above ema200
vwap RSI crossing down 70 and VIX RSI is cossing up 70
enter short ... This is like falling knife :-)
I need to add the code -- later
if any of above condition is TRUE , SHORT entry will be taken
Take Profit
============
When close less than short entry price and RSIofVWAp is crossing up 25 , take profit ...close 1/3 of the position
Exit
============
When RSIofVWAP crossing up 70 level
Stop Loss
============
Stop Loss is set to 5%
Note:
1. When strategy is in SHORT position , background and bar color changes to gray
2. When strategy is already in short position , possible entries are shown in yellow background
3. RSI Length 15 is working most of the equities on hourly chart. ( RSI length 9 and 14 also works good , but not for all ... You may want to try which setting works for your symbol)
4. weekly VWAP (blue color) is also plotted by default ... you can disable it if you dont want to see it. But there is advantage keeping it on the chart , you can notice whenever weekly VWAP crosses above 70 line , trend is UP ... if you have LONG position you can hold on it ... Hurray :-)
Warning
============
For the educational purposes only

FAIRPRICE_VWAP_RDFAIRPRICE_VWAP_RD
This script plots an **anchored VWAP (Volume Weighted Average Price)** that resets
based on the user-selected anchor period. It acts as a dynamic “fair value” line
that reflects where the market has actually transacted during the chosen period.
FEATURES
- Multiple anchor options: Session, Week, Month, Quarter, Year, Decade, Century,
Earnings, Dividends, or Splits.
- Intelligent handling of the “Session” anchor so it works correctly on both 1m
(resets each new day) and 1D (continuous, non-resetting VWAP).
- Manual VWAP calculation using cumulative(price * volume) and cumulative(volume),
ensuring the line is stable and works on all timeframes.
- Optional hiding of VWAP on daily or higher charts.
- Offset input for horizontal shifting if desired.
- VWAP provides a true “fair price” reference for trend, mean-reversion,
and institutional-level analysis.
PURPOSE
This indicator solves the common problem of VWAP behaving incorrectly on higher
timeframes, on synthetic data, or with unusual anchors. By implementing VWAP
manually and allowing flexible reset conditions, it functions reliably as
an institutional-style fair value benchmark across any timeframe.

DeltaATR + VWAP DIF + MA'sI attempted to create an indicator using a different approach to analyzing potential trend reversals, and although it is still a work in progress, it is already fully functional. The indicator combines the price relative to VWAP with ATR normalization, providing a way to measure deviations in terms of market volatility.
How the indicator works:
Delta Calculation:
The core of the indicator calculates the difference between the current price and the VWAP (Volume Weighted Average Price), then normalizes this difference by the ATR (Average True Range). This provides a volatility-adjusted measure of how far the price has moved relative to its typical range.
Histogram Visualization:
The deltaATR is displayed as a histogram, where positive values indicate the price is above VWAP and negative values indicate it is below. The histogram is color-coded for easy interpretation: typically red for above VWAP and green for below, with configurable transparency.
Dual Moving Averages:
Two moving averages (fast and slow) are applied to the deltaATR. This creates a crossover system:
When the fast average crosses above the slow average, it may indicate an upcoming bullish reversal.
When the fast average crosses below the slow average, it may indicate a potential bearish reversal.
Zero Line Reference:
A reference line at zero corresponds to VWAP, helping traders see whether price is generally above or below the average volume-weighted level.
Alert Lines (Optional Panel):
A second panel provides four configurable alert lines, allowing users to set key thresholds to monitor extreme deltaATR values. These lines are thin, dashed, and fully customizable in terms of color and thickness.
Panel for Values and Signals:
The indicator includes a side panel showing:
Current deltaATR
Fast and slow averages
Current trend signal (Bullish, Bearish, or Neutral)
How it can be used:
Identify potential trend reversals by monitoring the crossover between the fast and slow averages of deltaATR.
Use the histogram to observe when the price is deviating significantly from VWAP in terms of ATR.
Set alert lines for specific thresholds to highlight overextended conditions or significant volatility moves.
Combine with other technical indicators for confirmation before entering or exiting trades.
This indicator is particularly useful for traders looking to anticipate reversals in volatile markets, as it adapts the delta measure to the current market conditions using ATR normalization, making it more responsive and robust than raw price deviations alone.

Moving Aaverage (EMA) & VWAP by Vish
Multi-Timeframe Moving Averages with VWAP
This indicator combines essential moving averages with VWAP to provide comprehensive trend analysis on a single chart. Designed for traders who need quick visual reference of multiple timeframes and volume-weighted price levels.
Features:
• Six customizable moving averages: 8, 13, 21, 50, 100, and 200 periods
• Toggle between Simple Moving Average (SMA) and Exponential Moving Average (EMA) for all lines
• Individual on/off controls for each moving average
• Volume Weighted Average Price (VWAP) with customizable settings
• VWAP anchor options: Session, Week, Month, Quarter, and Year
• Clean, color-coded visualization for easy identification
• Fully customizable through settings panel
Use Cases:
• Identify trend direction across multiple timeframes
• Find dynamic support and resistance levels
• Spot potential entry and exit points
• Analyze price action relative to volume-weighted average
• Confirm trend strength with multiple MA convergence/divergence
Settings:
All parameters are adjustable including MA type (SMA/EMA), individual MA visibility, VWAP source, and VWAP anchor period.
Suitable for all markets and timeframes. Works on stocks, forex, crypto, commodities, and indices.
#moving average #MA #EMA #SMA #VWAP #trend #support #resistance #multi-timeframe

day trading check indicatorDay Trading Check Indicator
By Trades per Minute · Creator: Trader Malik
Overview
The Day Trading Check Indicator is an on‐chart status panel that gives you a quick “go/no-go” snapshot of four key metrics—MACD, VWAP, Float, and Bearish Sell-Off—directly in TradingView’s top-right corner. It’s designed for fast decision-making during high-velocity intraday sessions, letting you instantly see whether each metric is “bullish” (green) or “bearish” (red), plus live float data.
What It Shows
Column Description
Metric The name of each metric: MACD, VWAP, Float, Bearish Sell-Off
Status/Value A color-coded status (“GREEN”/“RED” or “YES”/“NO”) or the float value formatted in K/M/B
Metrics & Calculations
MACD (1-Minute)
Calculation: Standard MACD using EMA (12) – EMA (26) with a 9-period signal line, all fetched from the 1-minute timeframe via request.security().
Status:
GREEN if MACD ≥ Signal
RED if MACD < Signal
VWAP (Session-Anchored)
Calculation: Built-in session VWAP (ta.vwap(close)) resets each new trading session.
Status:
GREEN if current price ≥ VWAP
RED if current price < VWAP
Float
Calculation: Retrieves syminfo.shares_outstanding_float (total float), then scales it into thousands (K), millions (M), or billions (B), e.g. “12.3 M.”
Display: Always shown as the absolute float value, white on semi-transparent black.
Bearish Sell-Off
Calculation: Checks the last five 1-minute bars for any “high-volume down” candle (volume above its 20-bar SMA and close < open).
Status:
YES if at least one such bar occurred in the past 5 minutes
NO otherwise
Key Features
Dynamic Table: Automatically shows only the metrics you enable via the Display Options group.
Size Selector: Choose Small, Medium, or Large text for easy visibility.
Clean Styling: Distinct header row with custom background, consistent row shading, centered status text, and a subtle gray border.
Lightweight Overlay: No cluttering plots—just a concise status panel in the corner.
Published by Trader Malik / Trades per Minute
Version: Pine Script v5

EMA 9/21/50 + VWAP + MACD + RSI Pro [v6]Overview:
A powerful multi-indicator tool combining Exponential Moving Averages (EMA 9, 21, 50), Volume-Weighted Average Price (VWAP), Moving Average Convergence Divergence (MACD), and Relative Strength Index (RSI) into a single, easy-to-read system. Designed for traders who want a clean, all-in-one dashboard for trend analysis, momentum confirmation, and overbought/oversold conditions.
Key Features:
1. Triple EMA System (9, 21, 50)
Identifies short-term and medium-term trends.
Bullish Signal: EMA 9 > EMA 21 > EMA 50 (Green Highlight)
Bearish Signal: EMA 9 < EMA 21 < EMA 50 (Red Highlight)
Helps confirm trend direction and potential reversals.
2. VWAP (Volume-Weighted Average Price)
Tracks intraday fair value price based on volume.
Bullish: Price above VWAP (Green)
Bearish: Price below VWAP (Red)
3. MACD (Standard 12, 26, 9 Settings)
Shows momentum shifts.
Bullish: MACD line > Signal line (Green)
Bearish: MACD line < Signal line (Red)
Histogram confirms strength of momentum.
4. RSI (14-Period Default)
Identifies overbought (>70) and oversold (<30) conditions.
Red: Overbought (Potential Reversal)
Green: Oversold (Potential Bounce)
5. Signal Dashboard (Top-Right Table)
Real-time summary of all indicators in one place.
Color-coded for quick interpretation (Green = Bullish, Red = Bearish).
How to Use This Indicator?
✅ Trend Confirmation:
Trade in the direction of EMA alignment (9 > 21 > 50 for uptrends).
Use VWAP as dynamic support/resistance.
✅ Momentum Entries:
Look for MACD crossovers while RSI is not extreme.
Avoid buying when RSI > 70 or selling when RSI < 30 (unless strong trend).
✅ Mean Reversion:
Fade extreme RSI readings (overbought/oversold) when price is at key levels.
Who Is This For?
✔ Swing Traders – EMA + MACD combo for trend-following.
✔ Day Traders – VWAP + EMA for intraday bias.
✔ RSI Traders – Clear overbought/oversold signals.
Settings Customization:
Adjust EMA lengths, RSI periods, and MACD settings as needed.
Toggle VWAP visibility on/off.
Why Use This Script?
📌 All-in-One: No need for multiple indicators cluttering your chart.
📌 Visual Clarity: Color-coded signals for quick decision-making.
📌 Flexible: Works on any timeframe (1M, 5M, 1H, Daily, etc.).
Install now and enhance your trading strategy with a professional-grade multi-indicator system!
Not a financial advice. Use at your own discretion and always apply risk management

NIFTY VWAP DistanceNIFTY Futures VWAP Distance Indicator
Track price deviation from Volume-Weighted Average Price in real-time
📈 Key Features:
Measures absolute (points) and percentage distance from VWAP
Daily session reset aligned with NSE trading hours
Dual-axis visualization with clear zero reference line
Real-time data table display for instant analysis
Typical price calculation: (H+L+C)/3 formula
Built-in safeguards against division errors
🎯 Ideal For:
Intraday traders monitoring mean reversion opportunities
Algorithmic traders needing VWAP deviation metrics
Swing traders identifying overextended price moves
Market profile analysts studying auction theory
📊 How to Use:
Apply to NIFTY Futures chart (1m-1h timeframes recommended)
Blue line = Points above/below VWAP
Red line = Percentage deviation
Positive values = Price > VWAP (bullish territory)
Negative values = Price < VWAP (bearish territory)
💡 Pro Tips:
Combine with volume profile for confirmation
Watch for >1% deviations for potential reversals
Use divergence patterns for early trend change signals
Works best with raw futures data (not continuous contracts)
🔧 Technical Specs:
Pine Script v5+
No repainting
Low latency calculations
Mobile-friendly display
"Know when price strays too far from fair value"

Matrix Series and Vix Fix with VWAP CCI and QQE SignalsMatrix Series and Vix Fix with VWAP CCI and QQE Signals
Short Title: Advanced Matrix
Purpose
This Pine Script combines multiple technical analysis tools to create a comprehensive trading indicator. It incorporates elements like support/resistance zones, overbought/oversold conditions, Williams Vix Fix, QQE (Quantitative Qualitative Estimation) signals, VWAP CCI signals, and a 200-period SMA for trend filtering. The goal is to provide actionable buy and sell signals with enhanced visualization.
Key Features and Components
1. Matrix Series
Smoothing Input: Allows customization of EMA smoothing for the indicator (default: 5).
Support/Resistance Zones: Based on CCI (Commodity Channel Index) values.
Dynamic zones calculated with customizable parameters (SupResPeriod, SupResPercentage, PricePeriod).
Candlestick Visualization: Custom candlestick plots with colors indicating trends.
Dynamic levels for overbought/oversold conditions.
2. Overbought/Oversold Signals
Overbought and oversold levels are adjustable (ob and os).
Plots circles on the chart to highlight extreme conditions.
3. Williams Vix Fix
Identifies potential reversal points by analyzing volatility.
Uses Bollinger Bands and percentile thresholds to detect high-probability entries.
Includes two alert levels (alert1 and alert2) with customizable criteria for signal filtering.
4. QQE Signals
Based on the smoothed RSI and QQE methodology.
Detects trend changes using adaptive ATR bands (FastAtrRsiTL).
Plots long and short signals when specific conditions are met.
5. VWAP CCI Signals
Combines VWAP and CCI for additional trade signals.
Detects crossovers and crossunders of CCI levels (-200 and 200) to generate long and short signals.
6. 200 SMA
A 200-period simple moving average is plotted to act as a trend filter.
The script rules recommend buying only when the price is above the SMA200.
Customizable Inputs
General:
Smoothing, support/resistance periods, overbought/oversold levels.
Williams Vix Fix:
Lookback periods, Bollinger Band settings, percentile thresholds.
QQE:
RSI length, smoothing factor, QQE factor, and threshold values.
VWAP CCI:
Length for calculating deviations.
Visual Elements
Dynamic candlestick colors to indicate trend direction.
Overbought/oversold circles for extreme price levels.
Resistance and support lines.
Labels and shapes for buy/sell signals from Vix Fix, QQE, and VWAP CCI.
Alerts
Alerts are configured for the Matrix Series (e.g., "BUY MATRIX") and other components, ensuring traders are notified when significant conditions are met.
Intended Use
This indicator is designed for traders seeking a multi-faceted tool to analyze market trends, identify potential reversal points, and generate actionable trading signals. It combines traditional indicators with advanced techniques for comprehensive market analysis.

Previous Day Close and Average VWAP value, Current Day 30 min HLThe code provided is a TradingView Pine Script that creates a combined indicator consisting of two separate components:
Indicator 1: Plot Lines with VWAP
This component plots lines on the chart using two different colors and widths.
It uses a custom function f_newLine to create a new line object with a specified color and width.
It uses another custom function f_moveLine to move a line to a specific location on the chart.
The line_close line is moved to a specific date and closing price.
The line_vwap line represents the VWAP (Volume Weighted Average Price) and is plotted using the line.new function.
The VWAP calculation is performed using the typical price (average of high, low, and close) and volume.
The VWAP is plotted on the chart using the plot function.
The previous day's VWAP is also plotted and connected to the current day's VWAP with a line.
Indicator 2: 30 Min high and low breakout
This component identifies a specific time range ("0915-0945") within each trading day.
It uses the ta.valuewhen function to find the highest and lowest prices during that time range.
The highest price is stored in the high_thirtymin variable, and the lowest price is stored in the low_thirtymin variable.
These prices are plotted on the chart as circles, with green representing the high and red representing the low.
The indicator combines these two components to provide visual information about the VWAP and the high/low breakout within a specific time range. The code also includes some additional logic to handle barstate and ensure correct calculations and plotting.
SPY VWAPSPY VWAP adds the VWAP indicator for SPY on your current chart, and shows the current SPY VWAP level converted to ES / MES value. It uses the last close price of SPY and ES / MES to calculate the level.
By adding the regular VWAP indicator to your MES / ES chart, you will clearly see the difference between the VWAP of SPY and the futures chart. This is helpful when trading as price may respect both VWAP levels.
This indicator should only be used on ES and MES futures chart. It will behave weirdly if used on different tickers and it is not supported in the current version.

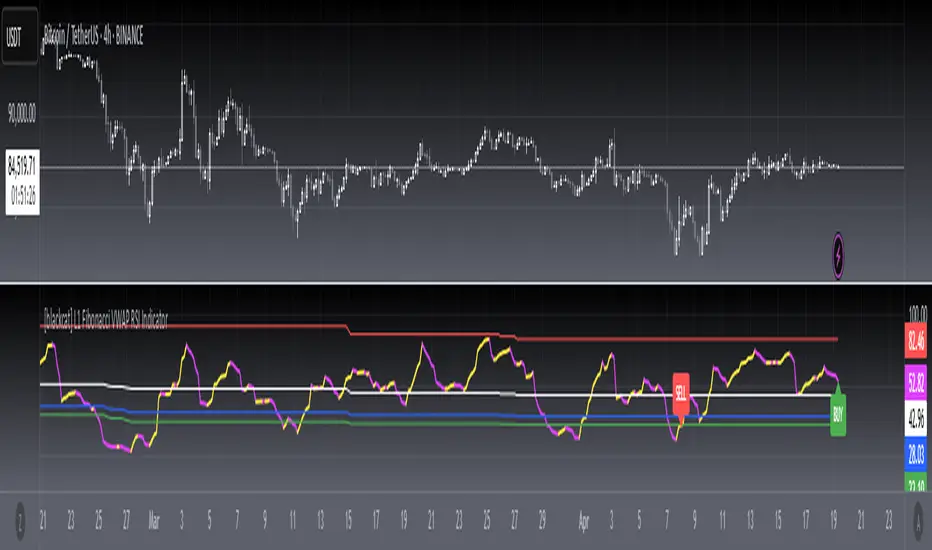
[blackcat] L1 Fibonacci VWAP RSI IndicatorLevel: 1
Background
Ingo Bucher proposed "Fibonacci RSI" in March,2003. It describes the advantages of considering Fibonacci retracement levels for use with the classic RSI indicator. Bucher reviews six charts, each displaying Fibonacci retracement levels for the RSI associated with each chart. The pine code given here will allow you to automatically recreate these charts for any security available in Tradingview. BTW, i enhanced it by changing RSI into VWAP RSI with hl2.
Function
For this Fib VWAP RSI indicator, it also applicable for original Bucher's fib concept. Bucher calculated his retracement levels by picking the RSI high and low for a given time window. In his examples, these were generally six months to a year's worth of data. Once the high and low were picked, he calculated retracement levels based on the well-known Fibonacci numbers (23.6%, 38.2%, 50%, 61.8%). This script here does the same thing. I use a "LookbackLength" (default: 400 bars), which represents a sliding data window that is used to determine the VWAP RSI high and low. The second input value controls the VWAP RSI period (default: 14 bars). The next three inputs select the retracement levels.
A total of eight different lines need to be drawn: the RSI itself, the 50% line, two retracements above the 50% point, two retracements below, and the zero and 100% lines. Pine script will create four plotlines per indicator, so I advise inserting the Fibonacci RSI twice. The first time it is inserted, leave the PlotRSI input with its default value, true. True tells pine script to plot the VWAP RSI itself. The second copy should have the input "Plot RSI" set to false. This will put the 50% line on your chart.
Inputs
LookbackLength --> Look Back Length.
RSILength --> RSI Length.
Fib1 and Fib2 --> Fibonacci lengths.
Key Signal
RawVWAPRSI --> Raw VWAP RSI output signal
Remarks
This is a Level 1 free and open source indicator.
Feedbacks are appreciated.
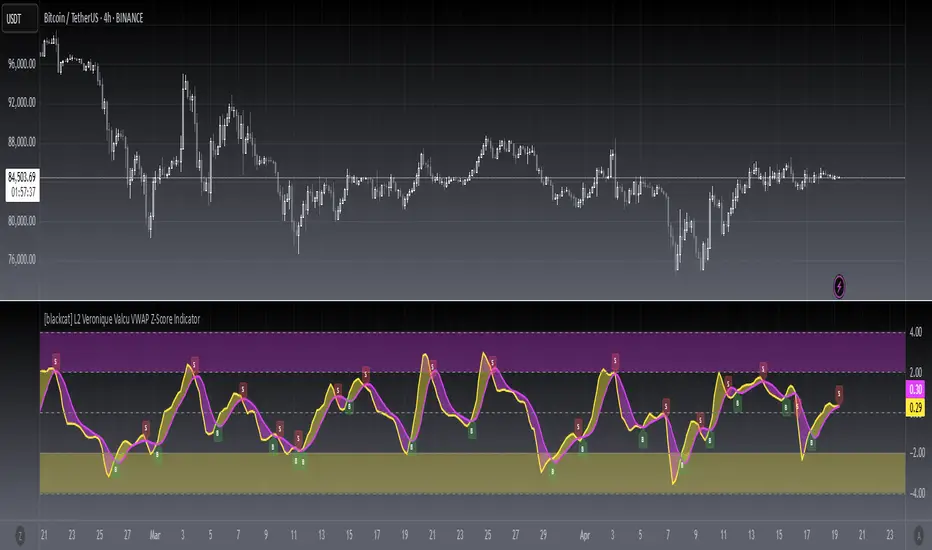
[blackcat] L2 Veronique Valcu VWAP Z-Score IndicatorLevel: 2
Background
Veronique Valcu's article "Z-Score Indicator" in Feb,2003 provided a description and commentary on a new method of displaying directional change normalized in terms of standard deviation. This indicator is realized in pine script here by using the following function code, adding vwap function, called vwap ZScore.
Function
This indicator has three input, "AvgLen", "Smooth1" and "Smooth2." Price is fixed in selected vwap price. AvgLen describes the length of the sample considered in the standard deviation calculation. Once created and verified, the function can be easily called in any indicator or strategy.
Inputs
AvgLen --> Length input for vwap Zscore.
Smooth1 and Smooth2 --> Smoothing length.
Key Signal
Curve1 --> vwap ZScore output fast signal
Curve2 --> vwap ZScore output slow signal
Remarks
This is a Level 2 free and open source indicator.
Feedbacks are appreciated.
TurboVWAPoscilOscillator based on VWAP and its standard deviations. It will display VWAP as a zero line and then an indicator line showing where price is in relation to VWAP expressed as Standard Deviation units.
This indicator is based on my awesome indicator TurboVWAP, so it shares most of its features:
- you can select whether you want a rolling or an anchored VWAP as basis.
- the VWAP will auto-set itself depending on the chart timeframe, so that it will be calculated based on the period you really want, not number of bars or similar.
- you can set the indicator to auto-set session start and end times for the session-anchored VWAP depending on the futures contract selected, so you don't need to mess with times.
