FnoPulse Volume PressureFnoPulse VP is an indicator it will show stock volatility condition. it is created based on the intraday volume movements. By using this we can detect the momentum in the stock, read on. ( we can apply this in lower timeframes like , 5min, 15min, 30min, 1hr)
FnoPulse VP has 2 main components:
Delta Volumes (Green/red area )
MA line (yellow)
How does it work?
The Delta volume bar is in green. it indicates buyers are aggressive on that stock.
The Delta volume bar is in red. it indicates seller are aggressive on that stock.
The MA line. to show the 30 candle volume average.
What are the signals?
it wont generate any signals. just it will plot the buyer and seller volumes.
Can we set the Alert on this?
No, we can not set the alert based on the buyer/seller volumes.
IMPORTANT: this script does not generate any signals. Perfectly catches long runs in trends at all underlings (stocks, indexes ) at 5 min, 15min, 30min, 1hr time frame. Lower/High period gives more incorrect signals. Don't use this in daily time frame.
Try it! Good luck and good trading!
For access, please PM us or visit the link below in our Signature.
在腳本中搜尋"Volatility"

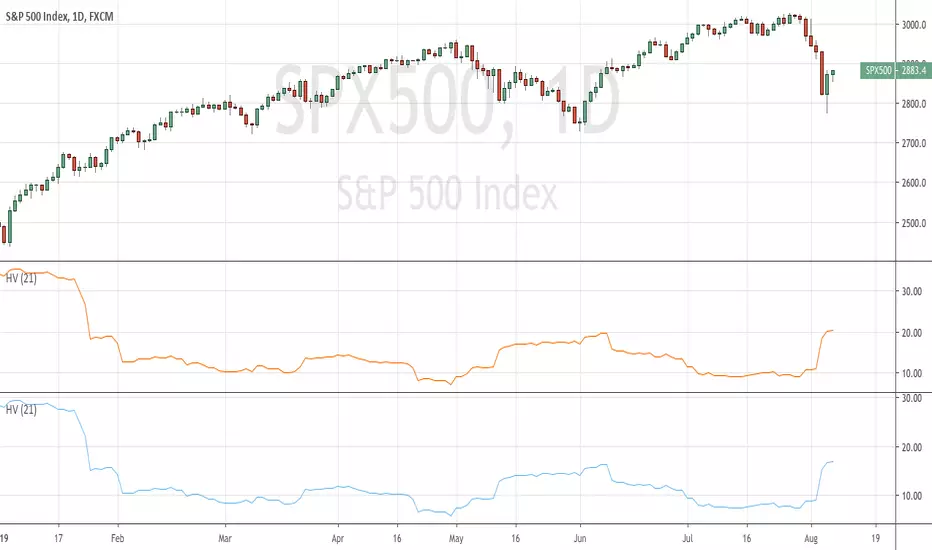
Variação, Thiago BritoIndicator to demonstrate the average percentage volatility of assets, which should be used as a measure of risk for your operations, in various graphic frequencies.
Periods:
1min = 2,700
5min = 1,080
15min = 360
60min = 180
D = 60
S = 24
M = 12

Volatilidade, Thiago BritoIndicator to demonstrate the average volatility of price shifts in assets, and should be used as a measure of risk for your operations, in various graphic frequencies.
Periods:
1min = 2,700
5min = 1,080
15min = 360
60min = 180
D = 60
S = 24
M = 12

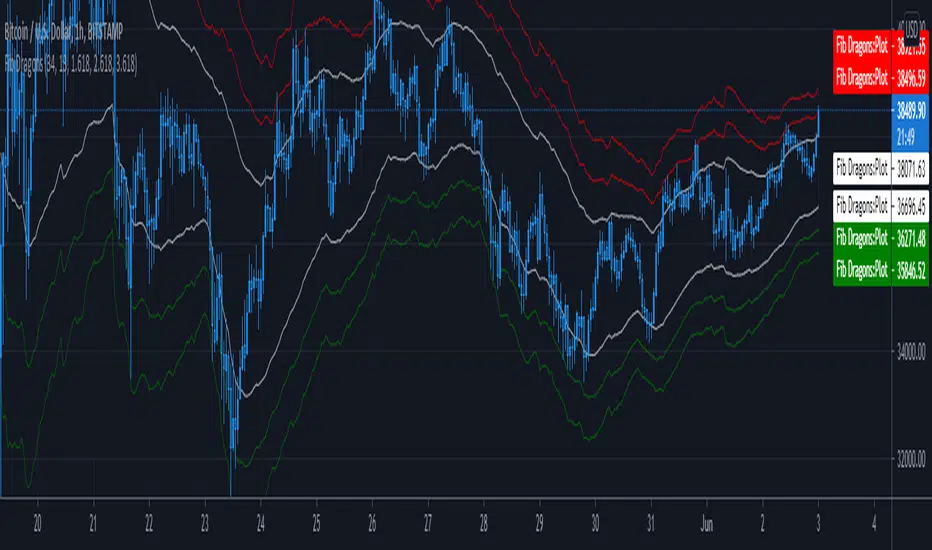
Fib DragonsCreates bands based on Fibonacci golden ratio numbers and EMA w/ATR
This allows for a faster reaction and significantly less lag than SMA w/ATR
EMA is set to 34 - Recommend range by taste 21, 34, 55, 62
ART is set to 13 - Recommend 13 or 21
Fib Bands are set to 1.618, 2.618, 3.618 however you can set to what works for you. I recommend keeping them at the golden ratios.
Based on indicator by rstraat
How to trade - Same rules apply
- Best to use in ranging market conditions
- Place on two different time frames such as the 15 min. and 60 min for intraday trading
- Take trades off either short or long term chart.
- Best trades occur when both charts show same trigger/condition.
- Trades are short term reversals in direction of major trend on longer term chart unless you expect a trend reversal.
- Determine which band is the limiting band for the volatility of the instrument.
- When the market closes outside of the limiting band then returns inside, take a long/short one tick above/below the high/low of the previous bar.
- Place stop below/above the low/high of the the recent swing low/high.
- Set targets at opposite band of chart
Use any oscillator you favor or see fit with this indicator or any other strategies that work for you.
True Range PercentageIt shows the true range/closing price percentage. With this indicator, you can infer the volatility of the market
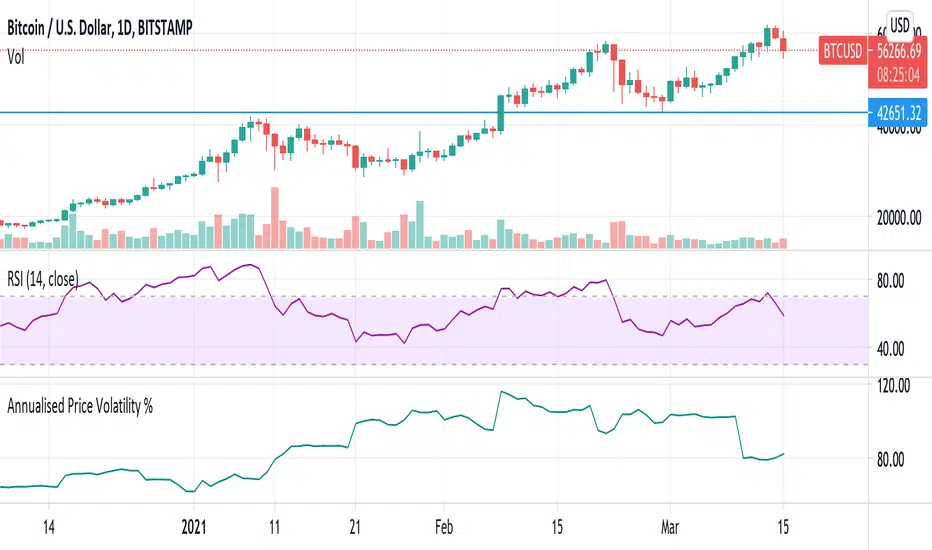
Annualised Price Volatility % CRYPTO dailiesThis is the correct annualisation for crypto currencies (continually traded). It is the rolling 1m vol using 30 days (instead of 25) and an annualisation factor of sqrt(365) not sqrt(252).
[BMAX] Daily Gaps(ENGLISH)
This indicator was built to allow traders to observe the open gaps between sessions in the Market. It can be used either on daily or weekly timeframes. Also it incluses a standard deviation band (such as bollinger band) in order to verify the gaps variance. This indicator can be used to check what is the variance on the session open gaps and prepare to protect the positions against market volatility when swing or position trading.
(PORTUGUÊS)
Este indicador foi construído para permitir que traders observem os gaps de abertura de seção no Mercado. Ele pode ser utilizado no tempo gráfico Diário ou Semanal. Também inclui uma banda de desvio padrão (assim como usado nas Bandas de Bolinger) que permite verifcar a variância dos gaps. Este indicador pode ser usado para se preparar para proteger uma posição em swing ou position trading onde o mercado pode abrir com forte gap em situações de alta volatilidade.

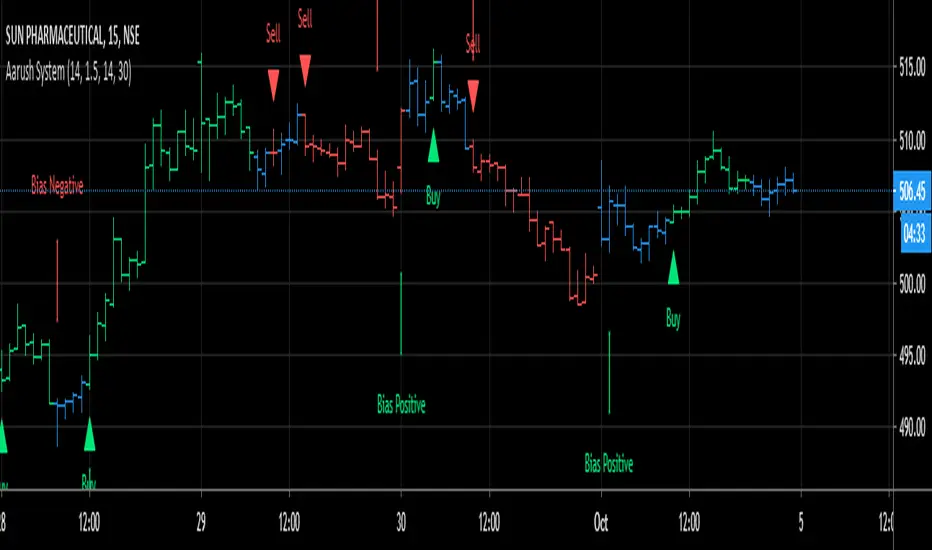
Aarush SystemThis is my System based on Volatility and a Floating Level RSI. An Indication is provided when the Bias / Sentiment turns positive or Negative. The Chart Bars are colored green when the stock is strong and Red when the stock is weak. Side ways moves are colored in Blue. No action is taken when the bars blue. Long entry is taken when the color changes to green and short entry when the color turns red. exit of positions can be taken when the bias turns to opposite side or bars turn the opposite color depending on the risk appetite.
LT Regression ChannelThis is a volatility and channel-based indicator which utilises recognised Linear Regression mathematical techniques. In using Linear Regression, the Indicator automatically calculates the best fit straight line to the symbol’s price data, and plots the regression channel on the chart.
The LT Regression channel makes things easier for chartists because it automatically calculates how and where the regression channel should be drawn on the chart, without any guess work. The user can also make minor modifications to the range of the channel (its start and end point).
The indicator can be used in a number of ways. In chart analysis, when the price has exceeded its upper channel deviations (e.g. when price has gone above the 2-standard deviation channel) this is an indication that the price is likely extremely overbought and over-extended. Price movements outside the 2-standard deviation channel are usually unstable and unsustainable, and they often result in failure i.e. a reversal or reversion back to the mean. Similarly, a movement of price has exceeded its lower channel deviations (e.g. when price has gone below its 2-standard deviation channel) this is an indication that the price is likely extremely oversold and over-extended. As mentioned, price movements outside the 2-standard deviation channel are typically unstable and unsustainable, and can result in a reversion back to the mean.
The chartist can use the indicator, therefore, as a measurement of how overbought or oversold – or how over-extended or “over-stretched” – the price is relative to its mean average (the centre line). The further away the price is from its mean average (for example, when price has exceeded beyond its 2, 3 or 4 standard deviation channel) the more likely and probable it is for the price to snap back to its average. The chartist should ideally wait for a confirmation of a reversal (e.g. by breaking near support or resistance) to increase the odds of a reversal. For example, if price has exceeded above its upper 2 standard deviation channel, usually when price closes back inside the channel (i.e. below its upper 2-standard deviation channel) this can increase the odds of a pullback or reversion to the mean. The assumption is that we are expecting price to revert towards the centre line level (the mean). The same applies in reverse when price has exceeded below its lower 2 deviation channel (a close above the lower channel could increase the odds of a pullback to the mean).
It should be noted that the probability of price becoming extremely overbought and overstretched increases when it occurs in the direction of the major trend. For example: in a rising channel and an uptrend, when price becomes parabolic and reaches or exceeds its upper deviation channel (e.g. the upper 2, 3 or 4 standard deviation channel), this type of price action has a higher probability of being extremely overbought and overstretched. As a result, because these type of parabolic conditions can be unstable and unsustainable, they are more likely to result in a pullback, drop or reversion to the mean. The opposite can also be true in a falling channel or downtrend: when a price drop reaches or exceeds its lower deviation channel (e.g. the lower 2, 3, or 4 standard deviation channel), these market conditions are often unstable, oversold and overstretched – thus they are more likely to result in a bounce, reversal, corrective rally or a reversion to the mean.
The second use of the regression channel is as a trend following tool. As long as the price maintains itself within parameters of the regression channel, the odds are in favour of the trend continuing in its original direction. For example, if price has been going up (e.g. in an uptrend) and is inside a rising regression channel, there is a higher probability that the uptrend is likely to continue within the parameters and boundaries of the rising channel. If price were to pullback to the lower deviation channel (the lower band) and bounce off this level, this is a likely indication that the uptrend could continue higher. A sustained break below this rising channel could mean that the trend is likely reversing (a trend reversal) or that the price is getting ready to start a correction (a retracement to the original trend). The same principle applies in reverse for price in a downtrend: as long as price remains within the boundaries of the falling channel, the downtrend is likely to continue. If price were to rally to the upper channel and then drop back within the channel, this is a likely indication that the downtrend could likely continue. A sustained break above the falling channel could be an indication of either a trend reversal or a correction in price.
The Indicator can be used in either an Auto mode or Manual Calculation mode. In the Auto mode, the Indicator utilises an oscillator to determine the “Start Bar” and “End Bar” for the Linear Regression analysis. In the Manual Calculation mode, a chartist can enter their own Start and End Bars. The “Start Bar” is the Bar furthest to the left (past) of the chart and “End Bar” is the nearest to the current Bar or right of the chart.
Deviations are based upon recognised Standard Deviation mathematical techniques, but are modified by factors determined by recognised Linear Correlation calculations.
Further Deviations, 3 and 4, can also be displayed by selecting them in the “Inputs” section. The user can also alter or tweak the regression channel slightly by using the drop down menu in “Regression channel alternatives”. This can help in slightly changing the extent, shape or boundaries of the regression channel.
The indicator can be used on the charts of the majority of markets (e.g. stocks, indices, ETFs, currencies, cryptocurrencies, precious metals, commodities etc.) and any timeframe, but please note that the degree of noise and randomness (and therefore false signals) increases significantly on lower timeframes (as mentioned previously). Chartists should be aware of the probabilistic and uncertain nature of price action and the markets, and therefore prepare to limit and control any potential risks.
If you would like access, please send me a PM on Tradingview.

OverEXTENSION - JBMIt is an indicator that measures the volatility of the market and adapts to price changes through the narrowness of its bands, its main use stands out in the contention of price within the bands.
It is based on the calculation of the standard deviation of the price, it allows to identify when the price has gone too far from its average price range and alerts of a probable market correction.
It is recommended to use in conjunction with oscillators that measure overbought and oversold for a better interpretation.

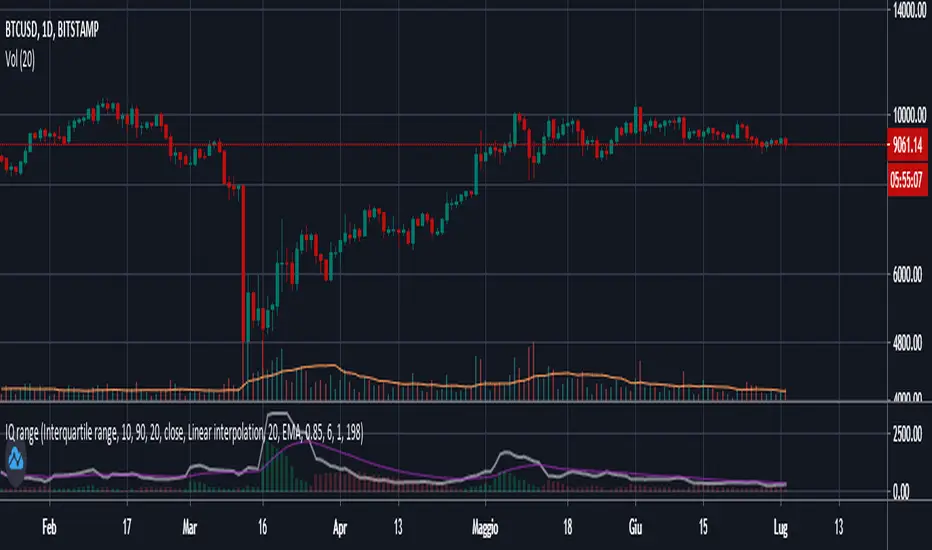
Interquartile rangeThis script plots the Interquartile range (difference between 3rd and 1st quartile), providing useful infos about price distribution and volatility . It is designed to work paired with my other script "Moving percentiles channel", but you can also use it alone.
Features:
- You can compute the percentiles using Linear interpolation or Nearest Rank methods
- You can plot not only the Interquartile range, but also the range (difference between 100th and 0 percentiles) or a User defined range (you have to select which percentiles you want to use from the settings)
- The script also plots a signal line that you can use to obtain signals when the Range line crosses the signal line itself. You can plot the signal line using many different MAs ( SMA , EMA , DEMA , TEMA , WMA , VWMA , HMA , ALMA , LSMA , FRAMA ).
- It also plots an histogram that represents the difference between the Range and the Signal line. It will be green colored when positive, and red colored when negative.
Please show me your support and follow me if you like my scripts. Many more of them are coming in the future.
@ Bezzus
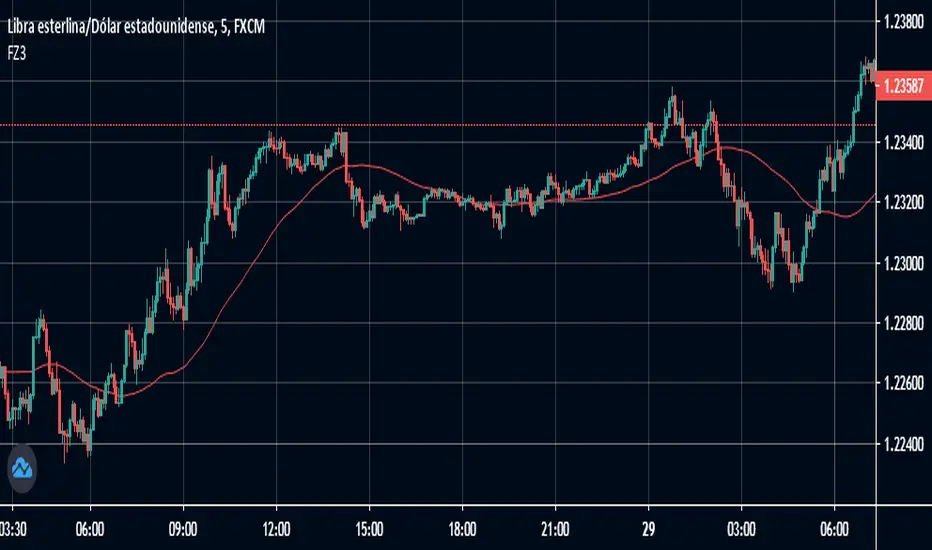
FZ3 DDemo version (02 / Jun / 20)
How to take tickets (binary options)
To take the tickets there are two ways and in both we configure the time limit to the time of the candles that we see, in medium and high volatility
• When the signal is displayed on a candlestick moving candle at the best possible point after seeing the signal
• When the signal is shown in a candle with movement against we will wait for the next candle and enter in favor of the signal
RACEACEACE Ace Pro Kellogg Company 7Min Long SCALPERThis script is specifically designed to detect changes of momentum on the Kellogg Company 7 minute chart. If it detects a change of momentum to an oversold market, it provides an indication of "long entry." Likewise, if it detects a change of momentum to an overbought market, it provides an indication of "long exit." Alerts under the notification menu can also be set by users.
Please note that this script is not an update to any previous script. It is specifically for the volatility on the 7 minute Kellogg Company chart.
To gain access to this script, you may send me a direct message on Tradingview.

ASH Meter v2Histogram shows the strength and can be used to identify trending or ranging periods.
Commonly known as ASH, Absolute Strength Histogram.
I modified the calculation of the histogram.
Volume / Volatility , aka Trend Strength
Only allow to enter on solid bars
-Solid blue = bullish
-Solid red = bearish
-line crossover signify trend shifting
-Grey bars =ranging
PM me for testing purposes only.

Buddy Carter EMA StormtrackerBased on Buddy Carter's Idea to track the change of volatility by comparing different exponential moving averages. The indicator shows difference of shorter-term True Range and a base-length True Range.

ZSZ_ChunnelThe Chunnel is one of the most common ATR based trailing stop indicators.This set up created to understand support and resistance as per ATR ( Average True Range ) 。
In this version you can change the ATR calculation method from the settings.The indicator is easy to use and gives an accurate reading about an ongoing trend. It is constructed with two parameters, namely period and multiplier. The default values used while constructing a superindicator are 10 for average true range or trading period and three for its multiplier.
The average true range (ATR) plays an important role in 'Chunnel' as the indicator uses ATR to calculate its value. The ATR indicator signals the degree of price volatility .
The buy and sell signals are generated when the indicator starts plotting either on top of the closing price or below the closing price. A buy signal is generated when the ‘Chunnel’ closes above the price and a sell signal is generated when it closes below the closing price.
It also suggests that the trend is shifting from descending mode to ascending mode. Contrary to this, when a ‘Chunnel’ closes above the price, it generates a sell signal as the colour of the indicator changes into red.
The indicator can be used on equities, futures or forex, or even crypto markets and also on daily, weekly and hourly charts as well, but generally, it fails in a sideways-moving market.

Deribit Daily OptionsOverlays Deribit daily option expiration time and strike prices on chart. Also overlays historical volatility rounded to nearest whole number for quick reference.


[PX] Forex ATRCompare forex volatility at a glance.
If you are looking for someone to develop your own indicator or trading strategy, don't hesitate to get in touch with me here on TradingView or below.
Contact:
www.pascal-simon.de
info@pascal-simon.de