Booming Bull 15 Min StrategyBooming Bull 15 Min strategy
Conditions
First 15 min candle high-low must be less than .75%
Next candle is crossing either high or low
在腳本中搜尋"a股开盘前15分钟交易规则"

Gap driven intraday trade (better in 15 Min chart)// Based on yesterday's High, Low, today's open, and Bollinger Band (20) in current minute chart,
// Defined intraday Trading opportunity: Stop, Entry, T0, Target (S.E.T.T)
// Back test in 60, 30, 15, 5 Min charts with SPY, QQQ, XOP, AAPL, TSLA, NVDA, UAL
// In 60 and 30 min chart, the stop and target are too big. 5 min is too small.
// 15 min Chart is the best time frame for this strategy;
// -------------------------------------------------------------------------------
// There will be Four lines in this study:
// 1. Entry Line,
// 1.1 Green Color line to Buy, If today's open price above Yesterday's High, and current price below BB upper line.
// 1.2 Red Color line to Short, if today's open price below Yesterday's Low, and current above BB Lower line.
//
// 2. Black line to show initial stop, one ATR in current min chart;
//
// 3. Blue Line (T0) to show where trader can move stop to make even, one ATR in current min chart;
//
// 4. Orange Line to show initial target, Three ATR in current min chart;
//
// Trading opportunity:
// If Entry line is green color, Set stop buy order at today's Open;
// Whenever price is below the green line, Prepare to buy;
//
// If Entry line is Red color, Set Stop short at today's Open;
// Whenever price is above the red line, Prepare to short;
//
// Initial Stop: One ATR in min chart;
// Initial T0: One ATR in min chart;
// Initial Target: Three ATR in min chart;
// Initial RRR: Reward Risk Ratio = 3:1;
//
// Maintain: Once the position moves to T0, Move stop to "Make even + Lunch (such as, Entry + $0.10)";
// Allow to move target bigger, such as, next demand/supply zone;
// When near target or demand/supply zone or near Market close, move stop tightly;
//
// Close position: Limit order filled, or near Market Close, or trendline break;
//
// Key Step: Move stop to "Make even" after T0, Do not turn winner to loser;
// Willing to "in and out" many times in one day, and trade the same direction, same price again and again.
//
// Basic trading platform requests:
// To use this strategy, user needs to:
// 1. Scan Stocks Before market open:
// Prepare a watch list for top 10 ETF and Top 90 stocks which are most actively traded.
// Stock might be limited by price range, Beta, optionable, ...
// Before market open, Run a scan for these stocks, find which has GAP and inside BB;
// create watch list for that day.
//
// 2. Attach OSO and OCO orders:
// User needs to Send Entry, Stop (loss), and limit (target) orders at one time;
// Order Send order ( OSO ): Entry order sends Stop order and limit order;
// Order Cancel order ( OCO ): Stop order and limit order, when one is filled, it will cancel the other instantly;

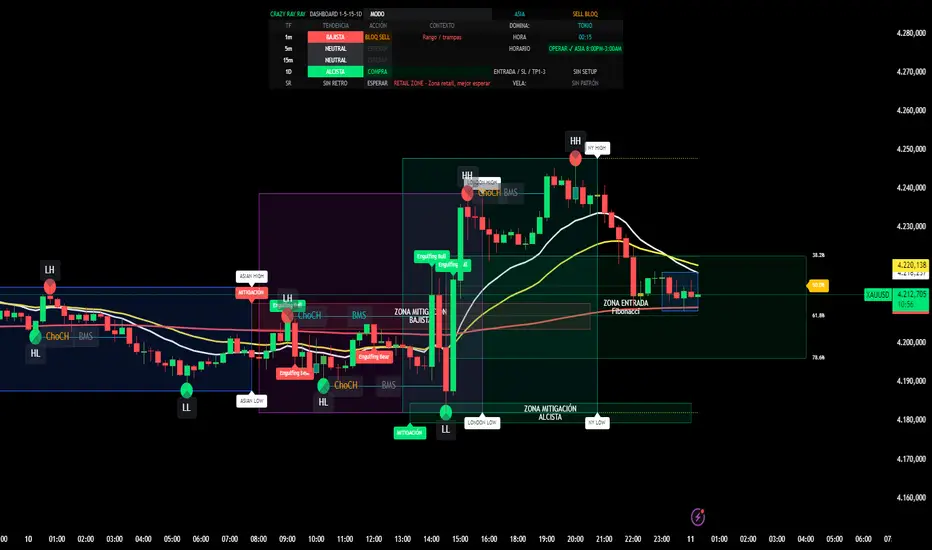
CRR Dashboard 1-5-15-1D1. What this indicator does (simple)
It’s a multi-timeframe institutional dashboard for XAU (or any pair) that tells you:
Trend & action on 1m / 5m / 15m / 1D
Best sessions & hours to trade (Asia, London, NY)
If the market is Institutional ON or just Retail zone
Smart Money structure (HH/HL/LL/LH, BOS, ChoCH, Fibo zones, mitigation boxes)
No-pullback entries (SIN RETRO) with automatic TP1–TP3
Extra BUY/SELL filters to block stupid trades (anti-stupid buy/sell)
You don’t need to understand every line of code. You just need to read the HUD + labels.
2. When NOT to trade
Before thinking BUY/SELL, look at the HUD (top center):
Time advice row (HORARIO)
If it says things like:
“NO OPERAR (ROLLOVER)”
“NO OPERAR (HORAS MUERTAS)”
“NO OPERAR (DESPUÉS 3:30 PM)”
👉 Do not trade.
Global status (top right of HUD)
If it shows:
“BUY BLOQ”, “SELL BLOQ”, or “BUY/SELL BLOQ”
👉 Market is dangerous for that side. Avoid entries in that direction.
Institutional status text (SR row, column “INST”)
If it says “RETAIL ZONE”, the move is weak / choppy.
👉 Only A+ setups, or better: skip.
3. BUY – how to use it (step-by-step)
A) Time & session
In the HUD, check:
Session name: LONDON or NEW YORK (or strong Asia scalp).
Time advice:
✅ “OPERAR ✔ LONDRES 3:00–5:00”
✅ “OPERAR ✔ NY OPEN 8:30–10:30”
✅ “OPERAR ✔ NY PM 1:30–3:30”
Institutional text:
✅ “INSTITUTIONAL ON – Momento pro…”
👉 If sessionStrong + Institutional ON = good environment to BUY.
B) Trend & bias
Look at the TF rows in the HUD:
1m / 5m / 15m / 1D:
TENDENCIA: should be mostly ALCISTA (green background).
ACCIÓN: should say “COMPRA” (not “VENTA” and not “BLOQ BUY”).
Mode box:
If MODO says:
“ALCISTA – SOLO COMPRAS” → you only look for BUY.
Global status (top right):
Best BUY statuses:
“BUY PRO ✅”
“BUY REV LL ✅”
or at least “BIAS BUY”
If you see “BUY TRAP ❌”, do NOT buy.
C) Entry types for BUY
You basically have 3 BUY styles:
1️⃣ BUY SIN RETRO (pure momentum)
Internal condition: entryBuyNoRetro
On chart:
You will see “BUY SIN RETRO” in the SR row (HUD)
And alert: “CRR BUY INSTITUCIONAL 1M”
Use it like this:
Trend up on 1m EMAs (15 > 30 > 200)
MACD gives bullish shift
Price crosses above EMA200
Session strong + Institutional ON
👉 You take the BUY with no pullback, pure breakout.
2️⃣ BUY PRO INSTITUCIONAL (full checklist)
Internal: fullBuySetup
You’ll see label “BUY PRO” below the candle.
Global status often shows: “BUY PRO ✅”
This is a mega-filtered BUY:
Institutional context OK (allowBuyInst = true)
Candle is bullish institutional pattern (engulfing, strong body, hammer, etc.)
Multi-TF bias bullish
Session strong
No blockers (not buyBlockerOn, not sellBlockerOn)
👉 This is your A+ professional BUY.
3️⃣ BUY REVERSAL LL (from discount & LL)
Internal: buyReversalLL
You’ll see label: “BUY REV LL” under the candle.
Global status may show: “BUY REV LL ✅”
Logic:
Market had bearish SMC (LLs)
You are near discount Fibo zone (38–61–78%)
Recent LL (support)
Price now above EMA200
Bullish candle pattern + strong session
👉 Reversal BUY from discount zone after taking liquidity.
D) Stop loss & take profits for BUY
When a valid Buy SIN RETRO signal appears:
Script automatically sets:
Entry price
SL (below swing low)
TP1 / TP2 / TP3 using your RR settings (tp1RR, tp2RR, tp3RR)
You see them in HUD:
Row: “ENTRADA / SL / TP1–3”
Text like:
BUY E: 2420.00 SL: 2415.00 T1: 2425.00 T2: 2427.50 T3: 2430.00
Basic management idea:
At TP1: close part, move SL to breakeven.
At TP2 / TP3: trail or close more.
4. SELL – how to use it (mirror of BUY)
Same idea but opposite side.
A) Time & session
Same rules: only when timeAdvice says OPERAR ✔ and Institutional ON.
Avoid rollover / dead hours / after 3:30 PM.
B) Trend & bias for SELL
TF rows (1m/5m/15m/1D):
TENDENCIA: mostly BAJISTA (red).
ACCIÓN: “VENTA”, not “COMPRA”, and not “BLOQ SELL”.
MODO: ideally “BAJISTA – SOLO VENTAS”.
Global status:
Best: “SELL PRO ✅”, “SELL REV HH ✅”, or “BIAS SELL”.
If you see “BUY BLOQ” it’s fine for sells; if “SELL BLOQ”, don’t sell.
C) Entry types for SELL
1️⃣ SELL SIN RETRO
Momentum no-pullback sell
MACD shift bearish + EMA200 break down
Strong session + institutional ON
👉 Use when entrySellNoRetro is true and “SELL SIN RETRO” appears.
2️⃣ SELL PRO INSTITUCIONAL
Label: “SELL PRO” above candle.
Global: “SELL PRO ✅”.
Full SMC + Fibo + multi-TF + candle + session confirmation.
3️⃣ SELL REVERSAL HH
Label: “SELL REV HH” above candle.
From premium zone (Fibo 61–78%) near a recent HH.
Bearish institutional candle from liquidity sweep high.
D) SL & TP for SELL
On Sell SIN RETRO, script sets:
Entry = close
SL = above swing high
TP1/TP2/TP3 below
Managed exactly like BUY but inverted.
5. Ultra-short “How to use” checklist (English)
For BUY:
Trade only when HUD time says “OPERAR ✔ …” and INSTITUTIONAL ON.
Mode near “ALCISTA – SOLO COMPRAS”, most TF rows show COMPRA.
Global status is BUY PRO ✅, BUY REV LL ✅ or BIAS BUY (not BUY BLOQ, not BUY TRAP ❌).
Take entries on:
BUY SIN RETRO,
BUY PRO,
or BUY REV LL,
with clear candle pattern + SL/TP line in HUD.
For SELL:
Same hours & Institutional ON.
Mode near “BAJISTA – SOLO VENTAS”, TF rows mostly VENTA.
Global status SELL PRO ✅, SELL REV HH ✅ or BIAS SELL (not SELL BLOQ).
Take SELL SIN RETRO, SELL PRO, or SELL REV HH with SL/TP from HUD.


EMA Slope in Degrees (9 & 15) — correctedthis gives angle os slope of 9 and 15 ema uses mayank raj strategy

EMA Cross Strategy v5 (30 lots) (15 min candle only)- safe flip🚀 EMA Cross Strategy v5 (30 Lots) (15 min candle only)— Safe Flip Edition
Fully Automated | Fast | Reliable | Battle-tested
Welcome to a clean, powerful, and automation-friendly EMA crossover system.
This strategy is built for traders who want consistent trend-based entries without the risk of unwanted pyramiding or doubled positions.
🔥 How It Works
This strategy uses a fast EMA (10) crossing a slow EMA (20) to detect trend shifts:
Bullish Crossover → LONG (30 lots)
Bearish Crossover → SHORT (30 lots)
Every opposite signal safely flips the position by first closing the current trade, then opening a fresh position of exactly 30 lots.
No doubling.
No runaway position size.
No surprises.
Just clean, mechanical trend-following.
📈 Why This Strategy Stands Out
Unlike basic EMA crossbots, this version:
✔ Prevents unintended pyramiding
✔ Never over-allocates capital
✔ Works perfectly with webhook-based automation
✔ Produces stable, systematic entries
✔ Executes directional flips with precision
🔍 Backtest Highlights (1-Year)
(Backtests will vary by instrument/timeframe)
1,500+ trades executed
Profit factor above 1.27
Strong trend performance
Balanced long/short behavior
No margin calls
Consistent trade execution
This strategy thrives in trending markets and maintains strict discipline even in choppy conditions.
⚙️ Automation Ready
Designed for automated execution via webhook and API setups on supported platforms.
Just connect, run, and let the bot follow the rules without hesitation.
No emotions.
No overtrading.
No fear or greed.
Pure logic.

ASHOK 15 Novashok trial 15 nov 1845h
I have created this strategy to convert my chart pattern and MACD, EMA observations to tradeable logic.

4/8/15 EMA + Classic & Camarilla PivotsSays it all in the title...4/8/15 EMA + Classic & Camarilla Pivots without setting up difficult choices on TOS. Stay on the right side of the 15. Let it detach from the 8 and follow it up. If you are entangled in the 4/8, time to bail in my humble opinon. For Scalpers and intraday traders.

RSI MTF Table - 12 Pairs (1,5,15)
The relative strength index measures the speed and magnitude of an asset's recent price changes. Therefore, it is considered a momentum indicator in technical analysis. Essentially, the RSI is the ratio of the days an asset's value increases to decreases over a given period.
Generally speaking, if the RSI is around 50, we do not expect strong movements. RSI above 65 or below 35 are areas we expect. In this context, this chart and the general momentum in 1-5-15 minutes allow us to quickly determine the parity we will trade. It is useful for intraday trading and scalping.

EMA 9/15/45 + MACD Confirm + SupertrendThis indicator uses EMA 9, 15, 45 days along with combination of MACD and Supertrend

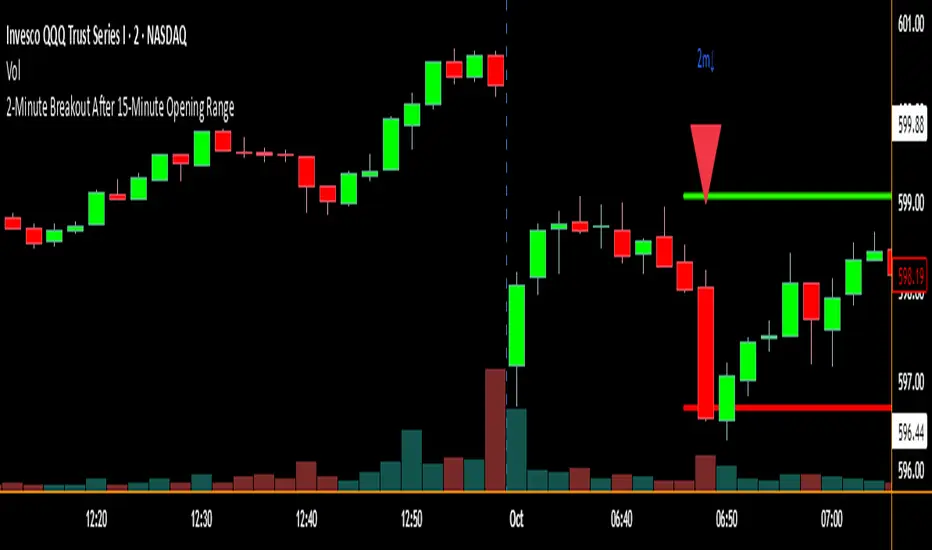
2-Minute Breakout After 15-Minute Opening RangeBreakout must happen before 8 am PST. I used Chat GPT to create this for me so I could do some backtesting on 15 min ORBs.
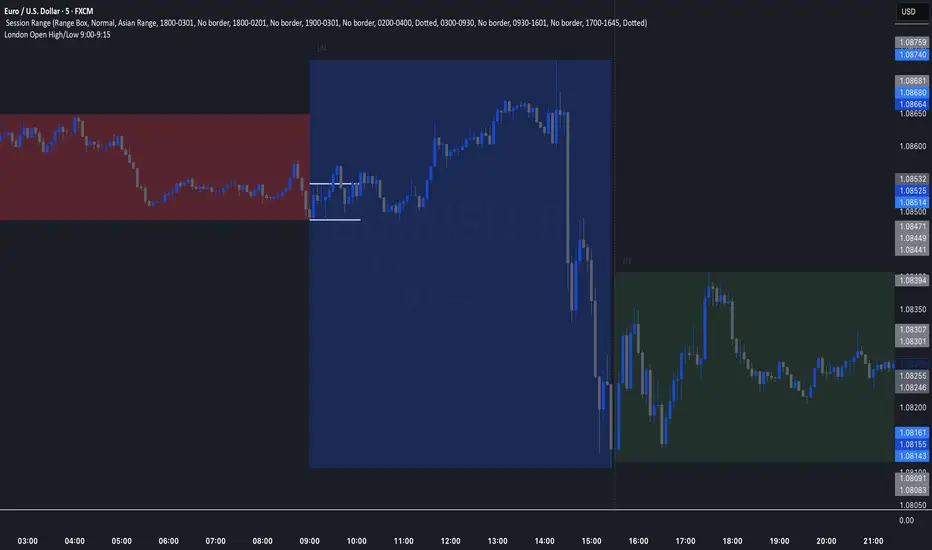
London Open High/Low 9:00-9:15indicator marks out high and low of the first 15 minutes of the London session.
First 15 Minutes From OpenHighlights the first 15 minutes after open and the tick value between high and low

Trading Sessions with 15 minute ORBA working copy of the original Tradingview trading sessions indicator with the addition of horizontal lines marking the 15 minute opening range for your ORB strategy. The lines reset with each session start.
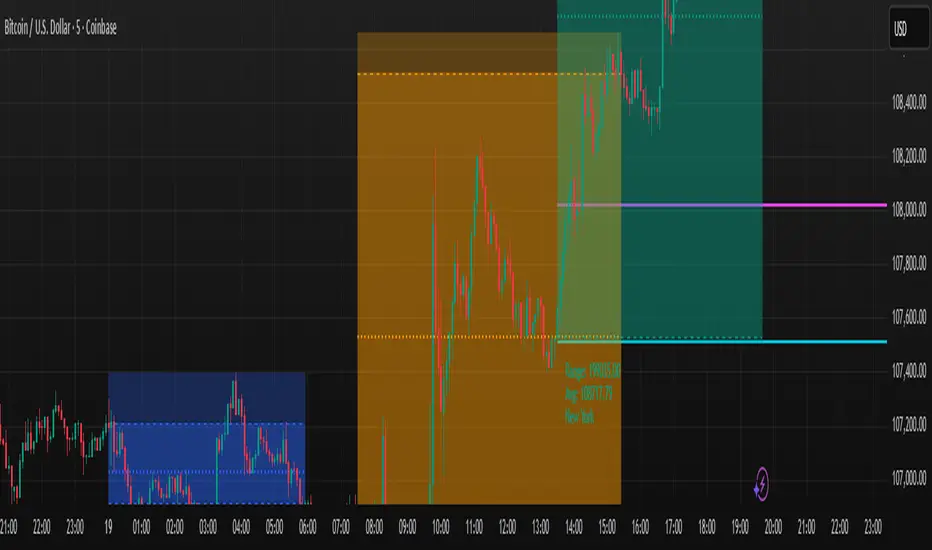
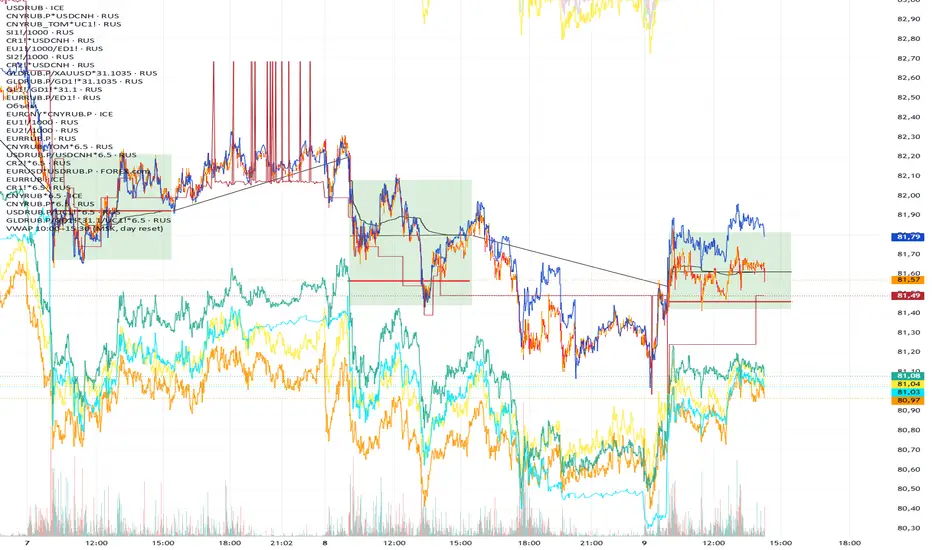
VWAP 10:00–15:00 (MSK, daily reset)Calculates the volume-weighted average price (VWAP) from 10:00 to 15:00 MSK.
The data is used to determine the funding rate of MOEX perpetual futures by comparing the average price of the perpetual contract with the official Central Bank exchange rate on the following day.
EMA 4/8/15The 4/8/15 are the main Moving Averages you need. . When it is inside the 4/8, it is moving slowly. If it detaches or launches above the 8, you have an increase in volume and price

Moving Averages 7 & 15 & 50 & 100 & 200 & 400we can use 7 moving averages for one indicator.
base moving averages are 7, 15, 50, 100, 200 and 400.
it can be used for determining of trend
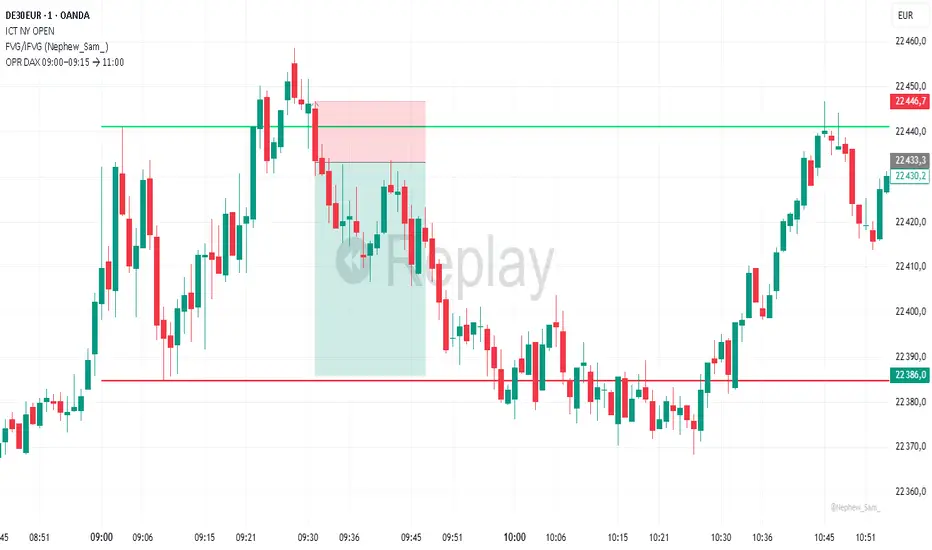
OPR DAX 09:00–09:15 → 11:00 Nico VThis indicator plots on the DAX each day:
The high (green) and low (red) of the 09:00 → 09:15 Berlin time range.
These levels are extended horizontally until 11:00.
Optionally, it displays the midpoint as a white dashed line.
Purpose: to quickly identify the morning opening range (OPR) and observe how price reacts to these levels during the rest of the morning.
NY Session open 9:30 and bond market close at 15:00NY Session open 9.30 and bond market close at 15:00
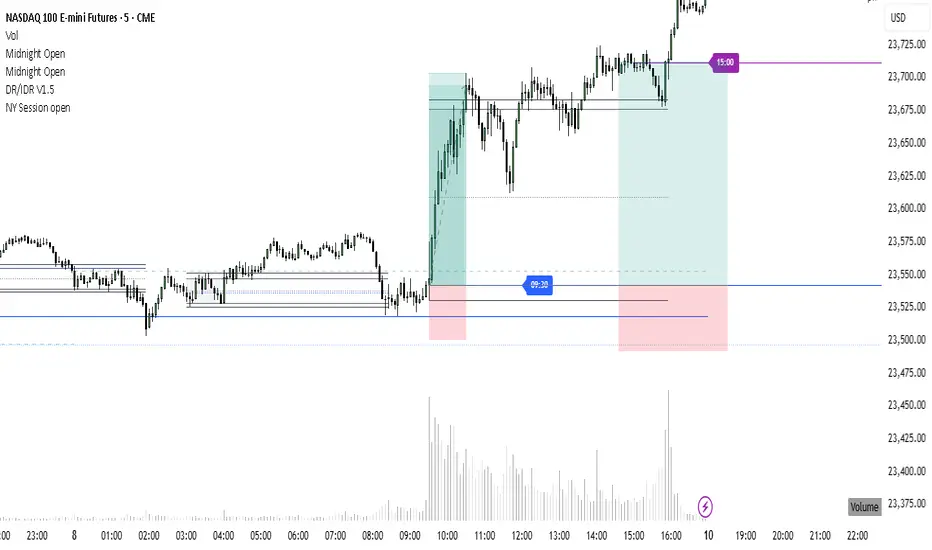
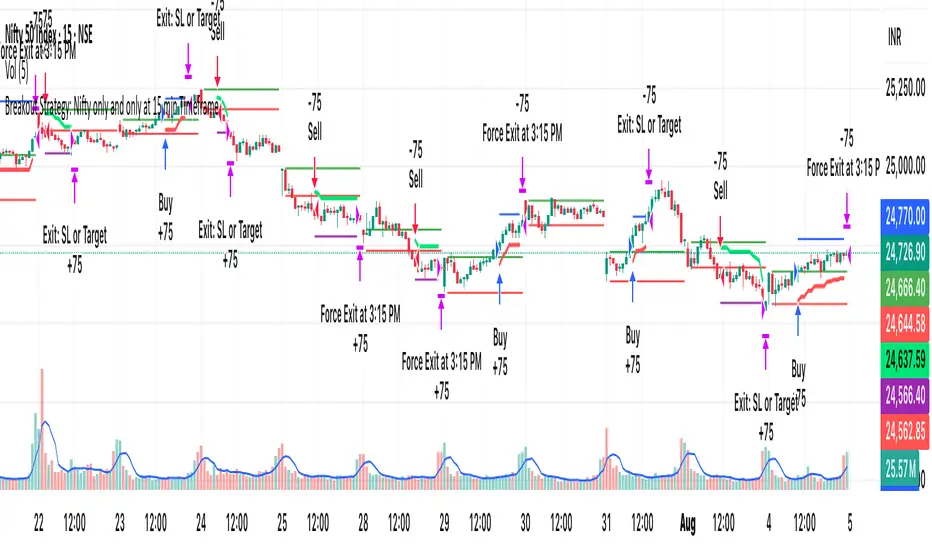
[PS]Breakout Strategy: Nifty/BN only at 15 min TimeframeIt only works on 15 min timeframe for nifty and Bank nifty.
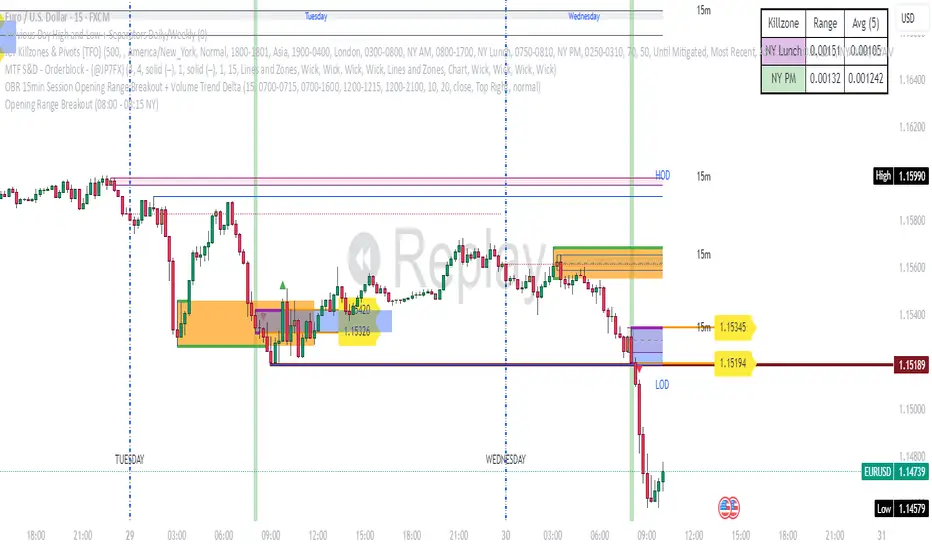
Opening Range Breakout (08:00 - 08:15 NY) - AAPNIndicador que marca la apertura de Forex en NY a 15 minitos, la primera vela
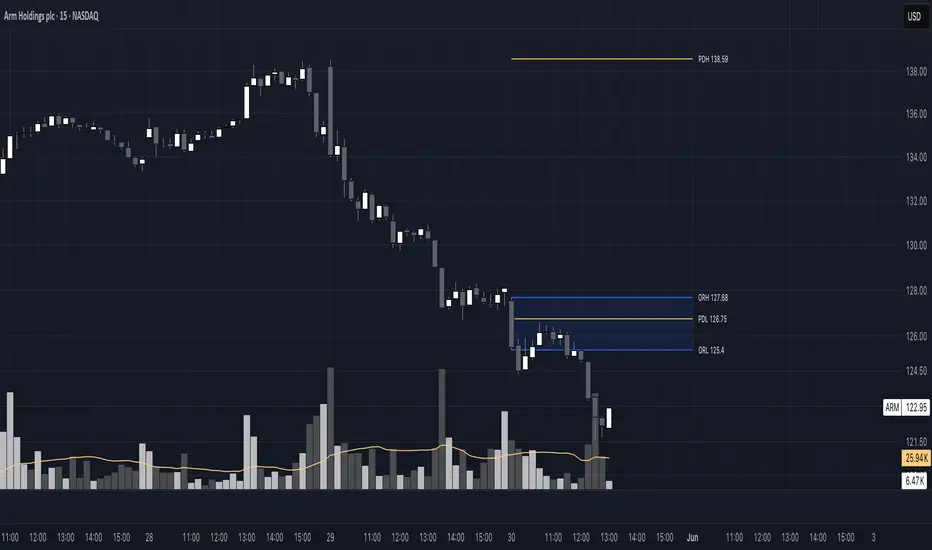
Opening Range 15 minThis indicator highlights the Opening Range (OR) for the first 15 minutes (9:30–9:45 AM EST). It visually plots high/low lines and a shaded box to define this range, helping traders identify key intraday levels for potential breakout or rejection scenarios. The script also provides optional overlays for the Previous Day’s High/Low and the Extended Hours High/Low, offering a complete context for day trading setups.
Main Features:
Opening Range Detection – Automatically calculates and draws the high/low of the 9:30–9:45 AM session.
Visual Enhancements – Includes customizable lines, shaded boxes, and labels to mark the OR high (ORH) and low (ORL) levels.
Previous Day High/Low (Optional) – Plots and labels the previous day's high and low for reference during current day trading.
Extended Hours High/Low (Optional, when ETH enabled) – Displays overnight session levels for added insight into early volatility (4:00 AM to 9:30 AM EST).
User Customization – Easily adjust colors, label styles, and visibility for all plotted levels and regions.