在腳本中搜尋"a股板块+沪深两市+股价不超过10元的股票+技术形态好"

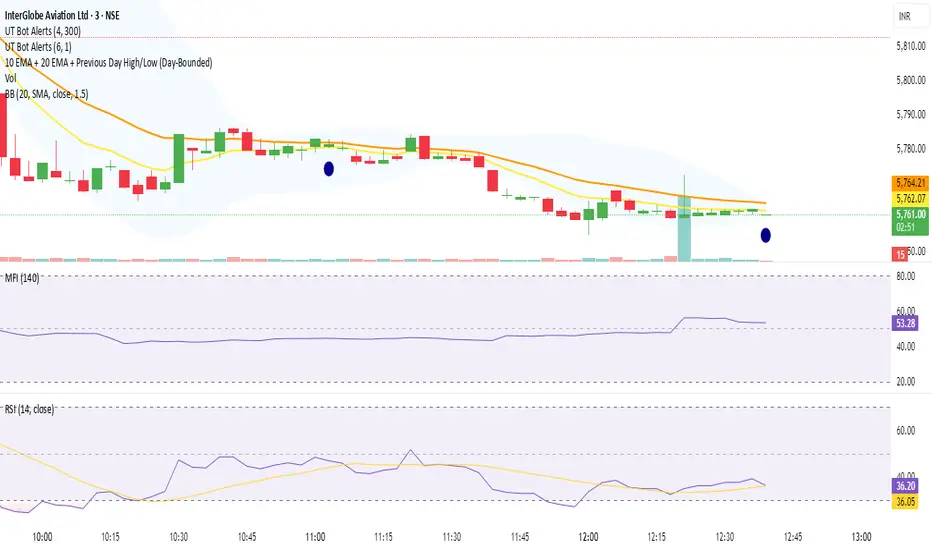
10 EMA + 20 EMA + Previous Day High/Low (Day-Bounded)it gives the reand and also plot the day's lowest volume.it is very helpful in reversals
10/21 EMA + 50/200 Daily SMAAll four relevant moving averages in one script to allow you to add move indicators.

10MAs + BB10 MAs riboon + Bollinger Bands
I used two basic Multiple MA ribbons. so I just merge them to one indicaotor

10-2 Year Treasury Yield Spread by zdmreLong-term bond yield reflects inflation. Short-term bond yields are tools used to predict Fed's interest rate policy. Spread between the two represents four cycles of an economy.
1. Growth
Short-term yield rises as interest rates rise. Spread narrows.
2. Slow growth
Central bank raises interest rates faster and short-term yield exceeds long-term yield. Spread turns negative.
3. Recession
High interest rates lead to more defaults. Inflation caps consumption. Central bank lowers interest rate to stimulate the economy and short-term yield falls. Spread widens.
4. Recovery
Central bank continues easing. Spread remains wide and yield curve remains steep.
0 = Recession Risk
2.6 = Recovery Plan
DYOR


6 Figures Scalping 2x MACD10-11-2019
This script plots a double MACD in a new indicator pane
The default settings:
Pink = STD MACD , settings 12-26-9
Green - Fast MACD, settings 5-15-1
The MACD settings can be changed in the indicators setting window

10/20/50/100/200 SMA'sMultiple MA's to get a good feel for momentum and interim supports and resistances


Moving Average x10 (SMA, EMA)10 configurable Simple and Exponential moving averages combined in one indicator

SMA RIBBON10 SMA's arranged in a ribbon. Color coded depending on price close. Free to use, open source. As seen in some charts.


10Y Bond Yield Spread (beta)10-Year Bond Yield Spread using Quandl data
See also:
- seekingalpha.com
- www.babypips.com
- www.forexfactory.com

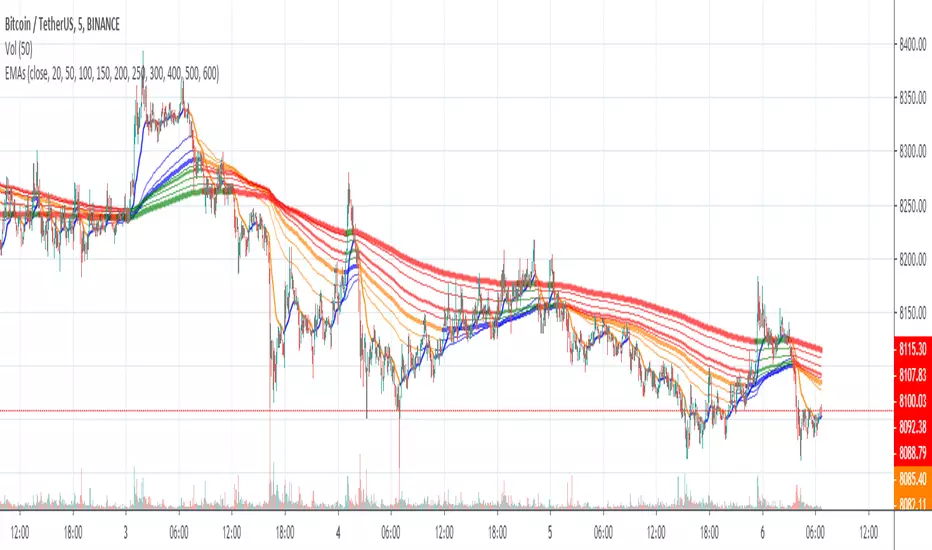
10 Simple & 6 Exponential Moving Averages (w/ 18 day,week,month)* This is for the trader who wants tons of moving averages on their chart from one indicator
* Using the options, you should be able ot turn off some of them if the screen is too noisy for you
* You should also be able to change colors and thickness of the bars
* The thicker bars are for longer term averages
* This version is similar to my other script except it adds the 18 day, 18 week, and 18 Month SMa
* I added them after watching ira Epstein's YouTube videos
* Let me know if there are any bugs or things that need to be change

Grok/Claude Quantum Signal Pro * Enhanced v2# QSig Pro+ v2 — Dynamic RSI Enhancement
## Release: Quantum Signal Pro Enhanced v2
**Author:** ralis24 (with Claude assistance)
**Version:** 2.0
**Platform:** TradingView (Pine Script v6)
---
## Overview
Version 2 introduces **Trend-Adaptive RSI Thresholds** — a significant enhancement that dynamically adjusts buy and sell levels based on real-time trend strength. This allows the indicator to more effectively capture dips in uptrends and sell bounces in downtrends, rather than waiting for extreme oversold/overbought conditions that rarely occur during strong directional moves.
---
## The Problem v2 Solves
In the original QSig Pro+, RSI thresholds were fixed at 30 (oversold) and 70 (overbought). While these levels work well in ranging markets, they create issues in trending conditions:
- **Strong Uptrends:** Price rarely drops to RSI 30. Pullbacks typically bottom around RSI 40-50, causing missed buy opportunities.
- **Strong Downtrends:** Relief rallies rarely push RSI above 70. Bounces often exhaust around RSI 55-65, causing missed sell opportunities.
The v2 solution: **Let the market's trend strength dictate the appropriate RSI levels.**
---
## New Feature: Dynamic RSI Thresholds
### How It Works
The indicator now detects three distinct market states and applies corresponding RSI thresholds:
| Market State | Detection Criteria | RSI Buy Level | RSI Sell Level |
|--------------|-------------------|---------------|----------------|
| **Strong Uptrend** | +DI > -DI, ADX > 24, ADX rising | < 40 | > 80 |
| **Strong Downtrend** | -DI > +DI, ADX > 24, ADX rising | < 20 | > 60 |
| **Neutral/Ranging** | ADX < 24 or ADX falling | < 30 | > 70 |
### Trend State Detection Logic
```
Strong Uptrend = (+DI > -DI) AND (ADX > threshold) AND (ADX > ADX )
Strong Downtrend = (-DI > +DI) AND (ADX > threshold) AND (ADX > ADX )
Neutral = Neither condition met
```
### Anti-Whipsaw Protection
To prevent rapid switching between threshold sets during choppy transitions, a **confirmation buffer** requires the trend state to persist for a configurable number of bars (default: 2) before the indicator switches regimes.
---
## New Input Parameters
A new input group "**Dynamic RSI Thresholds**" has been added with the following settings:
| Parameter | Default | Range | Description |
|-----------|---------|-------|-------------|
| Enable Trend-Adaptive RSI Levels | ON | toggle | Master switch for the feature |
| ADX Strong Trend Threshold | 24 | 15-40 | ADX must exceed this to qualify as "strong" trend |
| ADX Rising Lookback (bars) | 3 | 1-10 | ADX must be higher than N bars ago to confirm rising |
| Trend Confirmation Bars | 2 | 1-5 | Bars trend must persist before switching thresholds |
| RSI Buy Level (Strong Uptrend) | 40 | 30-55 | Oversold threshold during confirmed uptrends |
| RSI Sell Level (Strong Uptrend) | 80 | 70-90 | Overbought threshold during confirmed uptrends |
| RSI Buy Level (Strong Downtrend) | 20 | 10-30 | Oversold threshold during confirmed downtrends |
| RSI Sell Level (Strong Downtrend) | 60 | 50-70 | Overbought threshold during confirmed downtrends |
| RSI Buy Level (Neutral/Ranging) | 30 | 20-40 | Standard oversold threshold |
| RSI Sell Level (Neutral/Ranging) | 70 | 60-80 | Standard overbought threshold |
---
## Enhanced Info Panel
The information panel now displays two new rows:
1. **Trend State** — Shows current regime: "STRONG UP" (green), "STRONG DOWN" (red), or "NEUTRAL" (gray)
2. **RSI Levels** — Displays the currently active thresholds (e.g., "40 / 80" during uptrends)
Additionally, the **ADX row** now includes a directional arrow (↑ or ↓) indicating whether ADX is rising or falling.
---
## Enhanced Signal Labels
Buy and sell labels on the chart now include contextual information:
**Before (v1):**
```
BUY: 97,234.50
```
**After (v2):**
```
BUY: 97,234.50
STRONG UP | RSI<40
```
This provides immediate visual confirmation of which threshold regime triggered the signal.
---
## Enhanced Alert System
### New Alert Conditions
Three new alerts have been added for trend state changes:
- **🔼 Strong Uptrend Started** — Fires when market transitions to strong uptrend (thresholds shift to 40/80)
- **🔽 Strong Downtrend Started** — Fires when market transitions to strong downtrend (thresholds shift to 20/60)
- **⚖️ Trend Neutralized** — Fires when trend weakens and thresholds reset to 30/70
### Enhanced Webhook JSON
The JSON alert payload now includes additional fields for bot integration:
```json
{
"action": "BUY",
"symbol": "BTC/USDT",
"price": "97234.50",
"rsi": "38.5",
"rsi_threshold": "40",
"adx": "28.3",
"fisher": "-1.87",
"trend_state": "STRONG UP"
}
```
---
## Bonus Enhancement: Dynamic Fisher Thresholds
As an additional refinement, the Fisher Transform thresholds now adjust slightly based on trend state:
| Trend State | Fisher Buy Level | Fisher Sell Level |
|-------------|------------------|-------------------|
| Strong Uptrend | -1.5 (loosened) | -2.0 (standard) |
| Strong Downtrend | -2.0 (standard) | +1.5 (loosened) |
| Neutral | -2.0 (standard) | +2.0 (standard) |
This allows the indicator to trigger signals in strong trends where momentum oscillators rarely reach extreme levels.
---
## Practical Trading Impact
### Strong Uptrend Example (BTC rally)
- **Before:** Waiting for RSI < 30 means missing most pullback entries
- **After:** RSI < 40 triggers buy signals on normal pullbacks within the trend
### Strong Downtrend Example (Bear market bounce)
- **Before:** Waiting for RSI > 70 means holding through entire relief rallies
- **After:** RSI > 60 triggers sell signals on bounce exhaustion
### Ranging Market
- Thresholds remain at traditional 30/70 levels where mean reversion works best
---
## Backward Compatibility
The dynamic RSI feature can be completely disabled by turning off "Enable Trend-Adaptive RSI Levels" in the settings. When disabled, the indicator behaves identically to v1 using the neutral threshold values (30/70).
---
## Summary of Changes
| Component | v1 | v2 |
|-----------|----|----|
| RSI Thresholds | Fixed 30/70 | Dynamic based on trend state |
| Trend State Detection | Not present | +DI/-DI + ADX + Rising confirmation |
| Whipsaw Protection | Not present | Configurable confirmation bars |
| Info Panel Rows | 10 | 12 (added Trend State, RSI Levels) |
| ADX Display | Value only | Value + direction arrow |
| Signal Labels | Price only | Price + Trend State + Threshold |
| Alert Conditions | 10 | 13 (added 3 trend state alerts) |
| Webhook Fields | 5 | 7 (added rsi_threshold, trend_state) |
| Fisher Thresholds | Fixed | Adaptive (subtle adjustment) |
---
## Recommended Settings by Market Type
### Crypto (High Volatility)
- ADX Strong Trend Threshold: 24
- RSI Buy (Uptrend): 40-45
- RSI Sell (Downtrend): 55-60
### Forex (Medium Volatility)
- ADX Strong Trend Threshold: 22
- RSI Buy (Uptrend): 38-42
- RSI Sell (Downtrend): 58-62
### Stocks/Indices (Lower Volatility)
- ADX Strong Trend Threshold: 20
- RSI Buy (Uptrend): 35-40
- RSI Sell (Downtrend): 60-65
---
## Installation
1. Open TradingView and navigate to Pine Editor
2. Remove or rename existing QSig Pro+ indicator
3. Paste the complete v2 code
4. Click "Add to Chart"
5. Configure Dynamic RSI Thresholds in settings as desired
---
*QSig Pro+ v2 — Smarter entries through trend-aware signal generation*

Macros+AMD [NW]Macros + AMD - Daily & Weekly Time-Based Analysis
Multi-timeframe AMD (Accumulation, Manipulation, Distribution) visualization with ICT Macro timing windows for time-based market analysis.
Overview
This indicator visualizes the AMD (Accumulation, Manipulation, Distribution) framework on both daily and weekly timeframes, combined with ICT Macro timing windows. It is designed as an educational tool to help traders study time-based market structure and algorithmic price delivery concepts.
The AMD model is based on the idea that markets move through distinct phases within each trading period:
Accumulation (A) - Initial range formation, liquidity building
Manipulation (M) - False moves to trap traders, liquidity sweeps
Distribution (D) - True directional move, price delivery to targets
What This Indicator Displays
Daily AMD Phases
Displays the intraday AMD cycle based on New York trading hours:
A Phase (Blue): 4:00 AM - 8:35 AM EST — Morning accumulation, Asian/London overlap
M Phase (Red): 8:35 AM - 11:25 AM EST — NY session manipulation, news events
D Phase (Green): 11:25 AM - 4:00 PM EST — Afternoon distribution and price delivery
Weekly AMD Phases
Displays the weekly AMD cycle from Monday to Monday:
A Phase: Monday 00:00 - Tuesday 21:56 EST — Weekly high/low formation begins
M Phase: Tuesday 21:56 - Thursday 02:04 EST — Mid-week reversal zone
D Phase: Thursday 02:04 - Monday 00:00 EST — Weekly price delivery
Inner M Phase Fibs
When enabled, subdivides the M (Manipulation) phase using Fibonacci levels:
0.382 level — Inner accumulation ends
0.500 level — Mid-point of manipulation
0.618 level — Inner distribution begins
This helps identify potential reversal points within the manipulation phase.
ICT Macro Windows
Horizontal lines marking the XX:42 to XX:15 macro periods (33-minute windows):
2:42 - 3:15 AM
3:42 - 4:15 AM (London)
7:42 - 8:15 AM
8:42 - 9:15 AM
9:42 - 10:15 AM (Prime AM session)
10:42 - 11:15 AM
11:42 - 12:15 PM
12:42 - 1:15 PM
1:42 - 2:15 PM
2:42 - 3:15 PM
These windows represent times when algorithmic price delivery is more likely to occur.
How To Use
Understanding the AMD Framework
During the A Phase:
Observe range formation and initial liquidity pools
Note the high and low established during this phase
Wait for manipulation before committing to direction
During the M Phase:
Watch for false breakouts and stop hunts
Look for reversal patterns after liquidity sweeps
The inner fibs (0.382, 0.5, 0.618) can help time entries within this phase
Mid-week (Wednesday) often sees key reversals on weekly AMD
During the D Phase:
This is typically when the true move occurs
Price tends to deliver toward draw on liquidity targets
The direction is often opposite to the manipulation move
Using the Macro Windows
The XX:42 to XX:15 windows are times to pay attention to price action:
These 33-minute periods often see increased algorithmic activity
Look for displacement, fair value gaps, or order blocks forming
The 9:42-10:15 AM window is considered particularly significant for NY session
Weekly Day Labels
Monday/Tuesday: "H/L of Week" — Watch for weekly high or low formation
Wednesday: "Reversal Day" — Mid-week reversal probability increases
Thursday/Friday: "Reversal Day" — Continuation or secondary reversal
Settings Guide
Main Settings
Timezone: Set to your broker's timezone or preferred timezone
Macros On Top: Toggle macro lines above or below AMD boxes
Show All Text Labels: Master toggle for all text (turn off for clean charts on HTF)
Daily/Weekly AMD
Show: Enable/disable the AMD visualization
Opacity: Adjust transparency of the phase boxes (higher = more transparent)
AMD Colors
Customize colors for each phase (A, M, D)
Default: Blue (A), Red (M), Green (D)
Inner M Style
Customize the inner M phase fib lines and text colors
Default: Black lines for clean visibility
Macro Settings
Adjust macro line color and thickness
Toggle individual macro windows on/off
Important Notes
This indicator is for educational purposes and time-based analysis
It does not provide buy/sell signals
Always use in conjunction with proper price action analysis
Past price behavior during these time windows does not guarantee future results
The AMD framework is one lens for viewing market structure — use it as part of a complete methodology
Credits
This indicator is based on concepts taught by ICT (Inner Circle Trader) and the broader Smart Money Concepts community. The AMD framework, macro timing windows, and weekly profile concepts are derived from this educational methodology.
Timeframe Recommendations
Best viewed on 1-minute to 15-minute charts
Text labels automatically hide on 9-minute and higher timeframes for cleaner visualization
Indicator hides completely on 1-hour and higher timeframes
Changelog
v1.0 - Initial release
Daily AMD phases (4am-4pm EST)
Weekly AMD phases (Monday-Monday)
Inner M phase Fibonacci subdivisions
10 ICT Macro timing windows
Full customization options
Automatic 9-day cleanup
