Asset Premium/Discount Monitor📊 Overview
The Asset Premium/Discount Monitor is a tool for analyzing the relative value between two correlated assets. It measures when one asset is trading at a premium or discount compared to its historical relationship with another asset, helping traders identify potential mean reversion opportunities, or pairs trading opportunities.
🎯 Use Cases
Perfect for analyzing:
NASDAQ:MSTR vs CRYPTO:BTCUSD - MicroStrategy's premium/discount to Bitcoin
NASDAQ:COIN vs BITSTAMP:BTCUSD - Coinbase's relative value to Bitcoin
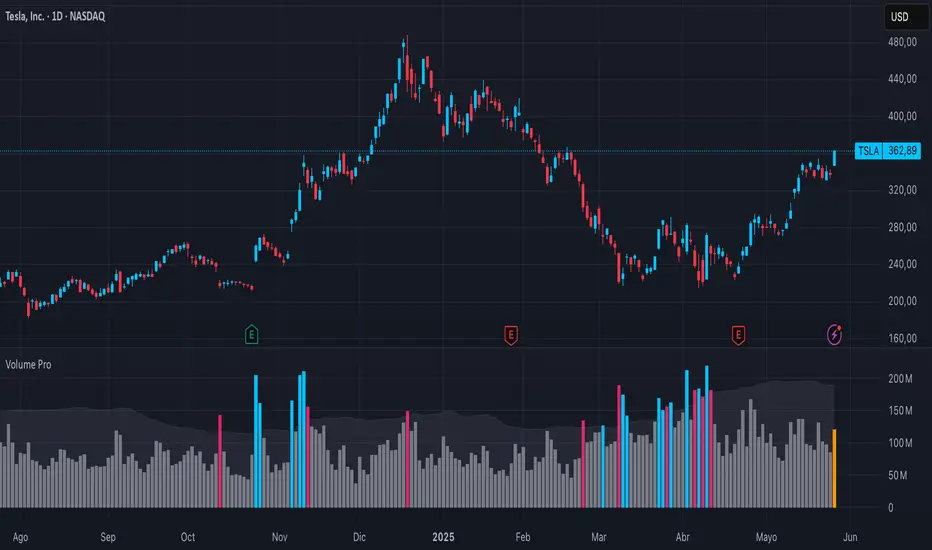
NASDAQ:TSLA vs NASDAQ:QQQ - Tesla's premium to tech sector
Regional banks AMEX:KRE vs AMEX:XLF - Individual bank stocks vs financial sector
Any two correlated assets where relative value matters
Example of a trade: MSTR vs BTC - When indicator shows MSTR at 95% percentile (extreme premium): Short MSTR, Buy BTC. Then exit when the spread reverts to the mean, say 40-60% percentile.
🔧 How It Works
Core Calculation
Ratio Analysis: Calculates the price ratio between your asset and the correlated asset
Historical Baseline: Establishes the "normal" relationship using a 252-day moving average. You can change this.
Premium Measurement: Measures current deviation from historical average as a percentage
Statistical Context: Provides percentile rankings and standard deviation bands
The Math
Premium % = (Current Ratio / Historical Average Ratio - 1) × 100
🎨 Customization Options
Correlated Asset: Choose any symbol for comparison
Lookback Period: Adjust historical baseline (50-1000 days)
Smoothing: Reduce noise with moving average (1-50 days)
Visual Toggles: Show/hide bands and percentile lines
Color Themes: Customize premium/discount colors
📊 Interpretation Guide
Premium/Discount Reading
Positive %: Asset trading above historical relationship (premium)
Negative %: Asset trading below historical relationship (discount)
Near 0%: Asset at fair value relative to correlation
Percentile Ranking
90%+: Near recent highs - potential selling opportunity
10% and below: Near recent lows - potential buying opportunity
25-75%: Normal trading range
Signal Classifications
🔴 SELL PREMIUM: Asset expensive relative to recent range
🟡 Premium Rich: Moderately expensive, monitor for reversal
⚪ NEUTRAL: Fair value territory
🟡 Discount Opportunity: Moderately cheap, potential accumulation zone
🟢 BUY DISCOUNT: Asset cheap relative to recent range
🚨 Built-in Alerts
Extreme Premium Alert: Triggers when percentile > 95%
Extreme Discount Alert: Triggers when percentile < 5%
⚠️ Important Notes
Works best with highly correlated assets
Historical relationships can change - monitor correlation strength
Not investment advice - use as one factor in your analysis
Backtest thoroughly before implementing any strategy
🔄 Updates & Future Features
This indicator will be continuously improved based on user feedback. So... please give me your feedback!
Pine Script®指標