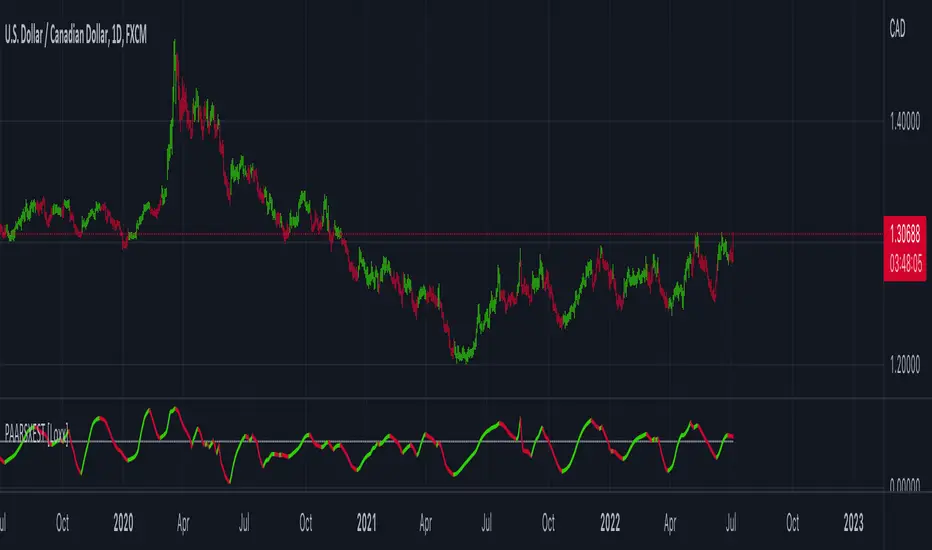
ICT Professional Accumulation DistributionICT Professional Accumulation Distribution (ICT AD) provides a x-ray view into market accumulation and distribution. You can literally see the institutions at work.
The indicator consists of two cumulative lines derived from:
Cumulative change from open to close
Cumulative change from previous close to new open
By overlaying these two cumulative lines, you can detect real meaningful divergence that is narrative based not mathematically derived. You're seeing the real works of algorithms in play working in this area.
These divergences are only useful at extremes (topping or bottoming formations), not while trending. It will probably confirm your suspicion about making a important high or low.
This works on all timeframes but is most impactful on the daily.
How to use:
Method 1:
Enable the option for "Show Open vs Close."
Calculate the shift by subtracting the "Open vs Close" line value from the ICT Accumulation/Distribution (AD) line value.
Look for divergences between the two cumulative lines.
Method 2:
Switch the chart's display mode to "Line View" (representing the Open vs Close).
look for divergences between the line chart and the ICT AD line.
在腳本中搜尋"accumulation"
Up/Down Volume RatioUp/Down Volume Ratio is calculated by summing volume on days when it closes up and divide that total by the volume on days when the stock closed down.
High volume up days are typically a sign of accumulation(buying) by big players, while down days are signs of distribution(selling) by big market players. The Up Down volume ratio takes this assumption and turns it into a tangible number that's easier for the trader to understand. My formula is calculated using the past 50 periods, be warned it will not display a value for stocks with under 50 periods of trading history. This indicator is great for identify accumulation of growth stocks early on in their moves, most of the time you would like a growth stocks U/D value to be above 2, showing institutional sponsorship of a stock.
Up/Down Volume value interpretation:
U/D < 1 -> Bearish outlook, as sellers are in control
U/D = 1 -> Sellers and Buyers are equal
U/D > 1 -> Bullish outlook, as buyers are in control
U/D > 2 -> Bullish outlook, significant accumulation underway by market makers
U/D >= 3 -> MONSTER STOCK ALERT, market makers can not get enough of this stock and are ravenous to buy more
U/D values greater than 2 are rare and typically do not last very long, and U/D >= 3 are extremely rare one example I kind find of a stock's U/D peaking above 3 was Google back in 2005.
MAKE SURE TO HIT THE SETTINGS WHEEL AND CHECK THE BOX NEXT TO PLOT IN ORDER TO GET RID OF THE PLOTTED LINE.
Hoffman A/D BreakoutStudy based on Rob Hoffman's Accumulation/Distribution Breakout strategy.
- Green circle on the top wick indicates a "Distribution" wick
- Red circle on the bottom wick indicates an "Accumulation" wick
- A distribution wick in an uptrend gets marked as a Key Resistance. This is marked with green crosses
- An Accumulation wick in a downtrend gets marked as a Key Support. This is marked with red crosses
- Breaking above the Key Resistance indicates a buy entry. This is marked by a green background.
- Breaking below the Key Support indicates a sell entry. This is marked by a red background
90 Minute Cycles + MTFCredit goes to LuxAlgo for the inspiration from 'Sessions' which allowed users to analyse specific price movements within a user defined period with tools such as trendline, mean and vwap.
Settings
Sessions
Enable Session: Allows to enable or disable all associated elements with a specific user set session.
Session Time: Opening and closing times of the user set session in the hh:mm format.
Range: Highlights the associated session range on the chart.
Ranges Settings
Range Area colour: Set each range to a specific colour.
Range Label: Shows the session label at the mid-point of the session interval.
Usage
By breaking 24hrs in quarters, starting with an Asian range of 18:00 NY time you can visualise the principles of Accumulation, Manipulation, Distribution and Rebalance. Know as AMD or PO3 (Power of Three), the principle is that the Manipulation phase will break above or below the Accumulation, before moving in an apposing direction and then rebalancing. This only works when there is a higher timeframe PD array or liquidity to support an apposing move.
Further to the daily quarters, each one can then be broken down again into 90min cycles. Again, each represents AMD, allowing the user an opportunity to watch for reversals during the 90min manipulation phase.
Note: Ensure the Asian Cycle always begins at 18:00 NY time.
The example shows that the 90min cycle occurs, followed by an apposing move away in price action
Here is the Daily cycle, highlighting the Manipulation phase.
Enjoy!
Trend IdentifierTrend Identifier for 1D BTC.USD
It smoothens a closely following moving average into a polynomial like plot.
And assumes 4 stage cycles based on the first and second derivatives.
Green: Bull / Exponential Rise
Yellow: Distribution
Red: Bear / Exponential Drop
Blue: Accumulation
Red --> Blue --> Green: indicates the start of a bull market
Green --> Yellow --> Red: indicates the start of a bear market
Green --> Yellow: Start of a distribution phase, take profits
Red --> Blue: Start of a accumulation phase, DCA
Long Term Heat/Volatility - Accumulation/Distribution v1This is a strategy specifically made for 1D BTC/USD with the aim of capturing cycle tops and bottoms. It's mainly based on two indicators: 21d average of ATR (volatility) and (BTC.price - 180d sma)/BTC.price (heat). The strategy only signals buys or sells after occurrences of high volatility, followed by extremely high or low heat values. It's optimized for utilizing accumulation and distribution at lower and higher prices respectively with respect to last 14 days. 2nd version will include dynamic dollar cost averaging during the accumulation and distribution periods.
Chaikin Volume Accumulation Oscillator (VAO)The Volume Accumulation Oscillator is a volume momentum indicator developed by Mark Chaikin (177E, 77th Street, New York, NY
10021). Their simplest form is a sliding sum of daily volumes divided by the difference between the daily closing price and the midpoint of the daily price range.
It is a sensitive short term oscillator, the values of which are obtained by subtracting the value of the previous day of its own ESS from the cumulative sum of the cumulative volume
length of 2 days (for the purpose of normalization, the result is then divided by the value 2-day ESS for the previous day)
Analysis of historical data shows that volume accumulation indicator can be an effective tool, especially on Long
positions.
Price Moving Average Ratio & PercentileIntroducing the Price Moving Average Ratio & Percentile indicator
A simple indicator which calculates :
The ratio between a chosen source price and a user defined moving average ( PMAR ) or
The percentile of the ratio between the chosen source price and a user defined moving average over an adjustable lookback period ( PMARP )
It then displays either the PMAR or PMARP as a line plot with optional user defined signal moving average.
It also plots an optional Visual Alert Level line and background signal bars.
Indicator Settings
Main Properties :
Source Price .. choice of price values or external value from another indicator ( default )
Line Plot Type .. choice between PMAR or PMARP ( default PMAR )
Price Moving Average Ratio Settings :
PMAR Length ..The time period to be used in calculating the Moving Average for the Price Moving Average Ratio and the PMAR component of the PMARP. ( default )
PMAR Type ..The type of Moving Average which creates the MA for the Price Moving Average Ratio and the PMAR component of the PMARP. ( default )
Price Moving Average Ratio Percentile Settings :
PMARP Lookback .. The lookback period to be used in calculating the Price Moving Average Ratio Percentile.
Line Plot Color Settings :
Gives a choice between a user defined solid color, and a choice of "Blue Green Red", or "Blue Red" spectrum palettes.
Signal Moving Average Settings :
Signal MA Length ..The time period to be used in calculating the Signal Moving Average for the Line Plot ( default )
Signal MA Type ..The type of Moving Average which creates the Signal Moving Average for the Line Plot ( default )
Signal Moving Average Color Settings :
Gives a choice between a user defined solid color, and a choice of "Blue Green Red", or "Blue Red" spectrum palettes.
Visual Alert Level Settings :
Alert level .. Level which activates the background signal bars ( default )
Typical Use case for the Price Moving Average Ratio
Traders and Technical Analysts will typically use the PMAR as an accumulation signal generator.
To do this....
Set a level below 1 where it has been historically profitable to accumulate the asset in question on the chosen timeframe.
Typical Use case for the Price Moving Average Ratio Percentile
Traders and Technical Analysts will look at the PMARP to judge how far away current PA is away from the defined MA based on a statistical measure of the lookback period in a percentile format.
Traders and Technical Analysts will typically use the PMAR as an accumulation signal generator.
To do this...
Set a low level where it has been historically profitable to accumulate the asset in question on the chosen timeframe.
Note : The default settings are specifically set up for use on the daily timeframe with a MA of 140 equating (approximately) to the 20 week moving average.
This is not a stand alone indicator and should be used in combination with volatility and momentum indicators for a more effective trading edge.
Bollinger Bands V2 [Super Trend]################################## Anglais ######################################
With the News Bollinger Bands V2 , you can choose the source of the color (Color with Price or Color with the Super Trend ATR).
You can also view the Super Trend on the chart and the configure.
this allows you to quickly identify trends and the acceleration phase and accumulation
Sorry for my basic English
//J.Dow
################################## Français ######################################
Avec les Nouvelles Bollinger Bands V2 , vous pouvez choisir la source de la couleur ( couleur avec le prix ou la couleur avec le Super Tendance ATR ) .
Vous pouvez aussi consulter le Super Tendance sur le graphique et le configure.
cela vous permet d'identifier rapidement les tendances et la phase d'accélération et d'accumulation
//J.Dow
MATIC Accumulation Strategy - Buy/Sell ArrowsThis is a technical indicator-based strategy designed to:
✅ Identify optimal accumulation (buy) zones
🚫 Close positions when conditions weaken (conservative exit)
📊 Visually guide trader with clear arrows and trend overlays
Inverse Fisher Oscillator [BigBeluga]The Inverse Fisher Oscillator is a powerful tool for identifying market trends and potential reversal points by applying the Inverse Fisher Transform to normalized price data. This indicator plots multiple smoothed oscillators, each color-coded to signify their relation to dynamic volatility bands. Additionally, the Butterworth filter is incorporated to further refine trend signals. The Inverse Fisher Oscillator offers traders a visually appealing and insightful approach to trend analysis and market direction detection.
🔵 KEY FEATURES
● Inverse Fisher Oscillator Visualization
Multiple Oscillators : The indicator calculates and plots six different Inverse Fisher Oscillators, each smoothed at increasing levels to provide a layered view of price momentum.
Color-Coded Signals : The oscillator lines are color-coded based on their relation to the volatility bands—green for bullish momentum, red for bearish momentum, and yellow for neutral movements.
● Butterworth Filter Integration
Filtering : The Butterworth filter is applied to mid-line Bands to reduce noise, allowing for clearer trend detection.
// Calculate constants for the Butterworth filter
float piPrd = math.pi / mid_len
float g = math.sqrt(2)
float a1 = math.exp(-g * piPrd)
float b1 = 2 * a1 * math.cos(g * piPrd)
float coef2 = b1
float coef3 = -a1 * a1
float coef1 = (1 - b1 + a1 * a1) / 4
// Source data for the Butterworth filter
float source = ifish // The first inverse Fisher Oscillator is used as the source
// Previous source and butter filter values
var float butter = na // Initialize the 'butter' variable
// Handle null values using the nz function
float prevB1 = nz(butter , source) // Use 'source' as a fallback if butter is null
float prevB2 = nz(butter , source) // Use 'source' as a fallback if butter is null
// Calculate the Butterworth filter value
butter := coef1 * (source + (2 * source ) + source ) + (coef2 * prevB1) + (coef3 * prevB2)
● Numbered Signal Marks
Signal Markers : The indicator plots numbered signals on the chart when an oscillator crosses above the upper volatility band or below the lower volatility band.
Numbered Lines : Numbers correspond to the different oscillators (1-6), helping traders easily identify which smoothing level generated the signal.
Visual Cues : The signals are color-coded—green for bullish crossovers and red for bearish crossunders—providing clear visual cues for trend accumulation phases.
Mid-Line Option : Traders can choose between plotting the Butterworth filter as a dynamic mid-line or simply displaying it as part of the bands.
Volatility Bands : Dynamic volatility bands provide additional context for interpreting the strength and sustainability of trends.
● Dashboard Display
Real-Time Market Trend Overview : The dashboard in the bottom-right corner of the chart displays the market trend based on the Inverse Fisher Oscillator for six different smoothing levels, providing a clear visual summary of market direction.
Direction Symbols : Directional symbols (up, down, or neutral) are displayed in the dashboard, color-coded to represent bullish, bearish, or neutral momentum.
Current Price Display : The dashboard also shows the current price and highlights whether it is above or below the opening price.
🔵 HOW TO USE
● Identifying Trend Reversals
Bullish Reversals : When the oscillators short period lines start to cross above the upper volatility band (green), it indicates potential bullish momentum.
Bearish Reversals : When the oscillator crosses below the lower volatility band (red), it signals potential bearish momentum.
Neutral Signals : When the oscillator remains within the bands (yellow), it suggests that the market is in a neutral or consolidating state. Traders may choose to wait for a clearer trend signal.
● Using the Dashboard for Trend Overview
Market Trend Summary : The dashboard provides a quick overview of market direction across six different smoothing levels. Green arrows indicate bullish momentum, red arrows indicate bearish momentum, and wavy lines suggest neutrality.
Price Context : The dashboard also displays the current price, helping traders quickly assess whether the price is moving in the expected direction relative to their trend analysis.
● Volatility Band Interpretation
Volatility-Based Signals : Pay attention to how the oscillators interact with the volatility bands. Strong trends will often result in oscillators staying above or below the bands, while weaker trends or consolidations will see oscillators hovering within the bands.
🔵 CUSTOMIZATION
Length and Smoothing : Adjust the length and smoothing parameters to fit different market conditions and timeframes.
Bands Multiplier : Customize the multiplier for the volatility bands to make them more or less sensitive to price changes.
Mid-Line Type : Choose whether to display the Butterworth filter as a mid-line or incorporate it into the volatility bands.
Signal Markers : Toggle on or off the number markers for signal crossovers, making it easier to identify key entry and exit points.
🔵 CONCLUSION
The Inverse Fisher Oscillator combines the power of the Inverse Fisher Transform and the Butterworth filter to provide a sophisticated approach to trend and reversal detection. By leveraging volatility-based analysis and visually intuitive signals, this indicator helps traders spot potential entry and exit points with greater clarity. The customizable dashboard display adds further value, offering a real-time summary of market conditions to enhance decision-making. Use this tool in conjunction with other technical analysis methods to develop a well-rounded trading strategy.
Capital Accumulation Plan (CAP) Simulator 2.0Description:
This indicator serves as a simulation tool for the Capital Accumulation Plan (CAP). The CAP is an investment strategy involving regular contributions of a fixed amount at consistent intervals, regardless of market fluctuations. This simulator allows you to visualize how your invested capital might grow over time, considering a fixed monthly investment in a given financial instrument.
How to Use:
Customize the monthly investment amount, the day of the month for the investment, and the simulation period. Also, input the percentage of taxation on potential dividends and the Total Expense Ratio (TER) of the financial instrument. The indicator calculates the portfolio value over time, the invested capital, and the average cost. If applicable, it also calculates the dividend amounts over time and the corresponding taxes to be paid.
The indicator displays how these metrics would change over time following the PAC strategy.
Important Notes:
Apply exclusively to the daily chart; a fix for the chosen day absence will be implemented shortly.
TTP Big Whale ExplorerThe Big Whale Explorer is an indicator that looks into the ratio of large wallets deposits vs withdrawals.
Whales tend to sale their holding when they transfer their holdings into exchanges and they tend to hold when they withdraw.
In this overlay indicator you'll be able to see in an oscillator format the moves of large wallets.
The moves above 1.5 turn into red symbolising that they are starting to distribute. This can eventually have an impact in the price by causing anything from a mild pullback to a considerable crash depending on how much is being actually sold into the market.
Moves below 0.5 mean that the large whales are heavily accumulating and withdrawing. During these periods price could still pullback or even crash but eventually the accumulation can take prices to new highs.
Instructions:
1) Load INDEX:BTCUSD or BNC:BLX to get the most historic data as possible
2) use the daily timeframe
3) load the indicator into the chart
Volume accumulation on past range [TCS] | VTAThe indicator calculates buy and sell volume values for different look-back periods based on the high, low, close, and tick volume data of the chart.
The range can be selected by adding the end date and the look-back period, which starts from the end date. It can calculate a maximum of 100 candlesticks.
The calculated buy and sell volume values are stored in separate variables, representing cumulative volume values over their respective look-back periods. It's important to note that the provided code calculates the buy and sell volume values individually for each look-back period and then sums them.
This information can be useful in understanding who is in control of the market during the selected range. The 'heatmap' is particularly helpful in identifying areas of high or low trading activity, which can help define support and resistance levels.
For example, if there is a greater accumulation of bullish volume than bearish volume and a break occurs in a resistance area, it may present a good entry opportunity.
Please note that this indicator is for educational purposes only and should not be used for trading without further testing and analysis.
Trend Identifier StrategyTrend Identifier Strategy for 1D BTC.USD
The indicator smoothens a closely following moving average into a polynomial like plot and assumes 4 staged cycles based on the first and the second derivatives. This is an optimized strategy for long term buying and selling with a Sortino Ratio above 3. It is designed to be a more profitable alternative to HODLing. It can be combined with 'Accumulation/Distribution Bands & Signals' and 'Exponential Top and Bottom Finder'.
Money Flow LineWhat is this? The Money Flow Line (MFL) indicator is at its core a more even-tempered version of the Price-Volume-Trend (PVT). The primary difference is the usage of `hlc3` ((high + low + close) / 3) rather than `close` to use the "typical price" that it critical to the calculation of the Money Flow Index (MFI). Other similar indicators include the Accumulation Distribution Line (ADL) and the On Balance Volume (OBV) indicators. The purpose of all of these indicators is to attempt to measure the strength of the money flow by combining price and volume into a rolling measurement that can be compared over time to look for confirmations and divergences.
The indicator also includes an optional averaging (smoothing) line that can be enabled in the display settings. Enabling this smoothing line with a desired period allows for simpler trend comparisons and also allows the user to view how far the line has diverged from the mean. This creates an indicator very similar to Elder's Force Index (EFI), which is also a `close * volume` style indicator.
Why is this important? After an extreme movement or volume spike the MFI will "snap back" sharply as that bar eventually exits the set period. This produces a result that is meaningless and skews the indicator away from the market structure. Because of this behavior, range clamping, and the loss of comparative history I prefer to shy away from oscillator style indicators. The Money Flow Line instead gives you all of the history so you may compare and see the broader trend without sharp snaps in history based on an arbitrary period setting.
Why is this better? This produces a no-lag indicator that isn't subject to the harsh skewing produced by they Money Flow Index's period calculation. It doesn't lose history like MFI or EFI, is clear about the trend direction, and prefers a "typical price" (averaging the entire range of each bar) rather than whatever happens to be the closing price for a given bar.
How can I use it? The indicator is attempting to measure supply and demand in the markets. No indicator is perfect, but we can use all of the information we have available to make our best predictions. There are only 3 pieces of data the market gives us:
1. Price (action)
2. Volume
3. Time
The Money Flow Line combines all of these data points into a readable rolling data set that attempts to show subtle balance of power shifts based on changes in volume and "smart money" (or "big money") stepping in and out of the picture. Much like PVT, we look for the same things:
- Trend Identification: an up or down trend appears in the MFL
- Confirmations: the MFL agrees with price action in direction and magnitude
- Divergence: the MFL disagrees with price action, indicating a reversal may be coming soon
When applying the smoothing line we can also look for similar things we would with EFI. The primary case would be to look for the MFL to jump very far away from the mean (a high magnitude movement) which indicates that price may be reverting towards the mean soon (a "mean reversion"). On the other hand, it may indicate strength in the current price direction. All of these predictions depend heavily on price action and market structure. Good luck!
Williams Accumulation/DistributionThis is an indicator described by Larry Williams in one of his books. Larry won the 1987 World Cup Championship of Futures Trading, where he turned $10,000 to over $1,100,000 in a 12-month competition with real money.
Larry used this indicator to track divergences between price action and volume, which he called patterns of accumulation (bullish divergence) and distribution(bearish divergence). Its logic is similar to On Balance Volume(OBV), where it accumulates up and down volume in a single line, but also takes into account the size of the candle in its calculation, by taking the difference between the open and close, and the high and the low.
Enjoy!
LebahFX AccDist_CandlesLebahFX Indicator that showing Accumulation and Distribution Signal in HTF Candlestick
Volume Buzz 2.0Volume Buzz/Volume Run Rate as seen on TC2000 and MarketSmith respectively.
Basically, the volume buzz tells you what percentage over average(100 time period moving average) the volume traded was. You can use this indicator to more readily identify above-average trading volume and accumulation days on charts. The percentage will show up in the top left corner, make sure to click the settings button and uncheck the second box(left of plot) in order to get rid of the chart line.
Pictured above, a chart with the volume on the bottom along with the 50-day moving average applied to volume. As you can see in the top left it will tell you the "volume buzz" of that day, telling you what days were on above-average volume and how above-average those days were.
Chaikin Oscillator (ADL Oscillator) [UTS]The Chaikin Oscillator is basically an oscillator version of the Accumulation / Distribution Index, also known as ADL Indicator.
General Usage
The indicator runs both above and below zero, made to denote whether an asset is in a bullish (above zero) or bearish (below zero) trend.
It can be used to confirm trends, as well as spot possible trading signals due to divergences.
A benefit of the oscillator version is that it can produce LONG or SHORT signals on zero line cross.
Moving Averages
4 different Moving Averages are available:
EMA (Exponential Moving Average)
SMA (Simple Moving Average)
VWMA (Volume Weighted Moving Average)
WMA (Weighted Moving Average)
PriceDivergence (ps4)This script implements price divergence module using signals from several factors like:
RSI, RSI Stochastic, MACD, Volume MA, Accumulation/Distribution, Fisher Transform and CCI
IO_William's Variable Accumulation DistributionThis is an academic version of William's Variable Accumulation Distribution(WVAD) smoothed with a weighted moving average for measuring correlation of price with intraday volume
Normalized Accumulation/Distribution OscillatorThis is the oscillator version of the Accumulation/Distribution volume indicator. The oscillator is normalized by n-period volume moving sum. The value oscillates between 1 and -1. One way to use this oscillator is to identify the divergence between price and oscillator reading in trending market, and to spot potential reversal.