Multi Timeframe ADX and DI w/ AlertsThis script is based off the public DMI code and used to get a quick visual of trend and direction across 3 different timeframes. Alert conditions have been setup for trend changes to bull/bear for all 3 timeframes. This script is meant to pull together the concepts of multi-time frame indicators, custom functions, and custom alert conditions.
The primary instructions for this script was to find a version of the ADX Indicator and give it the same treatment as we did with the Heiken Ashi demo (displaying green/red/gray circles to indicate trend and direction) over a configurable time frame. Display a matrix of each timeframe and the corresponding directional color (green=bull, red=bear, gray=non-trending). Have it produce an alert when the state of indicator changes to either bull or bear.
在腳本中搜尋"adx"

Volatility Traders Minds Strategy (VTM Strategy)Volatility Traders Minds Strategy (VTM Strategy)
I found this startegy on internet, with a video explaingin how it works.
Conditions for entry:
1 - Candles must to be above or bellow the 48 MA (Yellow line)
2 - Candles must to break the middle of bollinger bands
3 - Macd must to be above or bellow zero level;
4 - ADX must to be above 25 level
Credits to who developed this startegy (google it).
Thanks to all pinescripters mentined in the code for their snippets.
It could be improved with stop loss based on ATR etc.
I have also a study with alerts.
Please use comment section for any feedback or contact me if you need support.

DMI-adxNothing special here
I just play with the formula of ADX and DMI that give this indicator which is combination of both
above zero =bullish
bellow zero =bearish
seems nice to spot trending

SuPeR-RePaNoCHa #2TP#This is the last of the 'RePaNoCHa' script for Automatic Trading ;-) ... This time with two take profits ...
It Use 6 indicators + volume:
-JURIK MOVING AVERAGE
-RANGE FILTER
-ADX
-PARABOLIC SAR
-RSI + VOLUME WEIGHTED
-MACD
-VOLUME
To close the position you can choose between 2 Take Profit and the amount to use on each one.
You can transform it yourself into 'study' mode to get alerts.
Take Profits can be generated from the same entry, (syntax example on the script) so the fees will be lower (0.04 + 0.02 / 2 = 0.03).
Settings for BINANCE FUTURES BTC:USDT
Enjoy...

$ SuPeR-RePaNoCHa $ [Alerts]Script for automatic trading (Alerts). This is the second part of the previous RePanoCHa script but with Take Profit.
It Use 6 indicators + volume:
-JURIK MOVING AVERAGE
-RANGE FILTER (DONOVAN WALL)
-ADX (ORIGINAL VERSION)
-PARABOLIC SAR
-RSI + VOLUME WEIGHTED (LAZYBEAR)
-MACD
-VOLUME
To close the position you can choose between Take Profit only, Trailing Stop only or both at the same time.
Example of bot syntax: (alerts once per bar)
LONG | e=BINANCEFUTURES a=ACCOUNT s=BTCUSDT c=order | delay=1 | e=BINANCEFUTURES a=ACCOUNT s=BTCUSDT c=position b=short t=market ro=1 | delay=1 | e=BINANCEFUTURES a=ACCOUNT s=BTCUSDT b=long q=100% t=market | delay=1 | e=BINANCEFUTURES a=ACCOUNT s=BTCUSDT c=position b=long p=0.7% q=50% t=post ro=1
SHORT | e=BINANCEFUTURES a=ACCOUNT s=BTCUSDT c=order | delay=1 | e=BINANCEFUTURES a=ACCOUNT s=BTCUSDT c=position b=long t=market ro=1 | delay=1 | e=BINANCEFUTURES a=ACCOUNT s=BTCUSDT b=short q=100% t=market | delay=1 | e=BINANCEFUTURES a=ACCOUNT s=BTCUSDT c=position b=short p=-0.7% q=50% t=post ro=1
LONG TP | e=BINANCEFUTURES a=ACCOUNT s=BTCUSDT c=position q=50% t=market ro=1 (if you set the TP from entry this alert is not necessary)
SHORT TP | e=BINANCEFUTURES a=ACCOUNT s=BTCUSDT c=position q=50% t=market ro=1 (if you set the TP from entry this alert is not necessary)
LONG TS | e=BINANCEFUTURES a=ACCOUNT s=BTCUSDT c=position q=10% t=market // (alerts once per minute)
SHORT TS | e=BINANCEFUTURES a=ACCOUNT s=BTCUSDT c=position q=10% t=market // (alerts once per minute)
XLONG/STOP-LOSS | e=BINANCEFUTURES a=ACCOUNT s=BTCUSDT c=order | delay=1 | e=BINANCEFUTURES a=ACCOUNT s=BTCUSDT c=position b=long t=market ro=1
XSHORT/STOP-LOSS | e=BINANCEFUTURES a=ACCOUNT s=BTCUSDT c=order | delay=1 | e=BINANCEFUTURES a=ACCOUNT s=BTCUSDT c=position b=short t=market ro=1


NOT-ONLY-SHORTThis script is the same as NOT-ONLY-LONG but without the security() function.
It use the following indicators: RMI + ADX + RSI + ICHIMOKU cloud only.
The fuchsia dot is the average price of the positions. The Take Profit is calculated from there.
It does not have Stop Loss, instead it makes a re-entry to try to improve the liquidation price.
Enjoy!

ONLY LONG V4 [Alerts]Let's try the Version 4 ...
This script is only for long positions.
It's based on the conjunction of RMI + ADX + RSI for entries and only with Take Profit to close the position.
It doesn't have security (), nor Heikin Ashi, so the Backtest is Real.
Use always 'Once per bar'.
It doesn't repaint absolutely nothing at all.
Timeframe: 15 minutes
Have fun improving it ...
Enjoy!
Tips ...
BTC: 3LEUP3WjQctdbFjBavcmRGUVRBje8bptCd
ETH: 0x518AAD4746912ae506c82B747488306186c4d546

Zero Lag ADX [jwammo12]This uses Zero lag principles to ADX. The cyan line is the zero lag line and the grey line is the traditional ADX


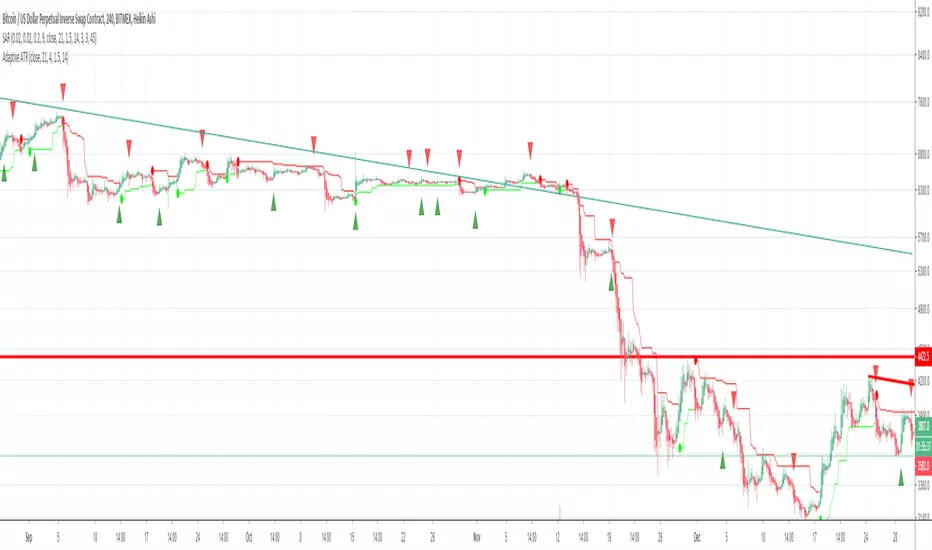
DMI ADX TREND 2.0 (edit by GeertVD)Edit of the popular script by @TraderR0BERT
New features:
- horizontal colored areas, indication weak/medium/strong trend
- vertical bars, signaling trend/momentum changes
- DI+ vs DI- contraction/expansion histogram (to measure the DI volatility)

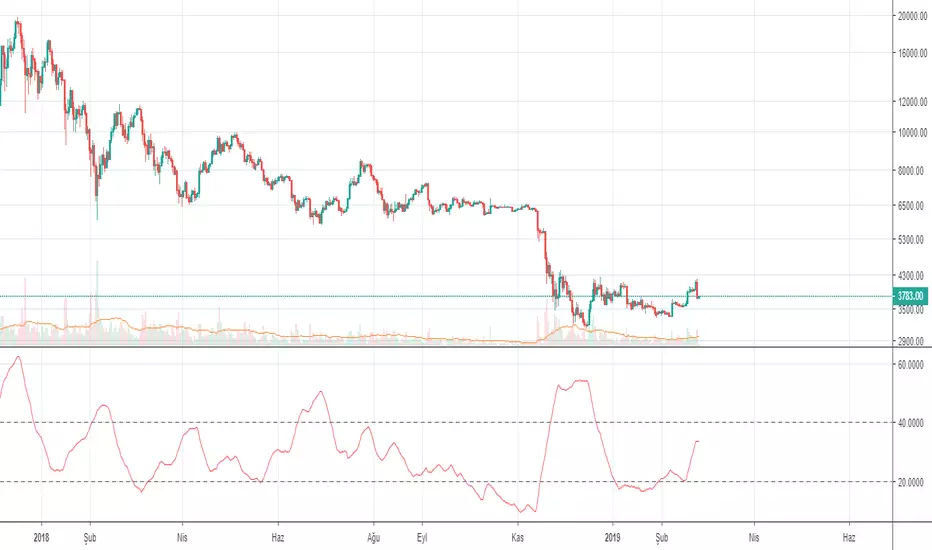
Slow Stochastic + ADX exhaustationSlow stochastic with ADX exhaustation and sell/entry points as orange/green circles.
This is a script I remade from Marco Valente's "RSI Combo" and Oshri17 "Slow stochastic".
Credits and thanks to them for sharing, I just expanded the diversity ^^
Hope you enjoy phit! ;D
5 in 1 (rsi,aroon,stoch,macd,adx di)5 indicators in 1.
You can choose wich one you want to see (rsi ,aroon,macd,stoch or adx di)
Usefull to save space for other indicators

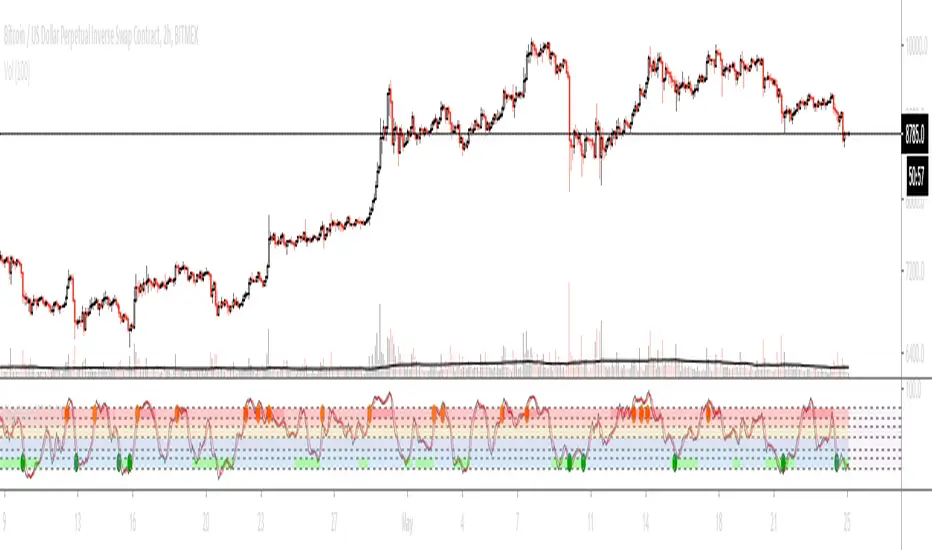
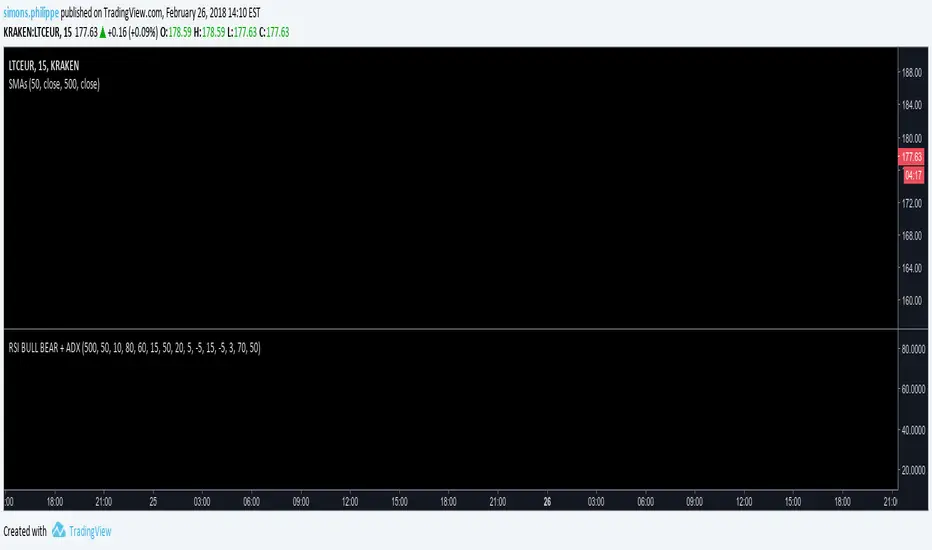
RSI BULL BEAR + ADXlong-signal when crossig the lower threshold
short-signal when crossing the upper threshold
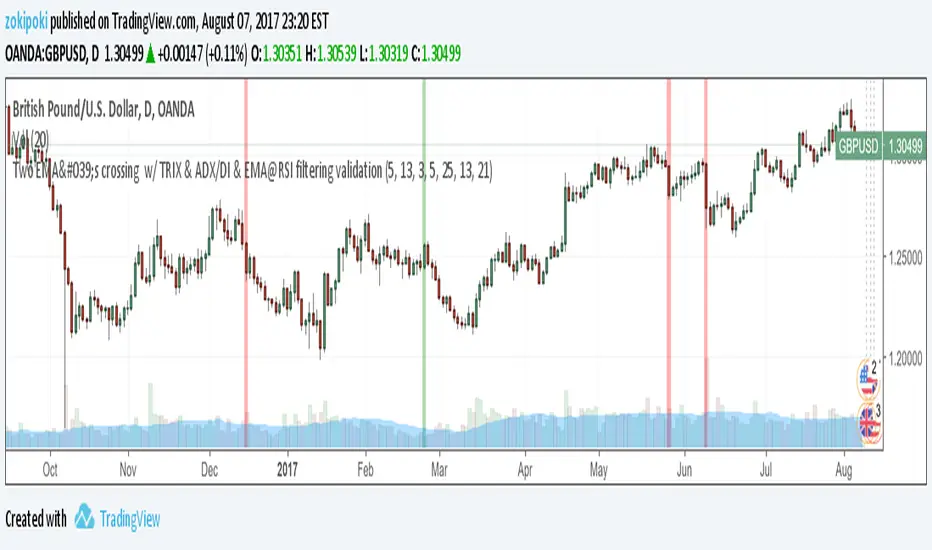
Two EMA's crossing w/ TRIX & ADX/DI & EMA@RSI filteringThe initial idea for the "X-candle" script is from @nmike, and the requirement was to mark the bar with positive or negative as EMA(5) and EMA(13) cross. Later, it was requested to filter the above with Trix(3) so it just crosses the "zero" line and goes in either positive or negative territory - confirming the EMA's crossing.
In addition, one of my ideas was to integrate 2 more rules, and the final looked something like this ...
The script marks the candle vertical background with green or red when all 4 rules are satisfied:
1. Between the current and previous bar has to be a cross of the EMA lines (by default: EMA 5 and EMA 13)
2. The current bar is the first or second bar crossing the zero TRIX line ... going in either Positive or Negative range, confirming the first rule
3. ADX is above threshold 25 & DI is also valid (higher than the opposite DI) ... confirming trend direction and strength
4. EMA(21) on top of RSI(13), one of my favorites, so it has to be valid also
At the end the script did extensive filtering, and it does filter some good ones also. Needs more work, less filtering, more tolerance, and new rules. All of the above indicator parameters can be modified easily, so anybody can play with. If you find some better indicator parameters that will provide a more efficient filtering, please let us know and drop me a note.
Thanks!
Glory Hole with SMA + ADX - StrategyHere you get a script with the rules for "Glory Hole"-Strategy from Linda Raschke.
In Addition, I choose the SMA - not the EMA for this script.
MY RECOMMONDATION:
If you get a trade Signal, then set an sell- oder buy-order on the high or low. If the next bar doesn't touch into the trade, then delete your order.
Have fun and good look.

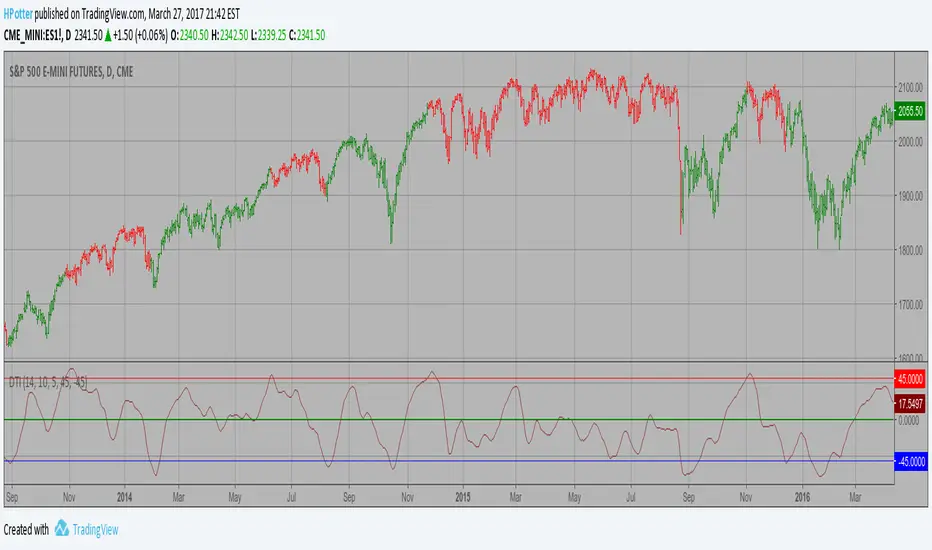
Directional Trend Index (DTI) This technique was described by William Blau in his book "Momentum,
Direction and Divergence" (1995). His book focuses on three key aspects
of trading: momentum, direction and divergence. Blau, who was an electrical
engineer before becoming a trader, thoroughly examines the relationship between
price and momentum in step-by-step examples. From this grounding, he then looks
at the deficiencies in other oscillators and introduces some innovative techniques,
including a fresh twist on Stochastics. On directional issues, he analyzes the
intricacies of ADX and offers a unique approach to help define trending and
non-trending periods.
Directional Trend Index is an indicator similar to DM+ developed by Welles Wilder.
The DM+ (a part of Directional Movement System which includes both DM+ and
DM- indicators) indicator helps determine if a security is "trending." William
Blau added to it a zeroline, relative to which the indicator is deemed positive or
negative. A stable uptrend is a period when the DTI value is positive and rising, a
downtrend when it is negative and falling.
You can change long to short in the Input Settings
Please, use it only for learning or paper trading. Do not for real trading
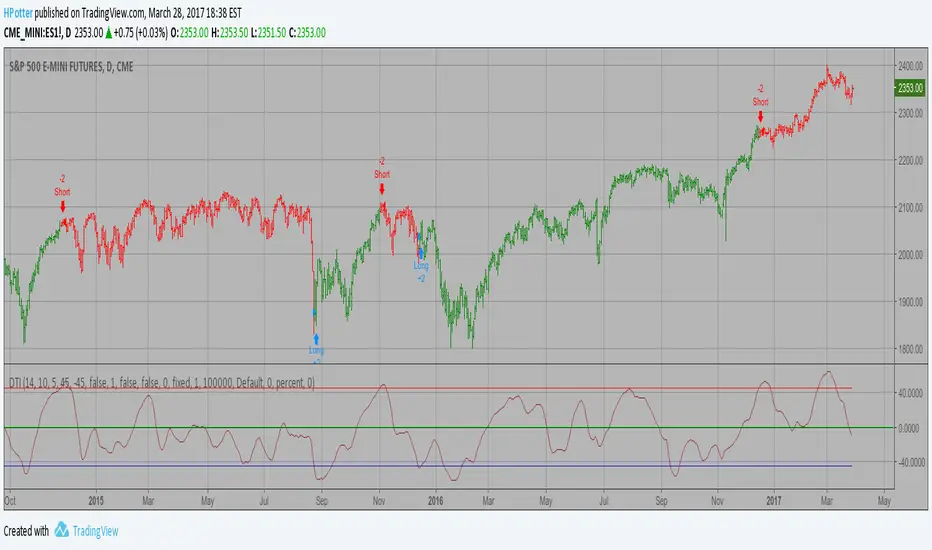
Directional Trend Index (DTI) Strategy This technique was described by William Blau in his book "Momentum,
Direction and Divergence" (1995). His book focuses on three key aspects
of trading: momentum, direction and divergence. Blau, who was an electrical
engineer before becoming a trader, thoroughly examines the relationship between
price and momentum in step-by-step examples. From this grounding, he then looks
at the deficiencies in other oscillators and introduces some innovative techniques,
including a fresh twist on Stochastics. On directional issues, he analyzes the
intricacies of ADX and offers a unique approach to help define trending and
non-trending periods.
Directional Trend Index is an indicator similar to DM+ developed by Welles Wilder.
The DM+ (a part of Directional Movement System which includes both DM+ and
DM- indicators) indicator helps determine if a security is "trending." William
Blau added to it a zeroline, relative to which the indicator is deemed positive or
negative. A stable uptrend is a period when the DTI value is positive and rising, a
downtrend when it is negative and falling.
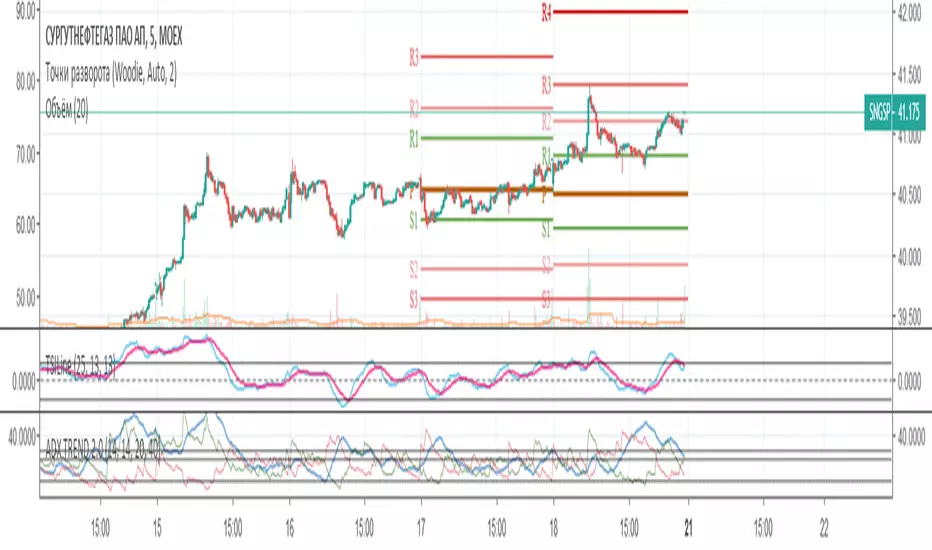
Intraday TS ,BB + Buy/Sell +Squeeze Mom.+ adx-dmiIntraday 5+ min indicator/strategy. Mix of indicator as BB, Ema , Roc , adx/dmi with buy and TP/SL point. All in 1 indicator easy to use . Just look the color chnge and the shape add the the bars
