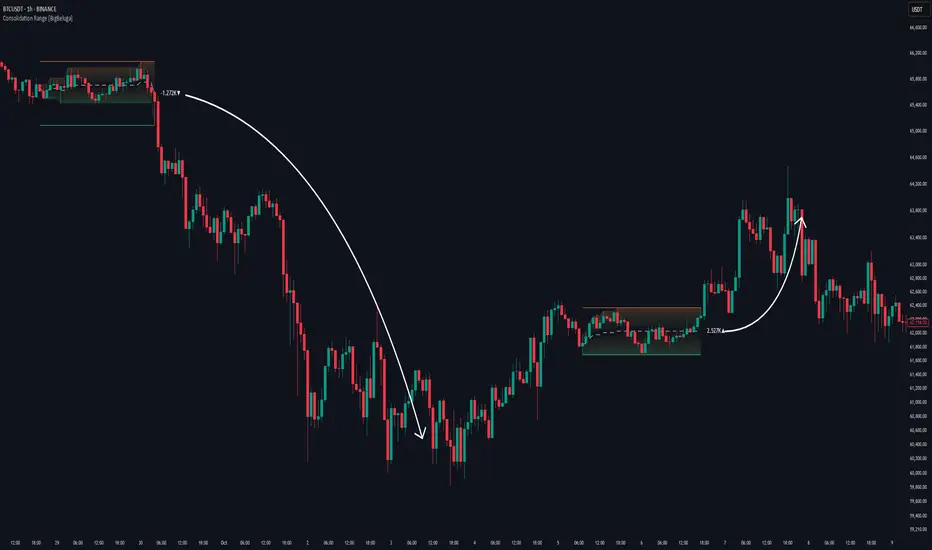
Absolute Strength Histogram v2 | jhv2 changes the way the histogram is plotted.
Histogram shows the strength and can be used to identify trending or ranging periods.
在腳本中搜尋"adx"
Absolute Strength Histogram | jhOriginal ASH code from alexgrover
Some changes:
- Change the price to SMA with Period of 1 with reference to the original MT4 code
- Added a few more MAs
MultiIndicatorThis is just a bunch of useful funtions and
a recommenation how to construct a multiindicator for the sake of economy :))
RePaNoCHa V4 [Backtest]This is the Backtest version of the previous one.
It's important to correctly set the "TICKS / PIPS CORRECTION" parameter in each different chart.
Enjoy!
RePaNoCHa V4 [Alerts]Script for automatic trading with Alerts.
LG --> Long (green: not confirmed) (lime: confirmed)
ST --> Short (maroon: not confirmed) (red: confirmed)
TS --> Trailing Stop
xL --> Close Long Position
xS --> Close Short Position
SL --> Stop Loss
The trailing stop closes the trade if the price changes direction by a specified percentage or offset. There is no ideal distance because markets and price are always changing and we know that is impossible to exit on the top or bottom. This script interpolate the trailing Stop Offset with profit, higher profit --> higher Trailing Stop Offset. Despite this, it's difficult to catch the price but not impossible. It has a TS delay too. It take a snapshot every X seconds, if the TS is activated the alert is triggered, otherwise the price keeps fluctuating until a new snapshot.
It can be easily converted to Backtest. Just delete "//" on the corresponding part.
Default settings for XBT:USD at 1H.
Mossy PopMossy Pop is a variation on the CM Chris Moody Pop 1 that is on the public library.
Bars are colored to show when the Pop is red crossing over the blue line turning bullish (Green Buy Bar)
or when it is overbought in green turning into blue going bearish (Red Sell Bar)
Use with other indicators but can work well on confirming a position on its own.
I find it worked best with Heikin Ashi but candles are fine.
Use with Mossy ADX DI for quick scalping profit and to confirm Buy/Sell signals!
Squeeze - Expansion Indicator - JDThe Squeeze-Expansion Indicator or SE indicator shows the contraction and expansion of the volatility of the price,
it does this by evaluating the movement of the standard deviations of the price.
This indicator can be use in a similar way to ADX and momentum indicators and can potentially keep you out of NO-TRADE zones
It can also be used as an exit indicator to show when a move has likely lost momentum.
color coding of the SE indicator
-the BLUE area indicates the AMOUNT of SQUEEZE of the price deviations
-the ORANGE area indicates the AMOUNT of EXPANSION of the price deviations
-the highlighted (BLUE) line indicate SQUEEZE tightening
-the highlighted (GREEN and RED) lines indicate the RELEASE
- BLUE line rising indicates a likely bounce back if the price
- GREEN/RED line rising indicates a likely continuation/breakout of the price
JD.
#NotTradingAdvice
#DYOR
I build thes indicators for myself and provide them open source, to use for free to use and improve upon,
as I believe the best way to learn is toghether.
RSI BULL BEAR + ADXCustom values used in many markets that I trade in giving optimal profits across the board. Great for trading in a bearish market with the trend being a sideways pattern.
Willams %R with 13 EMA and 13 SMAThis is standard Williams %R originally written by another user that I modified. Credit to him whose name escapes me at the moment. The green line is 13EMA and red line is 13SMA (offset by 2 for timing trades). Great for very quick trades/day trades. Green over red = long. Red over Green = short.
Beware: this is still a choppy indicator. You'll need to use it with the Ichimoku lagging span, chop indiicator, adx, or some other method of avoiding getting chopped to death trying to take every signal.
Hucklekiwi Pip - HLHB Trend-Catcher SystemThe strategy was authored by Hucklekiwi Pip back in 2015 and is still being updated today. She says that the system was designed to simply catch short-term forex trends. At its heart, the system is a simple EMA crossover strategy with a couple of other indicators used for confirming entries.
Strategy Rules
See her original post here:
www.babypips.com
Be sure to check out the updates and tweaks over the years!
HOW TO USE
For full information on how to use this strategy and how to correctly set the exit time, see this post:
backtest-rookies.com
Tangram Bot 2 - SmartbotPrimeira Versão do Script Tangram Bot 2 da Smartbot para tradingview.
A intenção é agilizar e fazer um teste prévio e rápido do setup.
O resultado indicado aqui jamais corresponderá a um resultado real. É apenas uma ferramenta de estudo.
Ainda falta fazer e melhorar a parte de gestão de risco.
Caso queria fazer alguma sugestão ao cógido para melhorar a gestão de risco ou caso tenha encontrado algum erro, favor comunicar.
O tangram bot 2 combina o uso de até dez Indicadores de Análise Técnica com Gerenciamento de Risco (stop gain, stop loss, stop móvel, realização parcial, bloqueio de reversões, lucro máximo por dia e prejuízo máximo por dia) e Filtros Diversos (sentido das operações, uso do after-market, bloqueio de nova entrada após saída, hora inicial e hora final para negociação). São utilizados os indicadores Médias Móveis, HiLo Activator, MACD, ADX, Estocástico, VWAP, IFR, Bandas de Bollinger, Stop ATR e SAR Parabólico
Momentum and Trend Strength Entry Exit Pivot StudyUpdated version of previous Momentum Strength Entry Exit Pivot Study:
//************************
// @TheGeeBee - Credit where used
//
//Notes:
//
// Use 1,2,3,5 minute timeframes
// EMA Cross line and offset allows user to alter the sell characteristics where the candle low is above the EMA line and indicates a possible pre-pivot reversal
// Adjust Min and Max pivots based on risk profile
// Single Candle drawdown value represents the maximum size of a single red candle before an Exit Pivot is generated
// ADX Threshold inhibits Pivots when trending signal is below the threshold value
// Percentage Max drawdown since Entry Pivot allows the system to generate an Exit Pivot if the security has dropped X percent from the most recent Entry Pivot point
// Use Bars, Candles (preferred) or Heikin-Ashi
// Multiple Green Bars = BTFD
// Multiple Red bars = If you didn't already get out, do it now!
//
//************************
Allows for Alerts to be set for Entry and Exit Pivots.
EMA NoHesi - cutting noise in EMA and any other data seriesNoise is common issue in variety of indicators. NoHesi is my take on reducing this noise.
Moving Averages are great indicators to show and maintain the trend. But sometimes - especially in pullback areas, smooth reversal zones or flat markets - MAs suggest trend changes, while it would be best for them to stay quiet :)
NoHesi function smoothens this noise, without adding unnecessary delay. NoHesi will make MA stay in the same direction as long as the move is not significant. If significant - MAs will report trend-change instantly.
Check the chart for illustration - NoHesi EMA keeps showing the same direction, despite its numerous attempts to change it (marked blue).
NoHesi can be applied to any data series: MAs, RSI , ADX , etc. EMA seemed like the most obvious example, so I used it for this presentation.
Hope it helps in your research!
P.S. When applying this to EMAs in other markets/timeframes, you will need to adjust "hesitation" parameter.
MultiTime_ADX&DM_V1Wilders Directional Movement Index & ADX
With three different lines that you can change
With two Signals that you can turn on and off
When you change the lines, the signals also change
You can activate alerts depending on the signals
The displayed time frame is changeable
Aroon+Williams+MA2+ADX+Aroon Str.Inspired by the Watchbot strategy which makes about +60% profit in two months.
cafe.naver.com
This is customized to "EOSUSDT, 15 min, Binance" as a default.
I want to add the function for avoiding the recurrence of the trading for 24 ticks(period), but don't know how to yet.
Simple TrenderOriginates from:
I was reading some Impulse Trading literature by A. Elder.. In it, someone named Kerry Lovvorn proposed "An End of Day Trend Following System" for someone lazy.
Originally it is just price closing above an 8 ema (low) for long. Exit when price closes below an 8 ema (low). The opposite for a short position.
Conditions: Buy when price closed below ema (low) for two bars or more, then closes above. Opposite for a short position. I do not follow this condition. Though it may help with whipsaw.
My condition is when price closes above the 26 ema (low) (works the best for me) I place orders above the initial crossing bars high. Opposite for lows.
I look for stocks that are low in price to go long on. I want the run from 2's to 15's
I look for stocks that are mid-teens/20's in price to go short on. I want the run from 20's to 2's
I look for stock with news and earnings that are already running (up or down) to play the pullback.
These conditions can easily be scanned for on thinkorswim
From first glance, the system looks like CMsling shotsystem. Although, I plagiarized some parts of the codes, because I am inept when it comes to that shit, it differs as it is not a moving average crossover system.
It is a price crossing over concept. A moving average VWAP is used for best entries on pullbacks.
Purpose:
--To catch the majority of a trend/wave/run.
--To identify pullback areas to go long or short while in midst of trend. To catch pullbacks off news and earning runners.
--To catch the initial start of trend with clear rules to enter
--Clear rules to exit
Issues
--possibilities of getting ninja sliced the fuck up. Can be mitigated by entering stocks with decent average volume. And also only going long above 200 ema and short below it. ADX won't work, at the initial start of the trend it will show not trending. Can look at blow off volume at the bottom followed by increase in buying for long and vice versa for short.
--Can give some huge gains away through gap ups or gap downs from news or earnings during trend. However, can get huge gain on gaps from news or earning. Nature of the game.
--Need some brass balls and a supply of pepto to stomach through some of the pullbacks. Gut wrenching seeing big gains dwindle. But they all even out at the end, you hope. (see NBEV and IGC, and CRON and others. shit don't go in straight lines, homie)
Pros
--It's simple and easy. Overall, you profit
--works with any security
Cons
--It can be stressful.
--does not work well on lower time frames. Do not recommend going below 15 minutes
--Possibility of working on 5 minutes with a time frame breakout strategy (15,30 min).
Couple it with LazyBear "Weis Wave Volume" indicator. Works well for pullback entries.
Enjoy. Ride some waves.
Average Directional Index-BuschiA simple modification of the built-in "Average Directional Index":
To identify wether there is an uptrend or a downtrend, the function color is conditional:
no trend: black
small uptrend (weak threshold): light green
big uptrend (strong threshold): green
small downtrend (weak threshold): light red
big downtrend (strong threshold): red
vwMACD_VXI+CMFNOTE: Not useful for <15 mins timeframes.
Hey!
I added a CMF to read market control. It gives a bit mire insight than the casual MACD Histogram, since it's formula is also based on volume and not just in price change.
How yo read CMF:
Possitive value = Bulls are in control of the market
Negative value = Bears are in control the market
Impulsive divergence = Bulls are taking the control, Bears are loosing it (yellow example)
Corrective divergence = Bears are taking the control, Bulls are loosing it (no example, but its the opposite, try to find it out :o)
You can study divergencies and convergencies to read the trend strenght, while you can check the trend development via the MACD crossing over.
MACD to check an opportunity, CMF to check if it's a good or a shitty one ;)
As you can see,
yellow divergencies = CMF
purple divergencies = MACD
Also, check my StotRSI Oscillator + ADX for trend strenght + Buy/Sell point script, it does a great job with vwMACD+CMF! ;)
For any question, just shoot it on the comments.
Cheers!
Renko Parabolic SAR + ADX Indicator (Need help on the alert)//This script is made using scripts by other authors. All credit goes to them. I am only copying snippets and making it work for me//
Problem Statement:
The script seems to work best using a fixed renko brick. The indicators do work but I have problems with the alert.
What often happens is, the signal appears (condition is met) BRIEFLY as the bar forms, it disappears a few seconds later, but the alert is still sent on the close of the bar.
I wish to receive these alerts on the close of a bar only if the condition is still met on the close of the bar
I am hoping someone can guide or fix the alertcondition such that it checks for the firmed signal before triggering the alert.
POLONIEX:BTCUSDT