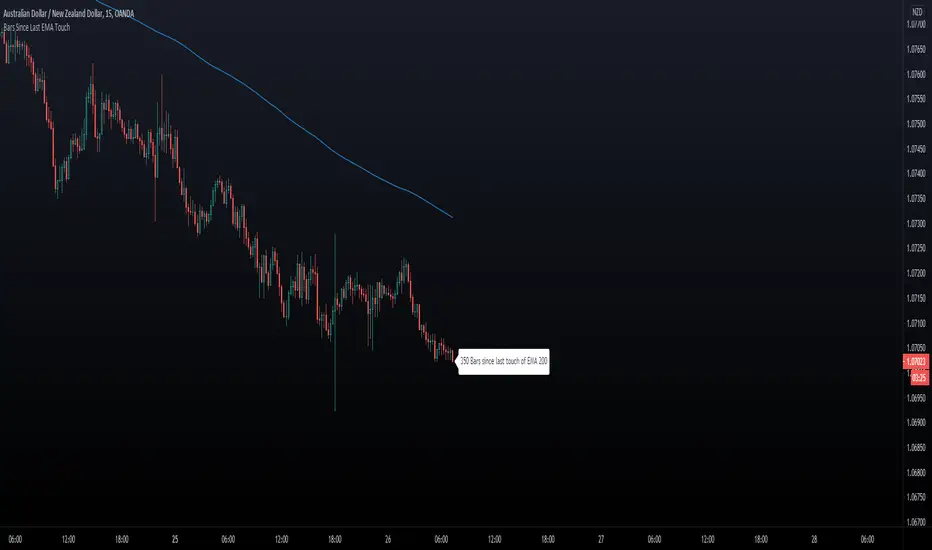
Bars Since Last EMA Touch
This indicator keeps track of how many bars since price touched any EMA last time. You can for example
set 200 EMA. Tell the script to send an alert if/when 400 bars has been reached away from the EMA 200.
- You can hide/show The EMA Line.
- You can hide/show bar Count.
- You can set X bars from EMA to get Alert.
- You can change color of The Badge and EMA line to fit your background colors.
Enjoy!
Another Indicator From The Hunter Trading Group
在腳本中搜尋"alert"
MA-EMA Crossover AlertsThis is a script for getting alerts for the MA-EMA XO Strategy that I published recently.
This is probably the first version that I am putting out for this logic.
Based on feedback (and some coding suggestions and support if anyone is willing), I will try to improve this further.
So, what do we have in this script -
I have created 5 alert conditions. The 4 alerts are straight-forward : Entry / Exit alerts for Long / Short.
The fifth alert is just a single Alert which is triggered if any of the 4 alert conditions are met. Then user can check the chart to see what trade is triggered.
I am not explaining the logic of the indicator here since it is kind-of covered in the strategy.

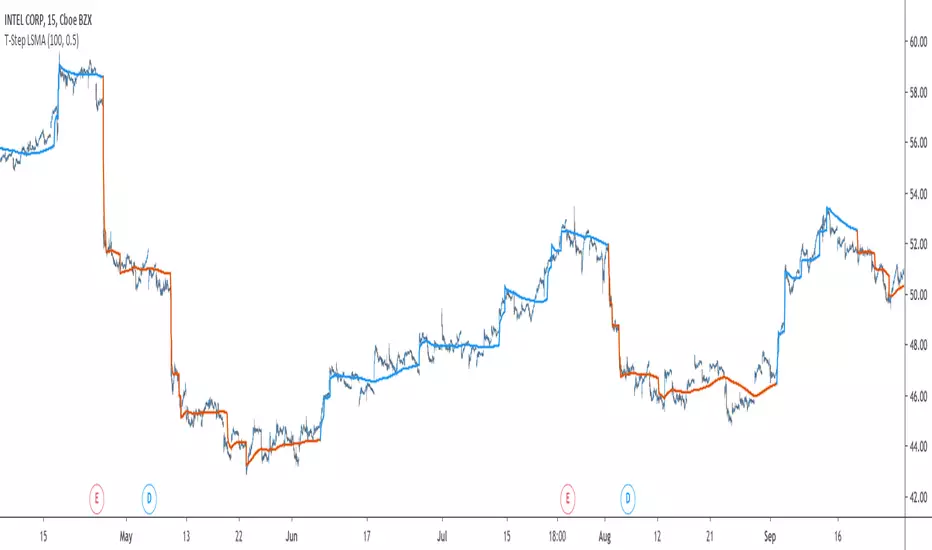
T-Step LSMAIntroduction
The trend step indicator family has produced much interest in the community, those indicators showed in certain cases robustness and reactivity. Their ease of use/interpretation is also a major advantage. Although those indicators have a relatively good fit with the input price, they can still be improved by introducing least-squares fitting on their calculations. This is why i propose a new indicator (T-Step LSMA) which aim to gather all the components of the trend-step indicator family (including the auto-line family).
The indicator will use as a threshold the mean absolute error between the input and the output (T-Channel) scaled with the efficiency ratio (Efficient Trend Step) while using least squares in order to provide a better fit with the price (Auto-Filter).
The Indicator
The interpretation of the indicator is easy, the indicator estimate an up-trending market when in blue, down-trending when in orange, the signal only depend on the trend-step part ( b in the code).
length control the period of the efficiency ratio as well as any components in the lsma calculation. The efficiency ratio allow to provide adaptivity, therefore the threshold will be lower when market is trending and higher when market is ranging.
Sc control the amount of feedback of the indicator, a value of 1 will use only the closing price as input, a value of 0.5 will use 50% of the closing price/indicator output as input, this allow to get smoother results.
It is possible to get the non-smooth version of the indicator by checking "No Smoothing".
This allow the indicator to filter more information.
Least Squares Smoothing - Benefits
One could ask why introducing least squares smoothing, there are several reasons to this choice, we have seen that trend-step indicators are boxy, they filter most of the variational information in the price, introducing least squares smoothing allow to gain back some of this variational information while providing a better fit with the price, the indicator is more noisy but also more practical in certain situations.
For example the indicator in its boxy form can't really be useful as input for other indicators, which is not the case with this version.
Relative strength index of period 14 using the proposed indicator as input.
Down-Sides
The indicator is dependent on the time frame used, larger time frames resulting in an indicator overfitting, sticking with lower time frames might be ideal. The indicator behavior might also change depending on the market in which it is applied.
Setting Up Alerts For The Indicator
Alerts conditions are already set, in order to create an alert based on the indicator follow these steps :
Go to the alert section (the alarm clock) -> create new alert -> select T-Step LSMA in condition -> Below select Up or Dn (Up for a up-trending alert and Dn for a down-trending alert)
In option select "once per bar close", change the message if you want a personalized message.
Conclusion
I don't think i'll post other indicators related to the trend-step framework for the time to comes, nonetheless the ones posted proven to have interesting results as well as many upsides. Although i don't think they would generate positive long-terms returns they could still be of use when using smarter volatility metrics as threshold. The proposed indicator conserve more information than its relatives and might find some use as input for other indicators.
Recommended Use Of The Code
Although i don't put restrictions on the code usage, i still recommend creative and pertinent changes to be made, graphical changes or any minor changes are not necessary, remember that such practice is disrespectful toward the author, you don't want to load up the tradingview servers for nothing right ?
Support Me
Making indicators sure is hard, it takes time and it can be quite lonely to, so i would love talking with you guys while making them :) There isn't better support than the one provided by your friends so drop me a message.
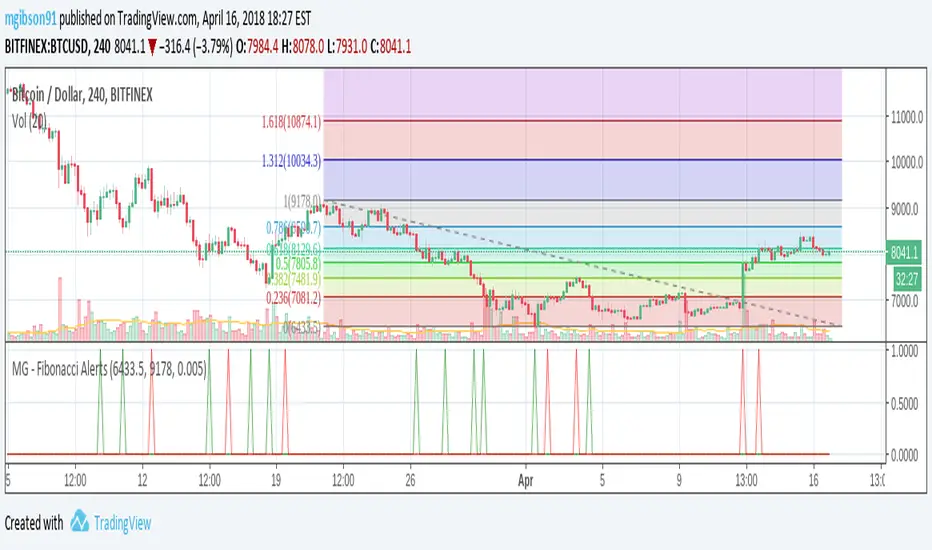
MG - Fibonacci Alerts - 1.0This script allows a user to get alerts when the price goes within a certain percentage threshold of a Fibonacci level.
If connected with AutoView, it could allow an easy way to do automated range trading between Fibonacci levels. Although I plan to do this myself, I haven't used it for this purpose yet so please be cautious and verify with live results beforehand before using it for any automation.
NOTE: The image shown of the indicator is not fully correct as the close price is used. In many cases in the example image, the candle close price DID come within the alert threshold but closed outside the threshold
Usage:
1. User performs a Fibonacci retracement / extension analysis to identify a sensible high and low point. (Currently, this script is geared towards dip pullbacks during a bull market with the ability to toggle rise pullbacks in a bear market in the pipeline)
2. User enters the high and low points into this indicator
3. User can then set alerts on the buy and sell signals which should provide alerts at excellent entry / exit points.
a. Alerts must be created on the buy and sell signal bars. E.g. Buy signal => Alert when 'Buy Signal' crosses up '0.9'
4. Set the alerts to once per bar (not per close). In this indicator, we want to catch things as soon as they happen.
NOTE: Should use in conjunction with another indicator for maximize results.
I personally use this indicator ()
TODO
- Add negative alert levels
- Allow user to specify direction of Fib retracement as the levels are different in bull and bear markets
All feedback is welcome
2 hours ago
Gunbot MACDgenOk this is just some strat based on MACD, checking for a few conditions until giving buy/sell signals to Gunbot via alerts.
It is generalized but if you want to go play with the values. I will continue to develop this further and am happy to receive feedback.
Notations are coming.
Usage notes:
-ONLY use this with TV_GAIN: 0.6 because on downtrends it is supposed to double up to pull down the average bought price!
-Use "buying condition" and "selling condition" for alerts, trigger on close and I suggest you use 3 min intervals but try what looks good to you
-Use this on pairs that are curvy and have atleast 0.6% gain between buy/sell triggers. This is also general advise when you want to take microprofits.
-Don't be confused with sell arrows, it will only trigger the bot sell on gain when you've set TV_GAIN

S/R HTF (D + 4H) | Clusters+Pivots | Stable | Styles+AlertsThis indicator plots higher-timeframe Support/Resistance levels based on the Daily and 4-Hour charts, and keeps them stable (not dependent on how much history is loaded or how you scroll/zoom).
What it does
Daily levels (D) are calculated from the last lenD closed daily candles (default: 120).
4H levels (240) are calculated from the last lenH4 closed 4H candles (default: 300).
Levels come from two sources:
Clusters (value areas): prices where candle closes occur frequently within a narrow range.
The range width is derived from ATR × step multiplier.
Pivots: recent pivot highs and pivot lows (with left/right pivot settings).
The script merges nearby levels (within a tolerance) to avoid duplicates.
Stability / update logic
Levels are computed with request.security() on "D" and "240", so the result is independent of the chart timeframe you’re currently viewing.
Lines are drawn using bar time anchoring and extend mode, so they remain fixed to price and do not “jump” when you zoom or scroll.
Levels are recalculated on a calendar schedule (default: every 2 days, timeframe "2D"). Between recalculations, levels remain unchanged.
Visual customization
From the settings panel you can configure:
Show/hide Daily and/or 4H levels
Show/hide Clusters and/or Pivots
Line width for clusters and pivots
Line style (Solid / Dashed / Dotted) for clusters and pivots
Colors and opacity for Daily and 4H lines
Line extension: Left / Right / Both
Alerts
The indicator can trigger alerts when price:
Touches a level (bar range crosses the level: high >= level and low <= level)
Approaches a level (distance is within a threshold)
Approach threshold can be defined as:
Ticks
ATR multiplier
Percent of price
To use dynamic alert text (level + distance):
Create an alert in TradingView using: “Any alert() function call”.
Notes / limitations
“Last N candles” depends on available symbol history; if the symbol doesn’t have enough Daily/4H history, some levels may be na.
Cluster quality depends on ATR-based bin size; adjusting the step multipliers can improve results per instrument and volatility regime.

Multi Condition Stock Screener & Alert SystemMulti Condition Stock Screener & Strategy Builder
This script is a comprehensive Stock Screener and Strategy Builder designed to scan predefined groups of stocks (specifically focused on BIST/Istanbul Stock Exchange symbols) or a custom list of symbols based on user-defined technical conditions.
It allows users to combine multiple technical indicators to create complex entry or exit conditions without writing code. The script iterates through a list of symbols and triggers alerts when the conditions are met.
Key Features
• Custom Strategy Building: Users can define up to 6 separate conditions. • Logical Operators: Conditions can be linked using logical operators (AND / OR) to create flexible strategies. • Predefined Groups: Includes 14 groups of stocks (covering BIST symbols) for quick scanning. • Custom Scanner: Users can select the "SPECIAL" group to manually input up to 40 custom symbols to scan. • Directional Scanning: Capable of scanning for both Buy/Long and Sell/Short signals. • Alert Integration: Generates JSON-formatted alert messages suitable for webhook integrations (e.g., sending notifications to Telegram bots).
Supported Indicators for Conditions
The script utilizes built-in ta.* functions to calculate the following indicators:
• MA (Moving Average): Supports EMA, SMA, RMA, and WMA. • RSI (Relative Strength Index) • CCI (Commodity Channel Index) • ATR (Average True Range) • BBW (Bollinger Bands Width) • ADX (Average Directional Index) • MFI (Money Flow Index) • MOM (Momentum)
How it Works
The script uses request.security() to fetch data for the selected group of symbols based on the current timeframe. It evaluates the user-defined logic (Condition 1 to 6) for each symbol.
• Comparison Logic: You can compare an indicator against a value (e.g., RSI > 50 ) or against another indicator (e.g., MA1 CrossOver MA2 ). • Signal Generation: If the logical result is TRUE based on the "AND/OR" settings, a visual label is plotted on the chart, and an alert condition is triggered.
Alert Configuration
The script produces a JSON output containing the Ticker, Signal Type, Period, and Price. This is optimized for users who want to parse alerts programmatically or send them to external messaging apps via webhooks.
Disclaimer This tool is for informational purposes only and does not constitute financial advice. Since it uses request.security across multiple symbols, please allow time for the script to load data on the chart.

Pi Cycle BTC Top + Pre-Alert BandsPi Cycle BTC Top + Pre-Alert Bands is an advanced implementation of the classic Pi Cycle Top model, designed for Bitcoin cycle analysis on higher timeframes (especially 1D BTCUSD/BTCUSD·INDEX).
The original Pi Cycle Top uses two moving averages:
• 111-day SMA (short MA)
• 350-day SMA ×2 (long MA)
A Pi Top is signaled when the 111 SMA crosses above the 350×2 SMA. Historically, this has occurred near major BTC cycle highs.
This script extends that idea with a 3-step early-warning sequence:
• Pi Green – early compression: short/long MA ratio crosses upward into the green band (convergence from below is required).
• Pi Yellow – mid-cycle warning: only fires if a valid Green has already occurred in the same cycle.
• Pi Cycle Top – final top: the classic Pi Cycle cross, limited to one top signal per cycle. After a top, no new Yellow or Top signals can appear until a new Green event starts the next cycle.
Background shading shows the active phase (Green / Yellow / late-cycle zone), so you can see at a glance where BTC is within its Pi-based macro structure.
All logic is non-repainting: request.security() uses lookahead_off and no future data is accessed.
Typical use
This indicator is intended as a macro-cycle timing and risk-awareness tool, not a stand-alone entry system. Many traders use it to:
• Watch for Pi Green as the start of a potential late-cycle advance.
• Treat Pi Yellow as a rising-risk environment and tighten risk management.
• Use the Pi Cycle Top as a historical high-risk zone where large profit-taking or hedging may be considered.
Always combine this with your own analysis (trend, volume, on-chain, macro) before making decisions.
How to set alerts
Add the indicator to your chart (1D BTCUSD or BTCUSD·INDEX recommended).
Click Alerts → Condition → Pi Cycle BTC Top + Pre-Alert Bands.
Choose one of:
• Pi Cycle – Green Pre-Alert (early convergence)
• Pi Cycle – Yellow Pre-Alert (after Green only)
• Pi Cycle – TOP (Single per Cycle, after Green)
Use “Once per bar close” for higher-timeframe reliability.
Disclaimer
This tool is for educational and analytical purposes only. The Pi Cycle concept is based on historical behavior and does not guarantee future results. This is not financial advice; always do your own research and manage risk appropriately.

WASDE Dates V2WASDE Dates V2 – USDA Release Calendar with Alerts, Countdown & Event Markers
By cot-trader.com
WASDE Dates V2 is a complete and reliable visualization tool for all scheduled WASDE (World Agricultural Supply and Demand Estimates) releases for 2025 and 2026.
The USDA’s WASDE report is one of the most market-moving fundamental catalysts in agricultural futures—affecting Corn (ZC), Wheat (ZW), Soybeans (ZS), Soymeal (ZM), Soybean Oil (ZL), and many related CFD products.
This script gives traders a precise timing layer directly inside their TradingView charts.
🔍 What this script does
WASDE Dates V2 automatically:
Marks each WASDE release day with a vertical line and label.
Shows an automated countdown to the next WASDE release:
In days (>24h)
In hours & minutes (<24h)
Displays an optional table of upcoming WASDE dates for quick reference.
Provides two alert conditions:
WASDE Day Alert – triggers exactly on the event
WASDE 24h Reminder – pre-alert when less than 24 hours remain
Handles both 2025 and 2026 confirmed dates.
Works on any symbol and timeframe.
📌 Why WASDE matters
The WASDE report updates global supply and demand estimates for:
Corn
Soybeans
Wheat
Other major agricultural commodities
Changes in yield, acres, production, imports/exports, and ending stocks can cause immediate and significant volatility.
Many traders combine WASDE awareness with seasonality, COT positioning, volatility filters, or fundamental models.
This script ensures you never miss the timing of these key releases.
⚙️ How the script works
The script stores official USDA WASDE release dates for 2025 and 2026 in two dedicated arrays.
On every bar, it compares the bar’s timestamp with known WASDE timestamps to detect an event day.
When an event occurs:
A red “WASDE” label is plotted above the candle
A dotted vertical line is drawn through the bar
It finds the next upcoming WASDE by scanning forward through both arrays.
A live-updating countdown label is displayed, showing days or hours/minutes until release.
If the event is less than 24 hours away:
A yellow “WASDE soon” warning appears near price
The 24h alert condition becomes active
An optional table lists upcoming events for 2025 & 2026.
This script does not generate trading signals.
It provides a time-based event layer designed to complement any discretionary or algorithmic trading approach.
🧭 How to use
Add the script to your chart.
Enable alerts for:
“WASDE Day Alert”
“WASDE 24h Reminder”
Follow the countdown to prepare for upcoming volatility.
Use together with other agricultural tools such as:
Seasonality indicators
COT (Commitment of Traders) analysis
Trend / VWAP / Volume signals
Pre- and post-WASDE trading strategies
Works on all chart types, all symbols, and all timeframes.
📅 Included WASDE Dates (Confirmed)
2025:
Jan 12, Feb 11, Mar 11, Apr 10, May 12, Jun 12, Jul 11, Aug 12, Sep 12, Oct 9, Nov 10, Dec 9
2026:
Jan 12, Feb 10, Mar 10, Apr 9, May 12, Jun 11, Jul 10, Aug 12, Sep 11, Oct 9, Nov 10, Dec 10
(All dates based on USDA’s official 12:00pm ET schedule.)
💡 What makes this script original
Fully updated 2025 + 2026 calendar
Uses a robust time-comparison method for accurate marking
Unique dual alert system (event + 24h pre-alert)
Clean, readable layout with countdown + upcoming dates table
Tailored specifically for grain & agricultural traders
Built entirely in Pine Script v6 with careful attention to performance

ORB 30 Alerts (ATH)Overview
ATH ORB 30m automates the Opening Range Breakout (ORB) process across multiple global sessions — Tokyo, London, and New York — and delivers clean, consolidated alerts when fresh breakouts occur.
It’s built for traders who track several tickers and want precise, non-repeating signals that reflect genuine momentum shifts, not constant noise.
How it works
The script defines a 30-minute Opening Range (ORB) for each enabled session and plots its high, low, and midpoint levels.
Every 10-minute candle close is evaluated to detect first-time crosses of those range boundaries — upward or downward.
Once a breakout triggers, that side’s alert is disabled until price returns inside the range, where the system automatically re-arms.
Multiple triggers in the same bar are batched into one combined alert, listing all symbols that broke out.
A built-in debug panel and optional chart labels visualize each trigger and re-arm event in real time.
Key features
-Multi-session ORB logic (Tokyo, London, New York)
-10-minute confirmation filter to validate breakouts
-Automatic alert re-arming when price re-enters range
-Combined per-bar alert messages (no duplicates)
-Optional on-chart labels and debug diagnostics
-Optimized for watchlists and multi-symbol scanners
Usage
Designed for day traders and momentum scalpers, this tool highlights early directional strength during market opens.
Add it to your chart, enable your preferred sessions, and set alert conditions for “ORB Breakouts (BUY),” “ORB Breakdowns (SELL),” or "Any alert() function call" You’ll receive one concise message each bar showing exactly which symbols broke out and in which direction.
DISCLAIMER:
This script is for educational and informational purposes only.
It does not constitute financial advice or a recommendation to buy or sell any security.
Always perform your own due diligence and backtesting before using any trading strategy live.
Trading involves risk; past performance does not guarantee future results.

Strat 1-2 Break AlertsThe Strat 1-2 Break Alerts
by Yolanda Marie Dixon
This indicator automatically identifies Inside Bars (1) and alerts when price breaks out into a 2-1-2 Bullish or 2-1-2 Bearish setup — two of the most actionable patterns in The Strat methodology created by Rob Smith.
📊 What It Does:
Marks Inside Bars with a yellow triangle below the candle.
Plots a green “2-1-2↑” triangle when a bullish breakout occurs.
Plots a red “2-1-2↓” triangle when a bearish breakdown occurs.
Provides built-in alerts so traders never miss a 2-1-2 setup.
💡 How to Use It:
Add the indicator to your chart, then go to Alerts → Create Alert → Condition: Strat 1-2 Break Alerts, and choose either 2-1-2 Up or 2-1-2 Down.
Perfect for traders who follow The Strat and want simple, reliable visual and alert-based signals for 1-2 setups.
—
🔔 Stay ready, stay Stratified.
Master The Strat with instant alerts for every 2-1-2 breakout.

AI Trading Alerts v6 — SL/TP + Confidence + Panel (Fixed)Overview
This Pine Script is designed to identify high-probability trading opportunities in Forex, commodities, and crypto markets. It combines EMA trend filters, RSI, and Stochastic RSI, with automatic stop-loss (SL) & take-profit (TP) suggestions, and provides a confidence panel to quickly assess the trade setup strength.
It also includes TradingView alert conditions so you can set up notifications for Long/Short setups and EMA crosses.
⚙️ Features
EMA Trend Filter
Uses EMA 50, 100, 200 for trend confirmation.
Bull trend = EMA50 > EMA100 > EMA200
Bear trend = EMA50 < EMA100 < EMA200
RSI Filter
Bullish trades require RSI > 50
Bearish trades require RSI < 50
Stochastic RSI Filter
Prevents entries during overbought/oversold extremes.
Bullish entry only if %K and %D < 80
Bearish entry only if %K and %D > 20
EMA Proximity Check
Price must be near EMA50 (within ATR × adjustable multiplier).
Signals
Continuation Signals:
Long if all bullish conditions align.
Short if all bearish conditions align.
Cross Events:
Long Cross when price crosses above EMA50 in bull trend.
Short Cross when price crosses below EMA50 in bear trend.
Automatic SL/TP Suggestions
SL size adjusts depending on asset:
Gold/Silver (XAU/XAG): 5 pts
Bitcoin/Ethereum: 100 pts
FX pairs (default): 20 pts
TP = SL × Risk:Reward ratio (default 1:2).
Confidence Score (0–4)
Based on conditions met (trend, RSI, Stoch, EMA proximity).
Labels:
Strongest (4/4)
Strong (3/4)
Medium (2/4)
Low (1/4)
Visual Panel on Chart
Shows ✅/❌ for each condition (trend, RSI, Stoch, EMA proximity, signal now).
Confidence row with color-coded strength.
Alerts
Long Setup
Short Setup
Long Cross
Short Cross
🖥️ How to Use
1. Add the Script
Open TradingView → Pine Editor.
Paste the full script.
Click Add to chart.
Save as "AI Trading Alerts v6 — SL/TP + Confidence + Panel".
2. Configure Inputs
EMA Lengths: Default 50/100/200 (works well for swing trading).
RSI Length: 14 (standard).
Stochastic Length/K/D: Default 14/3/3.
Risk:Reward Ratio: Default 2.0 (can change to 1.5, 3.0, etc.).
EMA Proximity Threshold: Default 0.20 × ATR (adjust to be stricter/looser).
3. Read the Panel
Top-right of chart, you’ll see ✅ or ❌ for:
Trend → Are EMAs aligned?
RSI → Above 50 (bull) or below 50 (bear)?
Stoch OK → Not extreme?
Near EMA50 → Close enough to EMA50?
Above/Below OK → Price position vs. EMA50 matches trend?
Signal Now → Entry triggered?
Confidence row:
🟢 Green = Strongest
🟩 Light green = Strong
🟧 Orange = Medium
🟨 Yellow = Low
⬜ Gray = None
4. Alerts Setup
Go to TradingView Alerts (⏰ icon).
Choose the script under “Condition”.
Select alert type:
Long Setup
Short Setup
Long Cross
Short Cross
Set notification method (popup, sound, email, mobile).
Click Create.
Now TradingView will notify you automatically when signals appear.
5. Example Workflow
Wait for Confidence = Strong/Strongest.
Check if market session supports volatility (e.g., XAU in London/NY).
Review SL/TP suggestions:
Long → Entry: current price, SL: close - risk_pts, TP: close + risk_pts × RR.
Short → Entry: current price, SL: close + risk_pts, TP: close - risk_pts × RR.
Adjust based on your own price action analysis.
📊 Best Practices
Use on H1 + D1 combo → align higher timeframe bias with intraday entries.
Risk only 1–2% of account per trade (position sizing required).
Filter with market sessions (Asia, Europe, US).
Strongest signals work best with trending pairs (e.g., XAUUSD, USDJPY, BTCUSD).

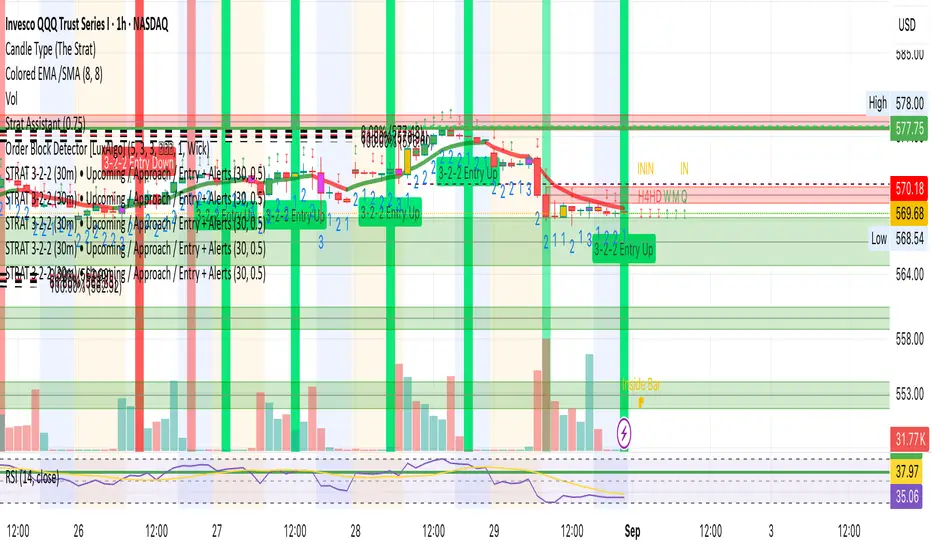
STRAT 3-2-2 (30m) • Upcoming / Approach / Entry + AlertsThis indicator is built for The STRAT trading method, specifically the 3-2-2 reversal pattern. It monitors price action on the 30-minute timeframe (HTF = 30m) and visually/alert-wise highlights where a 3-2-2 setup, approach, or entry trigger occurs.
---
⚙️ How it works
1. Detects bar types:
3 (Outside Bar) = range breaks both high & low of the previous bar
2u (Up bar) = higher high, not outside
2d (Down bar) = lower low, not outside
1 (Inside bar) = fully contained within prior bar
2. Looks for 3-2-2 setups:
Bullish 3-2-2 = 3 → 2d → 2u (expect reversal UP)
Bearish 3-2-2 = 3 → 2u → 2d (expect reversal DOWN)
3. Defines trigger levels:
Bullish trigger = high of the first “2d” bar
Bearish trigger = low of the first “2u” bar
4. Signals 3 phases:
Upcoming: pattern is forming, second “2” hasn’t triggered yet
Approach: price comes within 50% (adjustable) of the trigger level
Entry: price breaks the trigger (actual reversal confirmation)
5. Visualization:
Labels above/below candles show “Approach” and “Entry”
Background or bar colors (toggle in settings) highlight Setup / Approach / Entry
Optional dotted line marks the trigger level for clarity
---
🔔 Alerts
Two alert systems are built in:
1. Safe static conditions (for normal TradingView alert setup):
APPROACH: Bullish 3-2-2 (30m)
APPROACH: Bearish 3-2-2 (30m)
ENTRY: Bullish 3-2-2 (30m)
ENTRY: Bearish 3-2-2 (30m)
2. Dynamic messages (using alert() calls with price info):
If you create an alert with “Any alert() function call”, the pop-up will include the trigger price.
---
📋 Inputs (Settings)
Signal timeframe (HTF) → default 30m
Confirm signals at HTF bar close → waits for bar close (non-repainting)
Approach = % of first '2' bar range → default 50%
Show labels → On/Off
Color candles instead of background → toggle between candle color vs. chart background
ORB Breakouts with alerts"ORB Breakouts with Alerts" is a utility indicator that highlights an Opening Range Breakout (ORB) setup during a user-defined intraday time window. It allows traders to visualize price consolidation ranges and receive alerts when price breaks above or below the session high/low.
🔧 Features:
*Customizable session time (start and end), adjustable to local time using a timezone offset.
*Automatically plots:
*A shaded box around the session's high and low.
*Horizontal lines at session high and low levels.
*Optional "BUY"/"SELL" labels to mark breakout directions.
*Visual breakout signals when price crosses above or below the session range.
*Built-in alerts to notify when breakouts occur.
*Configurable styling options including box color, highlight color, and label placement.
⚙️ How It Works:
*During the defined time range, the script tracks the highest high and lowest low.
*After the session ends:
*A box is drawn to represent the opening range.
*Breakouts above the high or below the low trigger visual markers and optional alerts.
*Alerts are limited to one per direction per day to reduce noise.
⚠️ This indicator is a technical analysis tool only and does not provide financial advice or trade recommendations. Always use with proper risk management and in conjunction with your trading plan.

Sunmool's Next Day Model FVG AlertNY Killzone FVG Alert - ICT Fair Value Gap Detection Indicator
This comprehensive Pine Script indicator is specifically designed for traders following ICT (Inner Circle Trader) methodology and Smart Money Concepts. The indicator automatically detects Fair Value Gaps (FVG) that occur during the New York Killzone session, providing real-time alerts when these critical market imbalances are identified.
Key Features:
🎯 Fair Value Gap Detection
Automatically identifies bullish and bearish Fair Value Gaps using the classic 3-candle pattern
Filters gaps based on customizable minimum size thresholds to avoid insignificant imbalances
Provides visual representation through colored boxes and labels for easy identification
⏰ New York Killzone Focus
Specifically monitors the NY Killzone session (default: 7:00 AM - 10:00 AM EST)
Fully customizable session times to accommodate different trading preferences
Only detects FVGs when all three candles forming the gap occur within the killzone timeframe
📅 ICT Next Day Model Compliance
Automatically excludes Mondays from FVG detection as per ICT Next Day Model principles
Optional Monday exclusion can be toggled on/off based on trading strategy
Ensures alignment with professional ICT trading methodologies
🔔 Advanced Alert System
Three distinct alert conditions: Bullish FVG, Bearish FVG, and Combined alerts
Customizable alert messages for different notification preferences
Compatible with TradingView's full alert system including email, SMS, and webhook notifications
🎨 Visual Customization
Adjustable colors for bullish and bearish FVG boxes
Configurable box extension length for better visualization
Optional background highlighting during killzone sessions
Clean, professional chart presentation that doesn't clutter your analysis
📊 Technical Specifications
Works on all timeframes, though most effective on intraday charts (1m, 5m, 15m)
Timezone-aware calculations ensure accurate session detection globally
Efficient code structure minimizes processing load and chart lag
Compatible with other indicators and doesn't interfere with existing chart setups
🎯 Ideal For:
ICT methodology traders seeking automated FVG detection
Smart Money Concepts practitioners
Scalpers and day traders focusing on NY session
Traders looking to identify high-probability entry zones
Anyone interested in market structure and liquidity concepts
📈 Trading Applications:
Fair Value Gaps often serve as areas where price may return to "fill" the imbalance, making them excellent zones for:
Potential reversal areas
Take profit targets
Stop loss placement reference points
Market structure analysis
Confluence with other ICT concepts
⚙️ Customizable Parameters:
FVG minimum size filter
Killzone session start/end times
Visual display options
Alert preferences
Color schemes and styling options
This indicator brings institutional trading concepts to retail traders, helping identify the same market inefficiencies that smart money targets. By focusing specifically on the New York Killzone - one of the most liquid and volatile trading sessions - it provides high-quality signals during optimal market conditions.
Whether you're new to ICT concepts or an experienced trader looking to automate your FVG detection, this indicator provides the precision and reliability needed for professional trading analysis.

Trend Display Table (with Change Alerts)📌 Indicator: Trend Display Table (with Change Alerts)
This indicator helps identify trend direction based on a 15-minute 20 SMA compared against a 10 EMA applied to that SMA.
Trend Logic:
Bullish → 20 SMA crosses above 10 EMA (on SMA values)
Bearish → 20 SMA crosses below 10 EMA (on SMA values)
Neutral → No crossover (trend continues from previous state)
Display:
A compact trend table appears on the chart (top-right), showing the current trend with customizable colors, font size, and background.
Alerts:
Alerts are triggered only when the trend changes (from Bullish → Bearish or Bearish → Bullish).
This prevents repeated alerts on every bar.
✅ Useful for:
Confirming higher timeframe trend bias
Filtering trades in choppy markets
Getting notified instantly when the trend flips

EZ FX Zones (OR Pro + Auto Alerts) v6.3Purpose:
This indicator automatically calculates and plots ORH (Opening Range High) and ORL (Opening Range Low) based on the first X minutes of trading (customizable), then uses those levels to:
Mark clear Buy and Sell Zones on the chart
Show targets based on ATR (Average True Range) or fixed pip/point settings
Automatically trigger alerts when price crosses important levels so you can enter trades in TopstepFX within your 5-minute execution window
What It Plots on the Chart:
Opening Range High (ORH) – top of the initial range (green line)
Opening Range Low (ORL) – bottom of the initial range (red line)
Midpoint – average of ORH and ORL (dotted white line)
Target Levels – projected profit targets above ORH and below ORL (gray dashed lines)
Labels – “BUY ABOVE” and “SELL BELOW” text for instant clarity
How to Use It (Third Grader Mode):
If price breaks above ORH → BUY.
If price breaks below ORL → SELL.
Your target is the nearest dashed line in the trade direction.
Alerts are sent to your phone when:
Price crosses ORH (BUY alert)
Price crosses ORL (SELL alert)
Price hits target levels
Alerts Included:
"BUY Signal – Price Crossed ORH"
"SELL Signal – Price Crossed ORL"
"Target Hit – Long"
"Target Hit – Short"
Why This Helps in TopstepFX:
No guesswork — you only react to breakouts of the first range.
You can trade with confidence in your 5-minute reaction window because the script does all calculations automatically.
You get push alerts on your phone so you don’t have to stare at charts all day.

Mutanabby_AI | Fresh Algo V24Mutanabby_AI | Fresh Algo V24: Advanced Multi-Mode Trading System
Overview
The Mutanabby_AI Fresh Algo V24 represents a sophisticated evolution of multi-component trading systems that adapts to various market conditions through advanced operational configurations and enhanced analytical capabilities. This comprehensive indicator provides traders with multiple signal generation approaches, specialized assistant functions, and dynamic risk management tools designed for professional market analysis across diverse trading environments.
Primary Signal Generation Framework
The Fresh Algo V24 operates through two fundamental signal generation approaches that accommodate different market perspectives and trading philosophies. The Trending Signals Mode serves as the primary trend-following mechanism, combining Wave Trend Oscillator analysis with Supertrend directional signals and Squeeze Momentum breakout detection. This mode incorporates ADX filtering that requires values exceeding 20 to ensure sufficient trend strength exists before signal activation, making it particularly effective during sustained directional market movements where momentum persistence creates profitable trading opportunities.
The Contrarian Signals Mode provides an alternative approach targeting reversal opportunities through extreme market condition identification. This mode activates when the Wave Trend Oscillator reaches critical threshold levels, specifically when readings surpass 65 indicating potential bearish reversal conditions or drop below 35 suggesting bullish reversal opportunities. This methodology proves valuable during overextended market phases where mean reversion becomes statistically probable.
Advanced Filtering Mechanisms
The system incorporates multiple sophisticated filtering mechanisms designed to enhance signal quality and reduce false positive occurrences. The High Volume Filter requires volume expansion confirmation before signal activation, utilizing exponential moving average calculations to ensure institutional participation accompanies price movements. This filter substantially improves signal reliability by eliminating low-conviction breakouts that lack adequate volume support from professional market participants.
The Strong Filter provides additional trend confirmation through 200-period exponential moving average analysis. Long position signals require price action above this benchmark level, while short position signals necessitate price action below it. This ensures strategic alignment with longer-term trend direction and reduces the probability of trading against major market movements that could invalidate shorter-term signals.
Cloud Filter Configuration System
The Fresh Algo V24 offers four distinct cloud filter configurations, each optimized for specific trading timeframes and market approaches. The Smooth Cloud Filter utilizes the mathematical relationship between 150-period and 250-period exponential moving averages, providing stable trend identification suitable for position trading strategies. This configuration generates signals exclusively when price action aligns with cloud direction, creating a more deliberate but highly reliable signal generation process.
The Swing Cloud Filter employs modified Supertrend calculations with parameters specifically optimized for swing trading timeframes. This filter achieves optimal balance between responsiveness and stability, adapting effectively to medium-term price movements while filtering excessive market noise that typically affects shorter-term analytical systems.
For active intraday traders, the Scalping Cloud Filter utilizes accelerated Supertrend calculations designed to capture rapid trend changes effectively. This configuration provides enhanced signal generation frequency suitable for compressed timeframe strategies. The advanced Scalping+ Cloud Filter incorporates Hull Moving Average confirmation, delivering maximum responsiveness for ultra-short-term trading while maintaining signal quality through additional momentum validation processes.
Specialized Assistant Functionality
The system includes two distinct assistant modes that provide supplementary market analysis capabilities. The Trend Assistant Mode activates advanced cloud analysis overlays that display dynamic support and resistance zones calculated through adaptive volatility algorithms. These levels automatically adjust to current market conditions, providing visual guidance for identifying trend continuation patterns and potential reversal areas with mathematical precision.
The Trend Tracker Mode concentrates on long-term trend identification by displaying major exponential moving averages with color-coded fill areas that clarify directional bias. This mode maintains visual simplicity while providing comprehensive trend context evaluation, enabling traders to quickly assess broader market direction and align shorter-term strategies accordingly.
Dynamic Risk Management System
The integrated risk management system automatically adapts across all operational modes, calculating stop loss and take profit targets using Average True Range multiples that adjust to current market volatility. This approach ensures consistent risk parameters regardless of selected operational mode while maintaining relevance to prevailing market conditions.
Stop loss placement occurs at dynamically calculated distances from entry points, while three progressive take profit targets establish at customizable ATR multiples respectively. The system automatically updates these levels upon trend direction changes, ensuring current market volatility influences all risk calculations and maintains appropriate risk-reward ratios throughout trade management.
Comprehensive Market Analysis Dashboard
The sophisticated dashboard provides real-time market analysis including volatility measurements, institutional activity assessment, and multi-timeframe trend evaluation across five-minute through four-hour periods. This comprehensive market context assists traders in selecting appropriate operational modes based on current market characteristics rather than relying exclusively on historical performance data.
The multi-timeframe analysis ensures mode selection considers broader market context beyond the primary trading timeframe, improving overall strategic alignment and reducing conflicts between different temporal market perspectives. The dashboard displays market state classification, volatility percentages, institutional activity levels, current trading session information, and trend pressure indicators with professional formatting and clear visual hierarchy.
Enhanced Trading Assistants
The Fresh Algo V24 includes specialized trading assistant features that complement the primary signal generation system. The Reversal Dot functionality identifies potential reversal points through Wave Trend Oscillator analysis, displaying visual indicators when crossover conditions occur at extreme levels. These reversal indicators provide early warning signals for potential trend changes before they appear in the primary signal system.
The Dynamic Take Profit Labels feature automatically identifies optimal profit-taking opportunities through RSI threshold analysis, marking potential exit points at multiple levels for long positions and corresponding levels for short positions. This automated profit management system helps traders optimize exit timing without requiring constant manual monitoring of technical indicators.
Advanced Alert System
The comprehensive alert system accommodates all operational modes while providing granular notification control for various signal types and risk management events. Traders can configure separate alerts for normal buy signals, strong buy signals, normal sell signals, strong sell signals, stop loss triggers, and individual take profit target achievements.
Cloud crossover alerts notify traders when trend direction changes occur, providing early indication of potential strategy adjustments. The alert system includes detailed trade setup information, timeframe data, and relevant entry and exit levels, ensuring traders receive complete context for informed decision-making without requiring constant chart monitoring.
Technical Foundation Architecture
The Fresh Algo V24 combines multiple proven technical analysis components including Wave Trend Oscillator for momentum assessment, Supertrend for directional bias determination, Squeeze Momentum for volatility analysis, and various exponential moving averages for trend confirmation. Each component contributes specific market insights while the unified system provides comprehensive market evaluation through their mathematical integration.
The multi-component approach reduces dependency on individual indicator limitations while leveraging the analytical strengths of each technical tool. This creates a robust analytical framework capable of adapting to diverse market conditions through appropriate mode selection and parameter optimization, ensuring consistent performance across varying market environments.
Market State Classification
The indicator incorporates advanced market state classification through ADX analysis, distinguishing between trending, ranging, and transitional market conditions. This classification system automatically adjusts signal sensitivity and filtering parameters based on current market characteristics, optimizing performance for prevailing conditions rather than applying static analytical approaches.
The volatility measurement system calculates current market activity levels as percentages, providing quantitative assessment of market energy and helping traders select appropriate operational modes. Institutional activity detection through volume analysis ensures signal generation aligns with professional market participation patterns.
Implementation Strategy Considerations
Successful implementation requires careful matching of operational modes to prevailing market conditions and individual trading objectives. Trending modes demonstrate optimal performance during directional markets with sustained momentum characteristics, while contrarian modes excel during range-bound or overextended market conditions where reversal probability increases.
The cloud filter configurations provide varying degrees of confirmation strength, with smoother settings reducing false signal occurrence at the expense of some responsiveness to price changes. Traders must balance signal quality against signal frequency based on their risk tolerance and available trading time, utilizing the comprehensive customization options to optimize performance for their specific requirements.
Multi-Timeframe Integration
The system provides seamless multi-timeframe analysis through the integrated dashboard, displaying trend alignment across multiple time horizons from five-minute through four-hour periods. This analysis helps traders understand broader market context and avoid conflicts between different temporal perspectives that could compromise trade outcomes.
Session analysis identifies current trading session characteristics, providing context for expected market behavior patterns and helping traders adjust their approach based on typical session volatility and participation levels. This geographic market awareness enhances strategic decision-making and improves timing for trade execution.
Advanced Visualization Features
The indicator includes sophisticated visualization capabilities through gradient candle coloring based on MACD analysis, providing immediate visual feedback on momentum strength and direction. This enhancement allows rapid market assessment without requiring detailed indicator analysis, improving efficiency for traders managing multiple instruments simultaneously.
The cloud visualization system uses color-coded fill areas to clearly indicate trend direction and strength, with automatic adaptation to selected operational modes. This visual clarity reduces analytical complexity while maintaining comprehensive market information display through professional chart presentation.
Performance Optimization Framework
The Fresh Algo V24 incorporates performance optimization features including signal strength classification, automatic parameter adjustment based on market conditions, and dynamic filtering that adapts to current volatility levels. These optimizations ensure consistent performance across varying market environments while maintaining signal quality standards.
The system automatically adjusts sensitivity levels based on selected operational modes, ensuring appropriate responsiveness for different trading approaches. This adaptive framework reduces the need for manual parameter adjustments while maintaining optimal performance characteristics for each operational configuration.
Conclusion
The Mutanabby_AI Fresh Algo V24 represents a comprehensive solution for professional trading analysis, combining multiple analytical approaches with advanced visualization and risk management capabilities. The system's strength lies in its adaptive multi-mode design and sophisticated filtering mechanisms, providing traders with versatile tools for various market conditions and trading styles.
Success with this system requires understanding the relationship between different operational modes and their optimal application scenarios. The comprehensive dashboard and alert system provide essential market context and trade management support, enabling systematic approach to market analysis while maintaining flexibility for individual trading preferences.
The indicator's sophisticated architecture and extensive customization options make it suitable for traders at all experience levels, from those seeking systematic signal generation to advanced practitioners requiring comprehensive market analysis tools. The multi-timeframe integration and adaptive filtering ensure consistent performance across diverse market conditions while providing clear guidelines for strategic implementation.

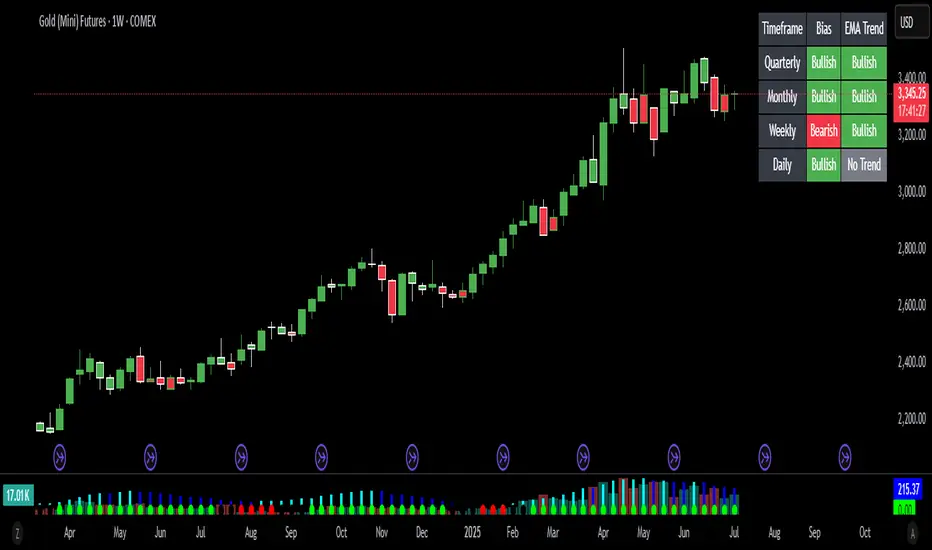
Bias Bar Coloring + Multi-Timeframe Bias Table + AlertsMulti-Timeframe Bias Bar Coloring with Alerts & Table
This indicator provides a powerful, visual way to assess price action bias across multiple timeframes—Monthly, Weekly, and Daily—while also coloring each bar based on the current chart’s bias.
Features:
Persistent Bar Coloring: Bars are colored green for bullish bias (close above previous high), red for bearish bias (close below previous low), and persist the last color if neither condition is met. This makes trend shifts and momentum easy to spot at a glance.
Bias Change Alerts: Get notified instantly when the bias flips from bullish to bearish or vice versa, helping you stay on top of potential trade setups or risk management decisions.
Multi-Timeframe Bias Table: A table anchored in the top right corner displays the current bias for the Monthly, Weekly, and Daily charts, color-coded for quick reference. This gives you a clear view of higher timeframe context while trading any chart.
Consistent Logic: The same objective bias logic is used for all timeframes, ensuring clarity and reliability in your analysis.
How to Use:
Use the bar colors for instant visual feedback on trend and momentum shifts.
Watch the top-right table to align your trades with higher timeframe bias, improving your edge and filtering out lower-probability setups.
Set alerts to be notified of bias changes, so you never miss a potential opportunity.
This tool is ideal for traders who value multi-timeframe analysis, want clear visual cues for trend direction, and appreciate having actionable alerts and context at their fingertips.
MA Cross MTF Alert (Miu)This script extends the classic moving average crossover strategy with support for up to 8 user-defined symbols across 4 custom timeframes, combined with a visual and alert system designed for traders who monitor multiple assets simultaneously.
Unlike traditional MA crossover tools, this script enables traders to receive real-time alerts for crossovers across multiple assets and timeframes, even when the script is not actively displayed on the chart — ideal for passive monitoring in multi-asset strategies.
What it does:
This script calculates two customizable moving averages (SMA or EMA) for each selected symbol and timeframe.
It then tracks crossover events:
- Bullish crossover when the fast MA crosses above the slow MA
- Bearish crossunder when the fast MA crosses below the slow MA
On the chart, it also displays the crossover signals for the current symbol and timeframe using color-coded cross icons.
Key features:
- Select SMA or EMA type for both moving averages
- Customize MA lengths and colors
- Works with any asset and timeframe
- Alerts include symbol and timeframe info for easy identification
How to use:
1) Add the indicator to your chart.
2) Choose the moving average type and lengths.
3) Enable/disable any of the 8 symbols and 4 timeframes.
4) Set up TradingView alerts by clicking “Create Alert” and selecting one of the alert() calls.
5) You will receive a message like:
BTC (1h) | MA Crossover ▲ or ETH (15m) | MA Crossunder ▼
Technical note:
This script uses request.security() to retrieve moving average values from up to 8 different symbols and 4 different timeframes in real time.
Feel free to leave your feedback or suggestions in the comments section below.
Enjoy!

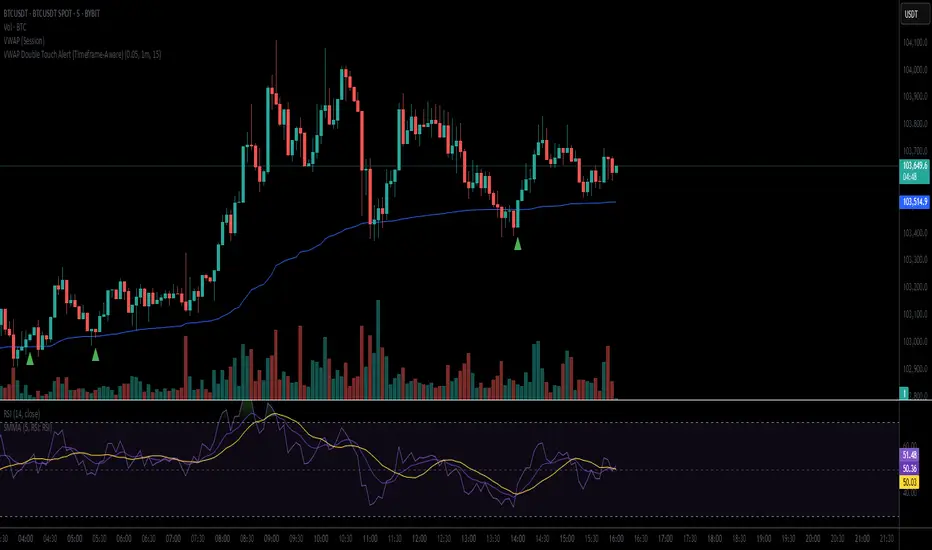
VWAP Double Touch Alert (Timeframe-Aware)📌 VWAP Double Touch Alert — Smart Re-entry Signal for Precision Traders
Take your VWAP trading to the next level with this intelligent indicator that filters out the noise and zeroes in on high-probability re-entry setups.
💡 How it works:
This script tracks every time price touches the VWAP line and alerts you when it happens twice within a defined window of time (adjustable per your timeframe). This is often a sign of smart money accumulation, potential reversals, or explosive breakouts.
🔍 Why Traders Love It:
✅ Filters out weak signals — only alerts on confirmed double touches
✅ Fully adjustable VWAP zone sensitivity
✅ Selectable timeframe profiles or custom window (1m, 5m, 15m, 30m, etc.)
✅ Clean visual cues with minimal chart clutter
✅ Perfect for scalping, intraday reversals, or VWAP mean-reversion strategies
⚙️ Customization:
VWAP zone width (in %)
Time window in bars or automatic based on timeframe
Custom alert messages
Alert only triggers once per double-touch event to avoid spamming
🎯 Best For:
Crypto scalpers & day traders
VWAP bounce and mean-reversion traders
Traders who want clean, conclusive entry alerts without lag
EMA Crossover Strategy with Trailing Stop and AlertsPowerful EMA Crossover Strategy with Dynamic Trailing Stop and Real-Time Alerts
This strategy combines the simplicity and effectiveness of EMA crossovers with a dynamic trailing stop-loss mechanism for robust risk management.
**Key Features:**
* **EMA Crossover Signals:** Identifies potential trend changes using customizable short and long period Exponential Moving Averages.
* **Trailing Stop-Loss:** Automatically adjusts the stop-loss level as the price moves favorably, helping to protect profits and limit downside risk. The trailing stop percentage is fully adjustable.
* **Visual Buy/Sell Signals:** Clear buy (green upward label) and sell (red downward label) signals are plotted directly on the price chart.
* **Customizable Inputs:** Easily adjust the lengths of the short and long EMAs, as well as the trailing stop percentage, to optimize the strategy for different assets and timeframes.
* **Real-Time Alerts:** Receive instant alerts for buy and sell signals, ensuring you don't miss potential trading opportunities.
**How to Use:**
1. Add the strategy to your TradingView chart.
2. Customize the "Short EMA Length," "Long EMA Length," and "Trailing Stop Percentage" in the strategy's settings.
3. Enable alerts in TradingView to receive notifications when buy or sell signals are generated.
This strategy is intended to provide automated trading signals based on EMA crossovers with built-in risk management. Remember to backtest thoroughly on your chosen instruments and timeframes before using it for live trading.
#EMA
#Crossover
#TrailingStop
#Strategy
#TradingView
#TechnicalAnalysis
#Alerts
#TradingStrategy

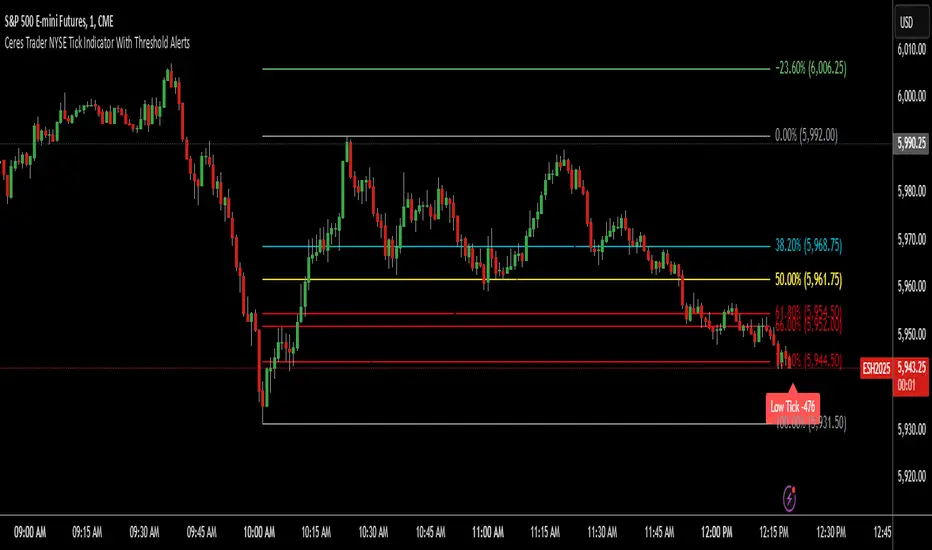
Ceres Trader NYSE Tick Indicator With Threshold AlertsThe Ceres Trader NYSE Tick Indicator provides real-time alerts for significant shifts in the NYSE Tick, empowering traders to identify potential overbought and oversold market conditions. It displays labels directly on the chart when the Tick reaches predefined thresholds, offering a clear and immediate visual representation of market sentiment.
Key Features:
Threshold-Based Alerts:
Highlights "High Tick" and "Low Tick" conditions when the Tick exceeds user-defined thresholds (default: 400 and -400).
Identifies "Extreme High Tick" and "Extreme Low Tick" conditions for more significant shifts (adjusted default: 800 and -800).
Visual Labels:
Displays colored labels directly on the price chart, indicating the type of Tick event and its value.
Green labels signal potential overbought conditions, while red labels indicate potential oversold conditions.
Low tick labels are placed below the price bar, and high tick labels are placed above the price bar for improved visibility.
Real-Time Data:
Utilizes the NYSE Tick symbol ("TICK") to provide up-to-the-minute market data.
User-Friendly Design:
Simple and intuitive design, suitable for traders of all experience levels.
How to Use:
Add the "Ceres Trader NYSE Tick Indicator with Threshold Alerts" to your TradingView chart.
Observe the colored labels that appear when the Tick reaches the specified thresholds.
Use these alerts to identify potential trading opportunities based on overbought or oversold market conditions.
Consider adjusting the threshold values within the indicator settings to align with your specific trading strategy.