Quadruple Moving Average with Alerts [FitzTello]Quadruple Moving Average with Alerts (Quad MA)
Quad MA plots four Simple Moving Averages (SMAs) on the chart to help you quickly visualize trend direction, dynamic support/resistance zones, and key mean-reversion areas.
You can choose a built-in preset for the primary trend pair (7–21, 11–22, or 50–200) or switch to Custom to define your own M1 and M2 lengths. Two additional SMAs (M3 and M4) are always available for extra structure (e.g., intermediate trend, pullback filter, or multi-timeframe alignment).
Alerts included: The script provides separate alert conditions for each SMA whenever price crosses above or below that line (effectively a “touch/cross” event), making it easy to automate notifications when price interacts with your chosen moving-average levels.
Inputs: Preset selector, custom MA lengths (M1–M4), and source (default: close).
在腳本中搜尋"alert"

Fair Value Gaps (40+ Points) with NY Session AlertsFVG with alerts. This works for the NY session only.

Price Range CHoCH Alert🎯 Smart Money Concept (SMC) indicator that monitors a specific price level and alerts only when price touches that level AND
subsequently creates a Change of Character (CHoCH).
Key Features:
• Set a custom price level to monitor
• Detects CHoCH/BOS based on pivot highs/lows
• Alerts ONLY when: Price touches level → CHoCH occurs
• Visual confirmation with level line and status table
• Configurable tolerance for precise level targeting
• Works for both bullish and bearish scenarios
Perfect for:
✓ Institutional level trading
✓ Key support/resistance breakouts
✓ Liquidity grab confirmations
✓ Structure break validation
Simply set your target price level and let the indicator watch for the perfect SMC setup!

REM Algo - Earnings AlertsNot everyone wants to hold positions through earnings announcements — and if you’re evaluating a strategy, earnings-related gaps can distort performance metrics and make results harder to interpret.
This script helps you manage earnings risk by triggering alerts during an Earnings Blackout window. You can:
get an alert to close positions the day before earnings, and/or
receive a reminder not to open new positions on blackout days prior to the earnings announcement.
Add alerts to the stocks you trade. When a blackout day occurs, the script triggers at the hour and minute you choose in the settings. The Earnings Blackout period covers the day before and the day of the earnings announcement, adjusted for weekends and market holidays.
Use it as a standalone risk-control tool — or alongside your existing strategy — so earnings gaps don’t interfere with your trading rules or your backtest results.

SPY Daily Gamma Levels [Manual Input With Alerts]Overview This indicator plots key options-based support and resistance levels (Gamma Exposure / GEX) directly on your chart. Unlike standard technical analysis, these levels (Call Wall, Gamma Flip, Put Support, and Volatility Trigger) represent where Market Makers are positioned, often acting as "magnets" or "repellents" for price action.
Important Note: TradingView Pine Script cannot currently access external options open interest data natively. Therefore, this is a Manual Input Indicator. You must update the four price levels in the settings each morning before the market opens.
Key Features:
4 Key Levels: Plots the Call Wall, Gamma Flip (Zero Gamma), Put Support, and Volatility Trigger.
Auto-Cleaning: Automatically deletes yesterday's lines to keep your chart clean; lines only show for the current session.
Alerts Included: Built-in alert conditions allow you to set notifications when price crosses the Gamma Flip or breaks the Vol Trigger.
Customization: Fully customizable colors and line styles.
Best Practices:
Timeframe: Works best on 15-minute charts for trend identification and 5-minute charts for entry execution.
Strategy:
Above Gamma Flip: Market generally stabilizes; dealers buy dips.
Below Gamma Flip: Volatility expands; dealers sell rips.
Below Vol Trigger: "Danger Zone" – expect accelerated selling pressure.
How to Get the Data (The AI Workflow)
Since these numbers change daily, I use Google Gemini to fetch the data and remind me every morning. Here is how you can set up the same automated workflow:
1. The Prompt You can ask Gemini (or your preferred AI) the following prompt manually each morning:
"Find the daily SPY Call Wall, Gamma Flip, Put Support, and Vol Trigger levels for today to input into my TradingView indicator."
2. Automating the Routine I have set up a scheduled daily reminder with Gemini. To do this yourself, simply ask Gemini:
"Can you schedule a daily task to search for these SPY Gamma levels and send them to me every morning at 8:00 AM?"
3. Updating the Chart
Receive the notification from the AI.
Open the Indicator Settings in TradingView.
Type in the new numbers.
The chart updates instantly.
Disclaimer: This tool is for educational purposes only. Gamma levels are estimates based on Open Interest and Dealer Gamma exposure models. Always manage your risk.

BTC 1H Momentum + Near-Setup Alerts bigbeeukthis alert, sets up on 1h chart of BTC only. it alerts you to price action and when its close to a setup. it will then trigger again once the setup is ready

Price Movement Alert with Previous Close as ReferenceFunctionality of the Indicator
The "Price Movement Alarm with Previous Day Close as Reference" indicator is a tool that helps you monitor significant price levels based on the previous day's closing price. The indicator calculates both decline and rise thresholds in specified percentages to generate potential trade alerts. The lines on the chart represent these thresholds, and the corresponding labels show the exact percentage.
Usage Instructions:
Previous Day's Close: The indicator uses the previous trading day's close as the reference point.
Setting Decline and Rise Percentages: You can adjust the alarm levels for declines (e.g., 0.5%, 1.0%, 1.5%, 2.0%, 2.5%, 3.0%) and rises (e.g., 0.5%, 1.0%, 1.5%, 2.0%, 2.5%, 3.0%).
Lines and Labels: The indicator draws lines on the chart and displays labels that indicate the percentage of price movement.
Market Analysis: Analyze the price movements to make potential trading decisions.
Market in Equilibrium:
A market is in equilibrium when price movements remain within a narrow range (e.g., 0.5% to 1%). During this phase, volatility is low, and there are no significant price changes.
Market not in Equilibrium:
A market is not in equilibrium when price movements fall outside the narrow range (e.g., above 1%). During this phase, larger price movements can occur, often triggered by news or economic events.

Awesome SuperTrend Zone Dynamic Alerts// created by © OmegaTools, upgrade to v6 and alert condition added
//@version=6
Awesome SuperTrend Zone Alerts with dynamic alerts

Triple EMA (5, 8, 13) + Confirmed Alerts with SoundThis indicator uses three Exponential Moving Averages (EMA 5, 8, and 13) to generate buy and sell signals when the EMAs are properly aligned and not touching. Signals are confirmed on candle close and can trigger customizable sound alerts directly from the TradingView alert panel.

Triple EMA (5, 8, 13) + Confirmed Alerts with SoundThis indicator uses three Exponential Moving Averages (EMA 5, 8, and 13) to generate buy and sell signals when the EMAs are properly aligned and not touching. Signals are confirmed on candle close and can trigger customizable sound alerts directly from the TradingView alert panel.
BTC Confluence Alert 1 Overall Purpose
This script is a custom TradingView indicator that scans for confluence (agreement) between:
BTC’s short-term and medium-term momentum (12-minute and 1-hour RSIs),
The MACD histogram (trend direction and momentum strength),
Bitcoin dominance (money flowing back into BTC).
When all three are bullish, it flashes green and triggers a single alert.

Divergences + Alerts (ANY Indicator)📊 Divergences + Alerts (ANY Indicator)
This versatile indicator detects four types of divergences between price action and an oscillator:
Buyer Exhaustion
Buyer Absorption
Seller Exhaustion
Seller Absorption
Each divergence type is automatically identified and visually marked on the chart with colored lines. The indicator also includes built-in alert conditions for all four divergence types, allowing traders to receive real-time notifications when potential reversal signals occur.
By default, the oscillator is a candle-style visualization of the Money Flow Index (MFI), enhanced with volatility filtering via a VWMA-based ATR. However, users can replace the default MFI oscillator with any external source using the “Plug External Source” input, enabling full customization and compatibility with other indicators.
Key features:
🔍 Detects both exhaustion and absorption divergences
🔔 Alerts for each divergence type
🕯️ Candle-style oscillator visualization
🔌 Optional input for external indicator sources
⚙️ ATR-based filtering for precision
Ideal for traders seeking to spot early signs of trend reversals or momentum shifts with customizable flexibility.

Multi-Market Trend-Pullback Alerts (EMA20/50 + RSI) [v6]//@version=6 replaces 5
Some functions (like label.delete) need to be called as methods
Minor syntax tightening around string concatenation and label management
All alertcondition() and table logic still works, but must be explicitly version 6 compatible

34 EMA Cross Alert (Once per sequence)This script is used when 5-12 EMA is above 34-50 EMA and if price corrects to 34-50 cloud and bounces i.e. price crosses below 34 EMA and then cross above 34 EMA, it will trigger alert.
MTF FVG Confluence v6 — JSON Alerts via alert()This strategy combines multi-timeframe confluence with candlestick analysis and fair value gaps (FVGs) to generate structured long/short entries. It aligns Daily and 4H EMA trends with 1H MACD momentum, then confirms with engulfing candles and FVG zones for precision entries. Risk management is built-in, featuring stop-loss, 3R take-profit targets, and optional break-even logic, with dynamic JSON alerts for webhook automation.
Categories:
Candlestick analysis
Chart patterns
Cycles

EMA 9/21 Crossover Alert (BerryRight)This indicator gives entry signals through EMA crossover and the gives the opportunity to set up alerts. I will update this indicator with exits in the future. it's written in Pinesctipt v5

Inside Bar With Alert - RajThis indicator helps you reduce your screen time by giving you consistent alerts on the formation of inside bar candle and it gives you bullish and bearish alerts on breakout of the mother candle. So if you believe in inside strategy this indicator will be helpful for you.

Impulse Alert - Supply (Sell) [Fixed]🟥 Supply Zone (Sell) – Institutional Order Block Detector
This custom indicator automatically detects valid Supply Zones (Sell Zones) based on Smart Money Concepts and institutional trading behavior.
🔍 How It Works:
Identifies strong bearish impulsive moves after price forms a potential Order Block
Valid supply zones are plotted after:
A valid rally–base–drop or drop–base–drop structure
A shift in structure or clear imbalance is detected
The zone is created from the last bullish candle before a strong bearish engulfing move
Zones remain on chart until price revisits and reacts
📊 Use Case:
Ideal for traders using Smart Money Concepts (SMC), Supply & Demand, or ICT-inspired strategies
Perfect for scalping, day trading, or swing setups
Designed for confluence with HTF bias and LTF execution
⚙️ Features:
Supply Zone auto-plotting
Customizable zone color and opacity
Alerts when price returns to the zone (retest entry opportunity)
🧠 Tip for Best Use:
Use in confluence with:
HTF Supply zones (manual or other indicator)
Market Structure breaks
Fair Value Gaps or Imbalance zones
Strong impulsive moves from HTF to LTF
🔁 Future Additions (Coming Soon):
Demand Zone detection
Zone strength rating system
Refined zone filters (volume, candle size, etc.)
Alerts for mitigation or invalidation
📌 Created by: Rohit Jadhav | Real-time market trader | YT/Insta - @GrowthByTrading
💬 Feedback? Drop a comment or connect via profile for updates and tutorials!

ATR Trailing + Alerts + Price LabelsATR Trend is a clean and intelligent trend-following overlay built for traders who want clarity during both trending and ranging markets.
This indicator dynamically detects bullish and bearish market trends using the Average True Range (ATR), applying a confirmation-based approach to filter out false signals and minor pullbacks.
The trend line is:
Blue 🔵 during uptrends.
Black ⚫ during downtrends.
Continuous, recalculating only when the market truly shifts — not just when price temporarily crosses the line.
When a confirmed trend reversal occurs:
A 🔼 or 🔽 label shows the exact price of the flip.
An alert can be triggered to notify the user immediately.
💡 Features:
✅ Single-line trend direction
✅ Filters out short-term noise
✅ Exact price labeling on trend change
✅ Built-in alerts for up/down trend shifts
⚙️ Inputs:
ATR Period – Length of ATR calculation (default: 14)
ATR Multiplier – Offset for trend line placement (default: 2.0)
Flip Sensitivity – Number of bars required to confirm a trend reversal (default: 3)
This tool is suitable for:
Swing traders avoid false breakouts
Scalpers looking for high-probability trend entries
Algorithmic setups requiring structured trend logic

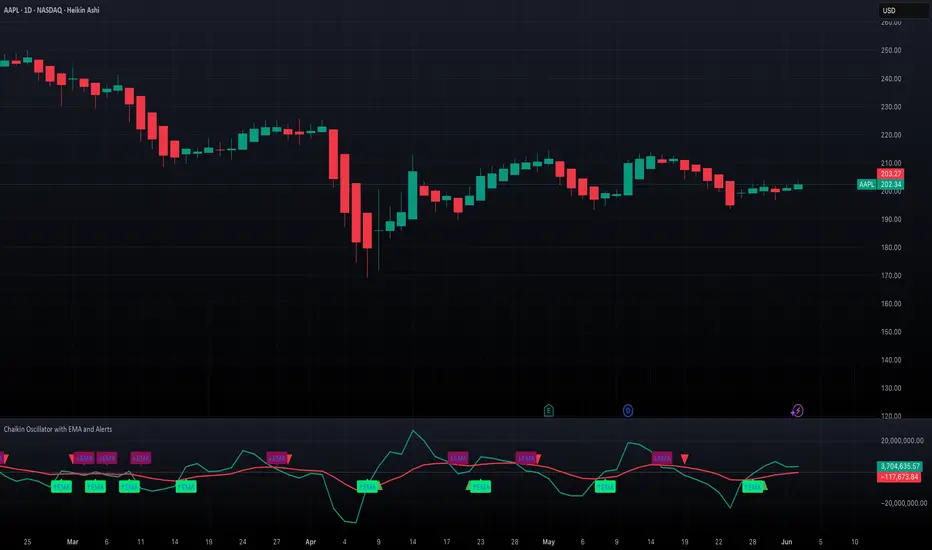
Chaikin Oscillator with EMA and AlertsOverview
This indicator plots the classic Chaikin Oscillator along with an EMA overlay to help identify changes in accumulation or distribution momentum. It includes visual markers and built-in alerts for key crossover events such as crossing the zero line and crossing above or below the Chaikin EMA.
Concepts
The Chaikin Oscillator is calculated as the difference between two EMAs of Accumulation/Distribution (A/D) volume. It is used to measure the momentum behind buying and selling pressure. An EMA is applied to the oscillator itself to smooth out signals and provide an additional layer of trend confirmation. Crossovers above or below zero, and above or below the EMA, are interpreted as potential signals of market sentiment shifts.
How to Use the Indicator
Apply the indicator to any chart and select your preferred short, long, and EMA lengths. The script will plot the Chaikin Oscillator in teal and its EMA in red. Triangles and labels will appear on the chart when the oscillator crosses above or below the zero line, or when it crosses its EMA. Green triangles indicate bullish zero-line crossovers, while red triangles indicate bearish ones. Lime and maroon labels signal EMA crossovers. Use these signals to assess momentum shifts and potential entry or exit points.
Interpretation
When the Chaikin Oscillator is above zero and rising, it suggests strong buying pressure. When it is below zero and falling, it suggests strong selling pressure. A crossover above the EMA may indicate an emerging bullish trend, while a crossover below the EMA may suggest increasing bearish momentum. Using both the zero line and EMA crossover together helps filter noise and improves reliability of momentum-based signals.
Notes
The indicator includes four alert conditions that can be enabled in TradingView to notify you of Chaikin Oscillator crossovers. It works across all asset classes and timeframes. This tool is especially useful for identifying momentum shifts ahead of price moves and for confirming volume-based signals in trend continuation or reversal scenarios. Adjust input lengths to suit your trading style or the volatility of the instrument you are analyzing.
EMA 200 Price Deviation Alerts (1H Only)This script monitors the price deviation from the 200-period Exponential Moving Average (EMA) exclusively on the 1-hour chart. It generates alerts when the absolute difference between the current price and the EMA 200 exceeds a user-defined threshold (default: 65).
Features:
Works only on 1-hour (60-minute) charts to avoid false signals on other timeframes.
Customizable deviation threshold via script input.
Visual display of the 200 EMA on the chart.
Alert system to notify when price deviates significantly above or below the EMA.
Buy/Sell arrows shown when conditions are met:
Sell arrow appears when price is above the EMA and deviation exceeds threshold.
Buy arrow appears when price is below the EMA and deviation exceeds threshold.
Use this tool to identify potential overextended price moves relative to long-term trend support or resistance on the 1H timeframe.
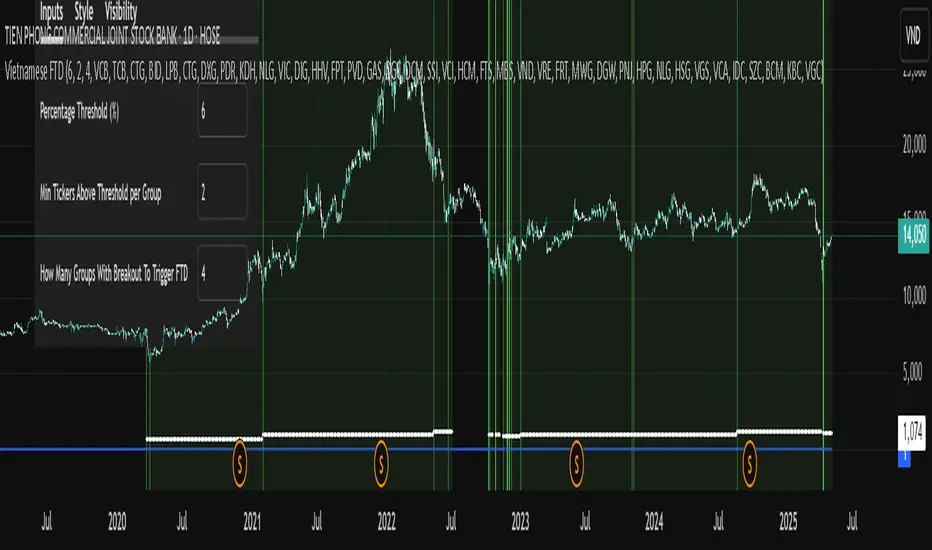
Vietnamese Stock Market FTD (Follow Through Day) AlertA Pine Script implementing William O'Neil’s Follow Through Day (FTD) strategy for the Vietnamese stock market. It scans 7 predefined sector groups (Banks, Real Estate, Retail, etc.) to detect momentum breakouts.
Key Features :
Triggers an FTD signal when ≥X groups (default: 3) have ≥Y stocks (default: 2) rising above a Z% threshold (default: 5%) daily.
Highlights qualifying stocks by group in a dynamic label during alerts.
Visualizes strength via histograms and background shading.
Open-source under Mozilla Public License 2.0 .
Purpose : Identify institutional buying and potential market reversals.
3SMA +30 Stan Weinstein +200WMA +alert-crossingIndicator Description: Stan Weinstein Strategy + Key Moving Averages
🔹 Introduction
This indicator combines the Classic Stan Weinstein Strategy with a modern update based on the author’s latest recommendations. It includes key moving averages that help identify trends and potential entry or exit points in the market.
📊 Included Moving Averages (Fully Customizable)
All moving averages in this indicator have modifiable parameters, allowing users to adjust values in the input settings.
1️⃣ 30-Week SMA (Stan Weinstein): A long-term trend indicator defining the asset’s main trend.
2️⃣ 40-Week SMA (Weinstein Update): An adjusted version recommended by the author in his recent updates.
3️⃣ 10-Day SMA: Displays short-term price action and helps confirm trend changes.
4️⃣ 100-Day SMA: A medium-term trend measure used by traders to assess trend strength.
5️⃣ 200-Day WMA (Weighted Moving Average): A very long-term indicator that filters market noise and confirms solid trends.
🔍 How to Interpret It
✔️ 30/40-Week SMA in an uptrend → Confirms an accumulation phase or an upward price trend.
✔️ Price above the 200-WMA → Indicates a strong and healthy long-term trend.
✔️ 10-SMA crossing other moving averages → Can signal an early entry or exit opportunity.
✔️ 100-SMA vs. 200-WMA → A breakout of the 100-SMA above the 200-WMA may signal a new bullish phase.
🚨 Built-in Alerts (Key Crossovers)
The indicator includes automatic alerts to notify traders when key moving averages cross, allowing timely reactions:
🔔 10-SMA crossing the 40-SMA → Possible medium-term trend shift.
🔔 10-SMA crossing the 200-WMA → Confirmation of a stronger trend.
🔔 40-SMA crossing the 200-WMA → Long-term trend reversal signal.
💡 Customization: All moving average periods can be adjusted in the input settings, making the indicator flexible for different trading strategies.
