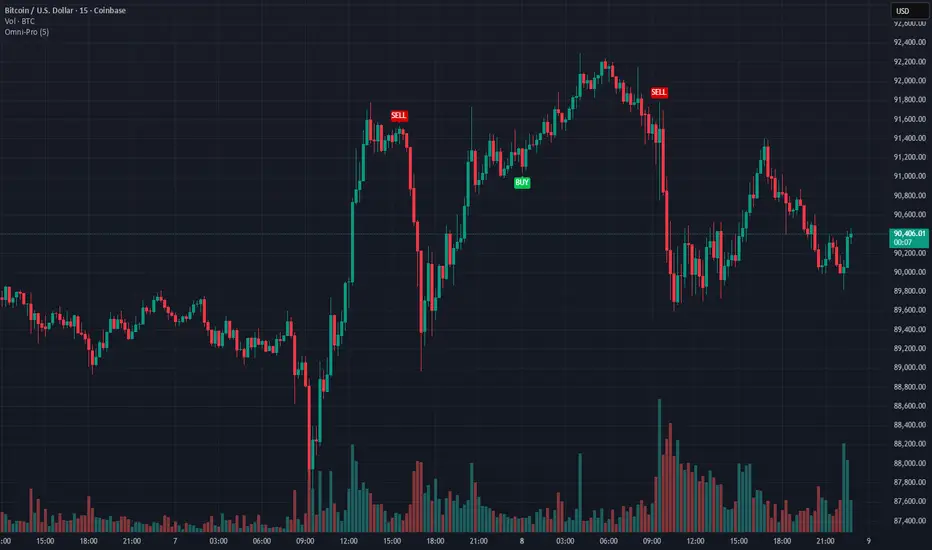
AZ Capital S & ROverview
The algorithm endeavours to robotize the identification of support and resistance levels by recognizing enormous swings/turns in authentic value activity.
These tops and bottoms in value activity shows where the bunches of buyers or sellers came into the market and may go about as future degrees of support or resistance.
The code identifies the last 3 huge swing highs and the last 3 swing lows. It at that point places lines on the outline to feature those levels.
In support and resistance hypothesis, frequently the support becomes resistance and the other way around. Along these lines, the algorithm doesn't just sort swings lows as "support" and swing highs as "resistance". All things considered, the algorithm takes a gander at the swing position comparative with the current close cost.
In the event that the price is over the level, the algorithm thinks of it as support. On the off chance that the price is beneath the level, the algorithm believes it to be resistance.
In light of this, the lines are naturally shaded by whether the prices are above or beneath the current close cost. At the point when any of the levels are beneath the nearby value, the lines are shaded green. Then again, at whatever point they are over the nearby, they are shaded red.
在腳本中搜尋"algo"
Spiral Guide Algorithm [V2]Spiral Guide Algorithm (SGA)
At its core, the Spiral Guide Algorithm is a low noise, un-bounded, oscillating cycle indicator designed to capture state change within a non-Gaussian distribution.
The idea, design, and application of the Spiral Guide Algorithm is rooted in first principles from four core areas of study, and in application proves to be an excellent trend following tool.
The Spiral Guide Algorithm produces and visualizes three principal components. Below we will cover each of those areas, as well as, how to apply this algorithm in trade analysis.
Principal Components
1. SGA Signal = waveform fundamental signal line
2. SGA Filtered Signal = finite impulse response filter of the SGA signal
3. SGA Histogram = delta between SGA signal and SGA filtered signal
Theory of Operation
1. Digital Signal Processing (DSP)
a. The SGA applies a DSP technique used in wireless transmission that decomposes a waveform into discrete components and then quantifies the interaction between each of those components.
2. Complex Systems Theory
a. In complex systems the tail often wags the dog and so SGA focuses not on the average of the distribution, but on the edges.
3. Game Theory
a. Positive feedback drives large changes from historical extremes, so targeting points of extreme oscillation offers the best chance of capturing large changes in the distribution.
4. Auction Theory
a. We know the auction process cycles between two phases:
i. At value
ii. Discovering value
b. SGA is designed to capture much of the “value discovery” phase between two “at value” areas.
Derivatives
1. When the SGA signal line is above 0 the time frame is up-trending
2. When the SGA signal line is below 0 the time frame is down-trending
3. A fundamental time frame shift is occurring when SGA signal line crosses 0
4. The ratio of SGA signal line time above 0 vs time below 0 will expose the current time frame bias (long, short, flat)
Application
1. Trades are signaled when the SGA signal line crosses the SGA filtered signal, and the trade is confirmed when the SGA filtered signal changes state.
2. Trades can be entered when the SGA signal line crosses 0.
3. SGA should align with the following before entering a trade: Structure, Cycles, Fractals.
4. The histogram is used for detecting divergence.
When and Where
1. Due to the large number of sample sets needed to calculate the SGA signal line, the SGA is designed for intraday charting.
2. Monitor multiple time frames around entry and exit time frame to satisfy the fractal requirements. As a rule, a 3-5x fractal above and below the entry and exit time frame is needed to align cycles.
3. For example:
a. Tick data or 1 second
b. 1 min
c. 5 min (entry/exit)
d. 15 min
4. This algorithm sees success in markets that are not mean reversion biased.
a. Trending markets with high volatility provide the best results.
(FireflyTA) Algo Score MTFAlgo Score MTF
The Algo Score MTF is a meta-analytic oscillator telling you about the technical market strength . It is analyzing a variety of different indicators and metrics to come up with a score that gives you an impression on whether the medium timeframes have fuel to go higher or if it's running out and the risk increases to see corrective price action.
----------------------
About Technical Market Strength
Algo measures the technical strength with a score between -10 and 10 . A bullish or bearish technical market strength shows a high correlation with bullish or bearish PA soon after the score reaches the significant levels deviating from 0. However, optimal treshold values (meaning the score after which the strength can be considered bullish or bearish) vary depending on the market looked at. For BTCUSD, the default values used can be seen as reference. If you want to apply Algo to other markets, you will have to calibrate the tresholds yourself.
It is important to know that market strength is the fuel to drive price higher or lower, but it is not the trigger. The trend is of superior importance. So when price is in a strong uptrend (in this case on the MTF), and the score reaches a value of -4 or lower (which can be considered bearish), it can still take a while for the trend to shift because of the strong momentum. The score in this case can be used as an indicator to show you times when it is wise to take profits / de-risk or take extra care in your risk management in general.
----------------------
Indicators used
All the indicators mentioned are calculated separately and weighted by the significance value you can customize in the indicator UI. It is also possible to (1) deactivate certain indicators and (2) force them as required, so that a signal in the oscillator only occurs when the indicator(s) that is/are required support the thesis (bullish vs. bearish).
Daily VWAP
MTF Trend
Traditional Bollinger Bands
RSI
MTF RSI Divergence
Stoch RSI
Ichimoku Cloud
Fib Retracement Levels
MACD
TTM Squeeze
Moneyflow
Custom Levels you can define (3 categories: Major, medium, minor)
For some indicators, there are specific settings to customize how they contribute to the overall score (i.e. MACD cross vs. shift vs. trending phase). It is also important to know that Algo fetches the indicator data from multiple timeframes, thereby adding reliability to the overall results.
----------------------
Algo Custom Logic
Algo is using my custom logic on when a certain indicator can be interpreted as bullish or bearish in the MTF horizon. If you want to find out about the reliability of certain indicators, I recommend disabling all the indicators except for the one you want to examine, and then see how the score reacts to price action.
----------------------
Timeframes
Due to script limitations, this version can only analyze the medium timeframes . It is best used with charts 2H+, it works on some 90m as well but ceases to work at 1H and below . It is also not compatible with higher timeframes . Upon using the same settings on the same ticker with different timeframes, you will see that the score shows a minor variance. This is because data is consolidated to match the timeframe, so it ultimately leads to minor differences. Find out for yourself what timeframe is the best to use with which market and which settings.
----------------------
How to Use
I'm going to add tooltips for the settings in the indicator UI with upcoming updates, so it becomes more clear on how to set Algo up properly. To prevent a loss of your customized settings, write them down somewhere in case a script update reverts the settings back to default.
You can find in-depth tutorials on how to use this indicator by browsing the links and resources in my signature.

Percentile Rank Market FilterA simple script to filter bull and bear markets by using percentile rank filter. Using market regimes to filter by bull/bear/sideways markets helps to understand how your strategy will
behave in various market regimes and allows you to avoid unprofitable regimes and only trade in profitable ones.
The idea of market regime filtering is used in the most successful technical algorithmic trading strategies, as one should always design a trading strategy with a particular market in mind according to trading legend, Larry Connors
Feel free to use this script in your strategies to improve your profits and lower drawdowns.

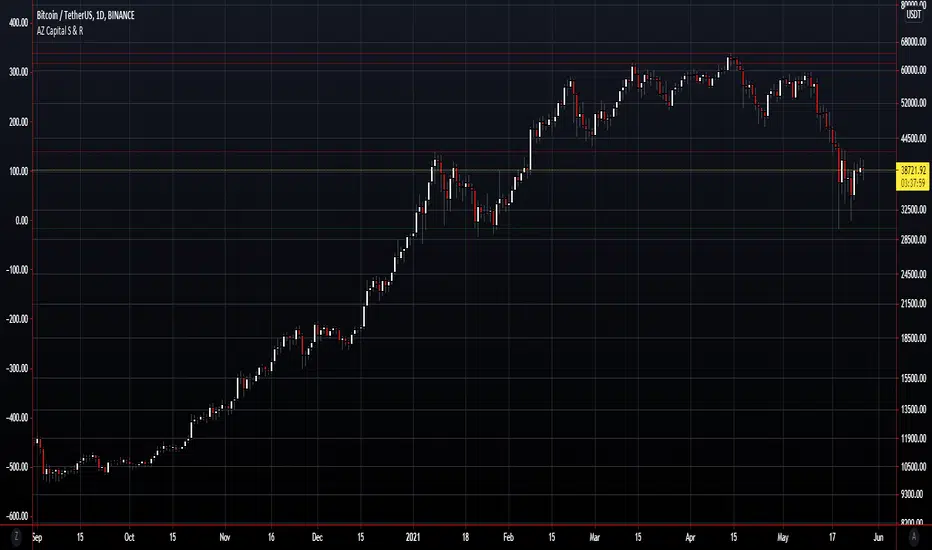
AZ Capital Lite 2.0
AZ Capital Lite 2.0 is the Updated Version of our Previous Lite Version of our trading algorithm/indicator. This algorithm is once again based on different indicators such as RSI and a combination of MA's along with ATR. Custom values that provide assistance to our PRO trading algorithm helping concluding analysis and finalising a trade even better.
AZ Capital Lite 2.0 combines various default indicators with custom values into One simple algorithm that helps the user to assess if an asset is moving upward or downwards.
AZ Capital Lite 2.0 works perfectly along with our AZ Capital PRO algorithm/indicator and helps the user to finalise the movement of an asset.
For Past Performances of this Algorithm/Indicator, Contact me Privately!
If you have any doubts on how to use the Algorithm/Indicator, Contact me Privately!
Commenting is RESTRICTED to only Comments about the Algorithm/Indicator and NOT asking for HOW-TO's and ACCESS!
Always DYOR and Trade Safely!
Regards,
Azyad (Founder of AZ Capital)

RogTrader HFT AlgoThis is a simple algorithm to generate Buy, Sell, Short, and Cover Signals. It uses the following:
RSI , MACD , Stochastic , Bollinger Bands , Ketler Channels, ATR Trailing Stop, Trend, and Volume .
Usage is simple: Green Background is Long and Red Background is Short positions.
LE = Long Entry
LX = Long Exit
SE = Short Entry
SX = Short Exit
This is not a trade recommendation, rather informative signals, and please do your due diligence. Thanks!

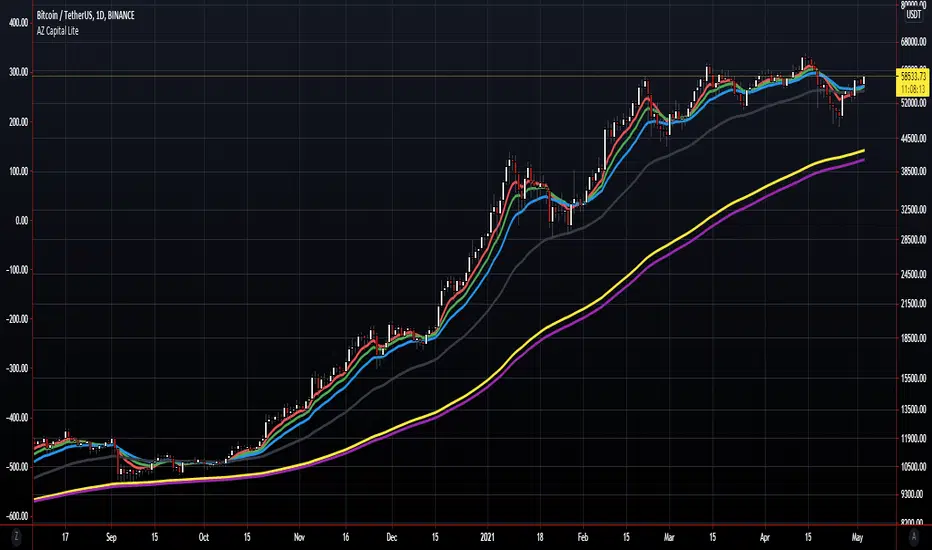
AZ Capital Lite
AZ Capital Lite is an additional feature of our AZ Capital PRO trading algorithm/indicator which is again based on different indicators such as RSI and EMA with custom values to provide assistance to our PRO trading algorithm helping in concluding analysis and finalising a trade.
RSI and EMA are two great indicators to access the movement of the asset and AZ Capital Lite makes those 2 different indicators into One simple indicator which helps the user to assess if an asset is moving upwards or downwards.
AZ Capital Lite also works along with our AZ Capital PRO algorithm/indicator helping to finalise the movement of an asset.
AZ Capital Lite is just using a customised and combined version of the regular EMA and RSI indicator available on TradingView.
For Past Performances of this Algorithm/Indicator, Contact me Privately!
If you have any doubts on how to use the Algorithm/Indicator, Contact me Privately!
Commenting is RESTRICTED to only Comments about the Algorithm/Indicator and NOT asking for HOW-TO's and ACCESS!
Always DYOR and Trade Safely!
Regards,
Azyad (Founder of AZ Capital)
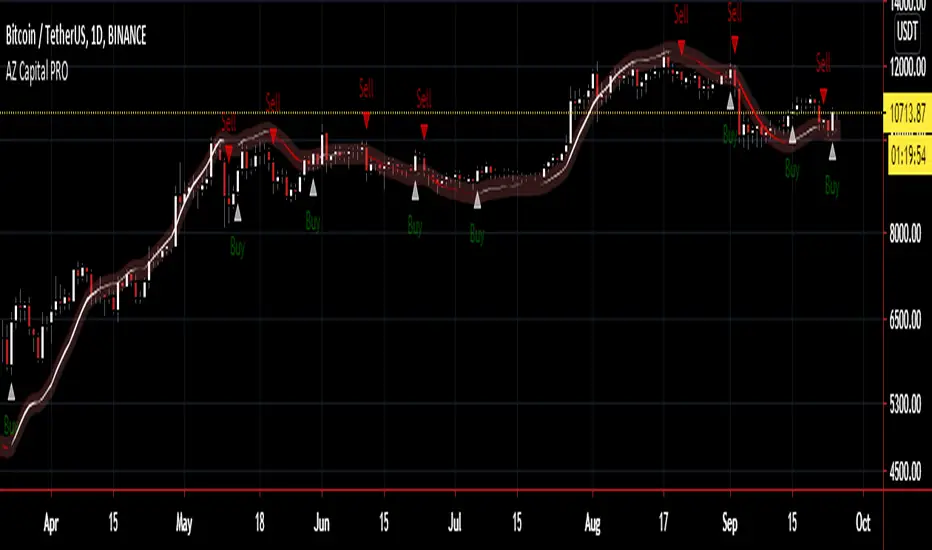
AZ Capital PRO
AZ Capital PRO is a Trading Algorithm/Indicator for TradingView that brings to the user the easiest way to trading.
The Algorithm depends on different indicators such as the EMA and TMA with custom values to point the user with the best occasions to set up a Long (Buy) or Short (Sell) position on any asset on the Financial Markets.
EMA and TMA are two great indicators to access the movement of the asset and AZ Capital PRO makes those 2 different indicators into One simple indicator which helps the user to access if an asset is moving upwards or downwards.
AZ Capital PRO is just using a customised and combined version of the regular EMA and TMA indicator available on TradingView.
Along with printing a Buy/Sell Signal on the Chart, AZ Capital PRO also indicates the trend.
Each sign in the chart will be shown while the candle is dynamic yet signs at candle close are conclusive and won't repaint. The Algorithm works with any candle accessible on whatever timeframe accessible for any market accessible in TradingView.
The Algorithm works best under littler timeframes since there's more information accessible than higher timeframes. For the most extreme benefit, check diverse periods for affirmation.
The Algorithm shows two unique signs for entry or exit on a resource to expand its gainfulness. Keep in mind, signs can show up whenever during an open candle, yet once the sign is displayed on the close candle; it's conclusive and won't change later on.
For the Algorithm/Indicator Past Performance, Contact me Privately!
If you have any doubts on how to use the Algorithm/Indicator, Contact me Privately!
Commenting is RESTRICTED to only Comments about the Algorithm/Indicator and NOT asking for HOW-TO's and ACCESS!
Always DYOR and Trade Safely!
Regards,
Azyad (Founder of AZ Capital)
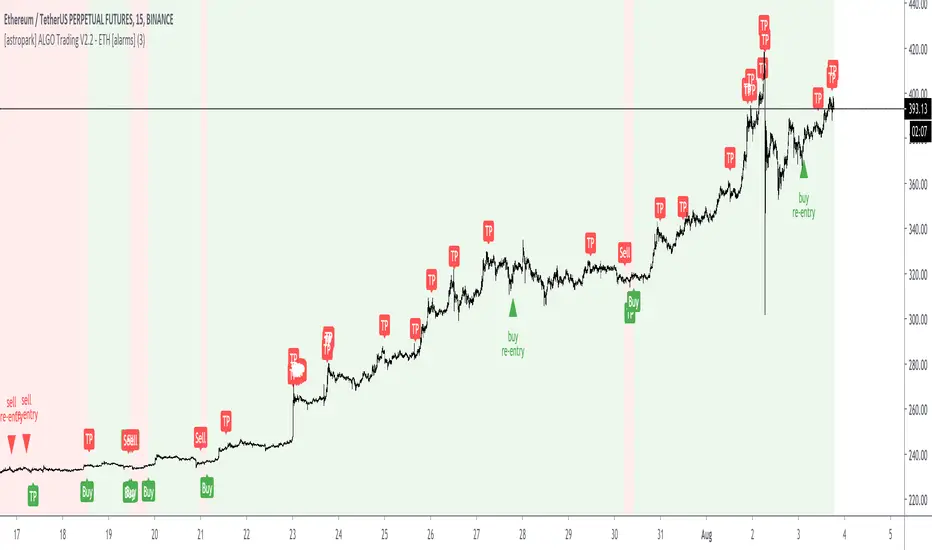
[astropark] ALGO Trading V2.2 - ETH [alarms]Dear Followers,
today another awesome Swing and Scalping Trading Strategy indicator : the upgraded version of ALGO Trading V2 for Binance Ethereum PERP on 15m timeframe!
It is runnable on a bot , just write me in order to help you do it.
If you are a scalper or you are a swing trader, you will love suggested entries for fast and long-lasting profit.
Keep in mind that a proper trailing stop strategy and risk management and money management strategies are very important (DM me if you need any clarification on these points).
This is an upgrade version of ALGO Trading V2 for Ethereum.
You can find ALGO Trading V2 indicator here below:
If you are interested in Bitcoin Trading, you will like for sure ALGO Trading V1.2, which is a customized version for Bitcoin trading:
This strategy has the following options:
enable/disable signals on chart
enable/disable bars and background coloring based on trend
enable/disable a Filter Noise option, which reduces overtrading
enable/disable a Trailing Stop option
enable/disable/config a Take Profit option, with Re-Entry
enable/disable a secret Smart Close Option which may improve profit on your chart (again, check it on you chart if it helps or not)
This strategy only trigger 1 buy (where to start a long trade) or 1 sell (for short trade). If you enable Take Profit / Stop Loss option, consider that many TP can be triggered before trend reversal, so take partial profit on every TP an eventually buy/sell back lower/higher on RE-ENTRY signal to maximize your profit.
This script will let you set all notifications you may need in order to be alerted on each triggered signals.
The one for backtesting purpose can be found by searching for the astropark's "ALGO Trading V2.2" and then choosing the indicator with "strategy" suffix in the name, or you can find here below:
This is not the "Holy Grail", so use proper money and risk management strategies.
This is a premium indicator , so send me a private message in order to get access to this script.
Stock Algorithm Trend AnalysisThis algorithm is meant to be used on stocks but also works well with cryptocurrencies, forex pairs and indexes. This software helps traders take advantage of momentum trading and by riding trends. It works best when playing the underlying symbol in a bullish sense when the algorithm says "likely to rise" and in a bearish sense when the algorithm says "likely to fall".
Send me a private message on TradingView to gain access.

Tradespot Quant Tradespot - Quant is an extensive trading algorithm, signal generator and technicals screener packed into one beautifully designed, functional indicator. The script is very customisable to not limit the trader using it but does have some very respectable settings for BTCUSD & ETHUSD on the 4H and 45M charts that we run in an automated fashion here a tradespot round the clock on Binance Futures.
What does Tradespot Quant do?
Trade following signals generated via our bespoke algorithm
Full customisation to allow a deeper use of the indicator across different assets
Beautifully illustrated 'Take Profit' and 'Stop Loss' levels that are configurable to easily see how successful the model can run
Presets for BTCUSD & ETHUSD on the 4H/45M timeframes avaliable instantly for your use.
Innovative trade panel that illustrates key information such as what trade the algorithm is looking for next? is altcoin trading deemed safe or risky right now? How are the technicals looking regarding the overal market trend?
More features being added all the time, we have great ideas and our only limitation is how fast we can program it!
Do you do a free trial?
Yes! Get in touch for a complimentary 48 hour free trial to the indicator, no strings attached.
Who are you?
Tradespot has been creating scripts for years on TradingView that we use to leverage our social trading and signal group offerings. We currently have over $200K in assets trading with our strategies across over 300 users.
You can learn more about us on our website. Please reach out to me or see the link on our profile.

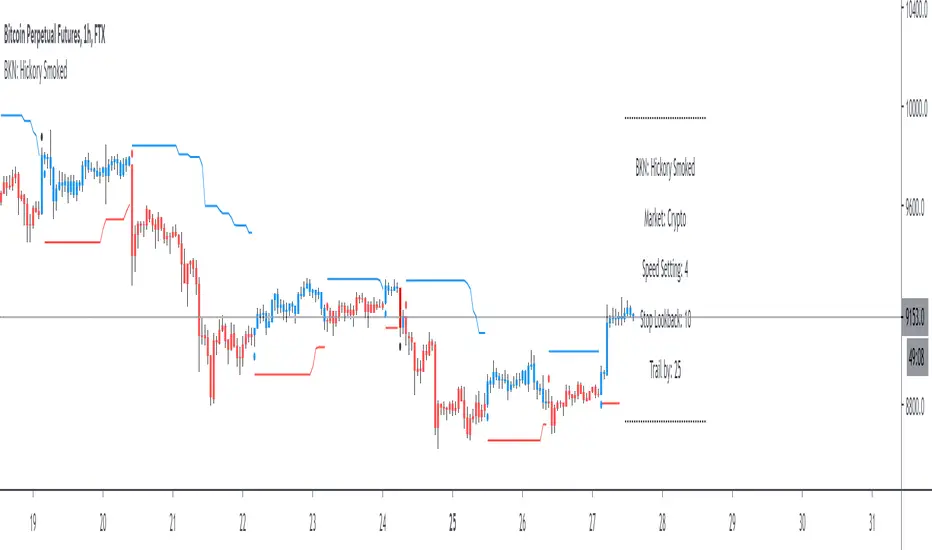
BKN: Hickory SmokedWelcome to the BKN: Hickory Smoked Indicator. This is an algorithmic indicator that thrives in trending environments. We've included settings for crypto and forex and speed options for lower timeframe entries.
The script offers a stop loss or trailing stop loss that will trigger when an entry is triggered. You can also choose to use it as long or short only.
This indicator is automation ready with alerts for both opening and closing positions.
***IMPORTANT***
For access, please do not comment below. Instead, send a DM here on TradingView or on my linked Twitter account.
LuxAlgo® - Signals & Overlays™Signals & Overlays™ is an all-in-one toolkit made up of more than 20+ features primarily focused on generating useful signals & overlays to fulfill any trader's technical analysis needs with relevant data.
Created directly with TradingView Pine Script Wizard, alexgrover - this is a first of its kind comprehensive script made fully from the ground-up to provide an all-in-one solution for traders.
Signals & Overlays™ can be used alongside other forms of technical analysis, however, it was also designed to be used as a stand-alone toolkit that can fit any trading style. Every feature included considers how not all technical indicators fit every market condition.
The ideal way to utilize this indicator is to explore through all of the features over time, pick & choose 2-3 features best suit your style of trading, and stick with those to create your own unique LuxAlgo trading strategy.
Providing Endless Possibilities Catering To All Trading Styles
Signals & Overlays™ works in any market for discretionary analysis & includes many features:
Beginner-friendly Presets to enable multiple features at once within one-click (locks other settings when enabled).
Confirmation Signals: Normal & Strong signals to help traders confirm trends (not to be followed blindly).
Contrarian Signals: Normal & Strong to help traders spot reversals (also not to be followed blindly).
Exit Signals: "x" marks that apply for both Confirmation Signals & Contrarian Signals to suggest potential take-profit areas during signals.
Signal Optimization Methods: Sensitivity / Agility, optimal sensitvity parameter displayed on dashboard, and Autopilot (dynamic setting).
Candle Coloring: Purple/Green/Red to visualize trends developing between 'normal' & 'strong'.
6+ Indicator Overlays that helps traders visualize trends, find reversal points, and get dynamic areas of support & resistance.
Filters within "Presets / Filters" to allow users to filter Confirmation Signals with Indicator Overlays & other metrics within LuxAlgo Premium.
A complete dashboard with highly actionable metrics such as Trend Strength, current volatility, volume analysis, etc.
Advanced Settings to display customizable TP/SL points, further enhance signal optimizations, & customize dashboard size/location.
Full Any Alert() Function Call Conditions included
Highly useful Filtered Alert Creator section to generate custom filtered signal alerts with Indicator Overlays & other metrics.
+ more. (Check the changelog below for current features)
🔶 USAGE
Basic Signals & Candle Coloring Demonstration
In the image below we can see a basic example of how these 2 core components function within Signals & Overlays™.
As explained earlier, the Confirmation Signals can generate normal labels as well as strong labels marked by the "+" symbol. These signals are directly correlated to the candle coloring in order to see the development of trends & navigate through different market conditions as best as possible.
The candle coloring comes especially in handy when using signals, whereas a positive sign for an uptrend to occur rather than a fake-out is to see candles consistently hold as green. This indicates the market is strong & is likely to continue an uptrend. Vice versa for sell signals & the candles holding as red.
Normal Confirmation Signals often occur with smaller trends, retracements within larger trends, or just as signals a user may not want to trust as much directly. In order to enhance your ability to trust signals more & find more actionable use cases out of LuxAlgo Premium, we recommend going to the settings menu of the indicator & activating some indicator overlays. These are covered in the next section.
🔶 INDICATOR OVERLAYS W/ SIGNALS
In the image below we have enabled the "Smart Trail" & "Reversal Zones" indicator overlays from within the settings of Signals & Overlays™. By using these overlays alongside the signals & candle coloring, users can find more confluence to create trading strategies or plans.
The Smart Trail provides an excellent area of dynamic support/resistance for traders, as well as an additional confluence for general trend following purposes alongside the Confirmation Signals.
The Reversal Zones are particularly useful for areas to immediately take profit on trades, however, during strong trends price may continue rising or falling through the Reversal Zones which makes a good use case of waiting for price to first exit the Reversal Zones before considering the next move in the market.
In the next image below we can see the market is generally ranging, making it more complicated for the standard Confirmation signals to perform greatly as they are meant to excel for finding developing trends. This image displays the Contrarian Signal Mode, Contrarian Gradient candle coloring, as well as the Trend Catcher Indicator Overlay to help us trade these market conditions specifically.
Paired with the Contrarian based candle coloring, these signals can be helpful to a trader looking to find confluent reversals. You can also see the Trend Catcher indicator overlay gives a hybrid approach to analyzing the underlying trend within this price action.
Some traders naturally are Contrarian in nature, so this signal mode may be of primary interest to them, however, most of the use cases will come from the standard Confirmation sigals paired with other overlays or regular technical analysis.
🔶 SIGNALS WITH AI CLASSIFICATION
Our toolkit is able to classify generated signals using a simple machine learning algorithm into four levels. These levels indicate if a signal will most likely indicate a trend continuation (level 3/4) or a reversal/retracement (1/2).
Users are able to filter out certain signals depending on their classification, only keeping signals of interest and potential filtering out false signals.
🔶 FILTERS
In the next image below we can see after resetting the Signals & Overlays™ indicator to it's defaults, we have simply enabled the "Smart Trail Filter" from within the Presets / Filters section at the top of the settings.
By doing this, we can filter out signals that are not aligned with the Smart Trail indicator overlay, which gives direct confluence in every signal that generates on the chart.
Applying filters to signals do not necessarily make them instantly "better" than using the indicator without them. Between every technical indicator, there are trade-offs. So while we can now use Confirmation signals & retests of the Smart Trail as great optimal entry points, at times the indicator may miss signals or retests of the Smart Trail.
The same is seen below with another one of the Filters within Signals & Overlays™; Trend Strength Filter.
We can see the indicator is using the Trend Strength metric to only generate Confirmation Signals that align with a trending market which can clean up a lot of noise during retracements as well as ranging markets.
However, the trade-off present now with this filter enabled is that at times the indicator will miss trends, in which we'd still need to be aware of the price action, candle coloring, or other forms of analysis to give us indications the market may start a new trend opposed to just relying on signals directly.
🔶 CONCLUSION
We believe that success lies in the association of the user with the indicator, opposed to many traders who have the perspective that the indicator itself can make them become profitable. The reality is much more complicated than that.
The aim is to provide an indicator comprehensive, customizable, and intuitive enough that any trader can be led to understand this truth and develop an actionable perspective of technical indicators as support tools for decision making.
You can see the Author's instructions below to get instant access to this indicator & our LuxAlgo Premium indicator suite.
🔶 RISK DISCLAIMER
Trading is risky & most day traders lose money. All content, tools, scripts, articles, & education provided by LuxAlgo are purely for informational & educational purposes only. Past performance does not guarantee future results.

Reticulata Enhanced - StudyBuilding on our core script - Reticulata, the enhanced version features several requested extras to give you more flexibility with your trading style.
What is Reticulata Enhanced?
The Reticulata core leverages a blend of MA/RSI strategies mixed with the BBB optimised logic for risk management. This enhanced version takes it a step further with additional risk management features:
Trailing Stop
Fixed Stop
Fixed Stop, but move at TP
Trend confirmation
Usage
Using the indicator is as simple as:
1. Select the strategy, or combination of strategies you want to use
2. If desired, select one or more of the available trend filters
3. Adjust your stop options
4. Review backtest results
Markets
Like the core, the enhanced algo also supports a range of markets and timeframes, including the majors ( EURUSD , etc...) in Forex and a variety of Cryptocurrencies including Bitcoin (BTC/XBT etc...).
All of our scripts are designed for manual traders but are ready to use with automated trading bots.
PM us to obtain access.

[astropark] ALGO Trading V3 [alarms]Dear Followers,
today another awesome Swing and Scalping Trading Strategy indicator, runnable on a bot , which works great on many timeframes (from 1h and above is suggested), just write me in order to help you find correct settings).
It must be said that this strategy works even better on 1m Renko chart!
If you are a scalper or you are a swing trader, you will love suggested entries for fast and long-lasting profit.
Keep in mind that a proper trailing stop strategy and risk management and money management strategies are very important (DM me if you need any clarification on these points).
This is not an evolution of "ALGO Trading V1" or "ALGO Trading V2" , but a twin sister of them.
For your reference, here it is the "ALGO Trading V1" indicator
and here the "ALGO Trading V2"
This strategy has the following options:
enable/disable signals on chart
enable/disable bars and background coloring based on trend
enable/disable a "filter noise" option , which try to reduce overtrading (you can easily check it on backtesting)
enable/disable a Take Profit / Stop Loss option (you can easily check it on backtesting too)
enable/disable a secret SmartOption which may improve profit on your chart (again, check it on you chart if it helps or not)
This strategy only trigger 1 buy or 1 sell. If you enable Take Profit / Stop Loss option, consider that many TP can be triggered before trend reversal, so take partial profit on every TP an eventually buy/sell back lower/higher to maximize your profit.
This script will let you set all notifications you may need in order to be alerted on each triggered signals.
The one for backtesting purpose can be found by searching for the astropark's "ALGO Trading V3" and then choosing the indicator with "strategy" suffix in the name, or you can find here below
Strategy results are calculated on the time window from 1995 to now, so on more than 15 years, using 1000$ as initial capital and working at 1x leverage (so no leverage at all! If you like to use leverage, be sure to use a safe option, like 3x or 5x at most in order to have liquidation price very far).
This is not the "Holy Grail", so use a proper risk management strategy.
This script will let you backtest how the indicator will perform on any chart and timeframe you may like to test and/or trade. Of course results will be very different depending on the chart and timeframe you will open. I tested a lot of charts and always you can find a combination that keep this strategy in profit on swing trading style (and this means that if you can have a daily look at the chart you can always manage to maximize your profit on each trade!)
This is a premium indicator , so send me a private message in order to get access to this script.

6Hours swingalgo by BiO-618Hey, I want to share you this algo I remade for a bullish market.
*It uses about 11 indicators, 3 of them made by me to avoid BUYs on the start of a big dump.
*It was added ghost pivots for weekly and monthly values, really useful!
Let me know any suggestion, I will keep working to improve it
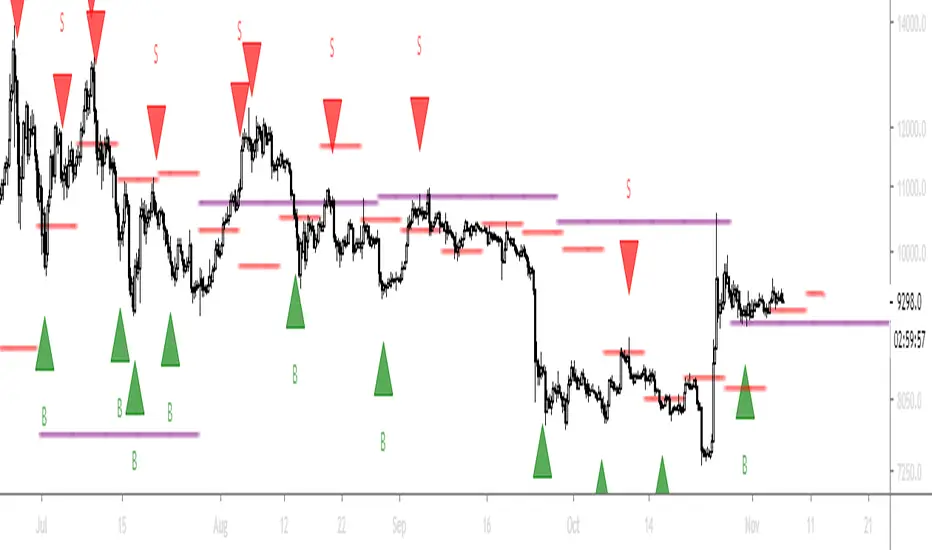
[ALL-IN-ONE] Algorithmic S/R and Pivots and Long Term LevelsHello my trading padawans.
Hope you're all having a blast
Here's the invite-only script of the week. The ALL-IN-ONE saga continues with another script.
This time, I compiled a lot of algorithmic supports and resistances (S/R) - to be used with any indicators out there.
Those S/R are universal and work with all asset classes (FOREX, CRYPTO, INDICES, STOCKS, COMMODITIES, ...)
No one can predicts which S/R will stop a move - generally - the high timeframes S/R + the SMAs with a big input value - work as strong walls often forcing the candles to retrace a bit short-term.
At Today's post (October, 25th 2019 - 12 pm UTC-4), we see how useful they were, to identify how high BTC/USD could go before retracing.
I. 💎 SCRIPTS ACCESS 💎
1.🖐️ Access can only be requested through my website.
2.🖐️ My website URL is in this script signature at the very bottom (you'll have to scroll down a bit and going past the long description) and in my profile status available here : Daveatt
3.🖐️ A tutorial article/video will be provided on those sub mentioned links + Tradingview
4.🖐️ You obviously can contact me directly for more information
II. 🔎 ALL-IN-ONE Supports and Resistances 🔎
You can display the algorithmic S/R, and/or pivots, (not finished yet) and the long terms levels.
For the 3 types of S/R, I pre-selected those that I think are the most relevant and useful for everyone. Please let me know if you'd like me to add/remove some.
All those listed by default are important and provide a MAP for a trader.
They give great take profits zones, levels where it's better to wait for a pullback before entering.
2.1 👁️🗨️ S/R mode 👁️🗨️
Each type of S/R can be displayed or not.
2.2 📱 Mobile optimized display 📱
Preview : imgur.com I posted 2 images there
The script is made using the newest version of Pinescript, and displaying small labels for every support/resistance.
✨ This will come in handy for mobile users - they'll get nice looking labels displayed at the right of their chart.
Each S/R type have its own labels and label position. The script users can activate/deactivate them at will
Let's review quickly each one.
2.3 Algorithmic SMAs
I cherish, love, sometimes despite them, but they're very relevant for all asset classes. The tool displays as many relevant algorithmic and generic SMAs that I could think of.
The indicator lists about 18 different SMAs in multiple timeframes.
2.4 Pivots
7 pivots are displayed (S1/S2/S3/P/R1/R2/R3)
You can choose one of 4 pivot point types:
- Traditional
- Woodie
- Fibonacci
- Camarilla.
The fun doesn't stop here. You can also select a timeframe between Daily/Weekly/Monthly/Yearly for those pivots.
For INDICES, for example, I use a lot the daily Traditional Pivots.
2.5 Long Terms Levels
Display by default the highest/lowest weekly/monthly/quarterly/monthly levels.
The scripts user can chose to select the previous highest/lowest also.
-------------------------------------------------------------------------------------------------------------------------------------
If you have any doubts or questions, please hit me up directly or ask in the comments section of this script.
I'll never claim I have the best trading methodology or indicators.
You only will judge and I'll appreciate all the questions and feedback you're sending my way.
They helped me a ton for developing indicators based on all the requests I received.
May the force 💪 be with you all 🥳.
Dave

Bonfire vs Algo Profile by CaptBlackBeard
Top Secret: Using reactive Bonfire math vs Volume Profile to show gaps in the Profit Algorithm guiding the price to balance the books. This is valued data

Strategy Builder Crypto V6Hello everyone
This indicator is the result of 7 years of trading (including 3 years of analyzing day and night how crypto assets behave).
I made it fully customizable but I wouldn't recommend changing the default values as they're the most optimal ones for now. Might change in the future but I'm very happy with the signals so far and I hope you'll be as well :)
Without further due, let's dig into it...
0 - Algo trading and Why
In the crypto trading, there is a lot of useless noise (we can probably thank Crypto Twitter for that :p) and a lot of useless data with the sole purpose is to lure you (who said Bitfinex Long/Short ratio or CME gaps ??)
I wanted to remove all the useless and only focus on Technical Analysis (TA) because I was deeply convinced that TA includes by design Fundamental Analysis (FA) and Pumponomics Analysis (PA) - PA being for instance when your favorite twitter guru will pump and dump on you
I heard that so many people got REKT from the previous bear market and I wanted to give back to the community - who helped me so much a few years back.
I worked hard to design the method and make it simple for the public and for FREE (so far as I want to collect feedbacks from the community and improving the indicator)
THIS IS MY GIFT TO YOU
1 - Input values
I'll explain later on through a medium article what each parameter means and how to set them up. For now, please used the optimized and recommended values already set in the indicator
2 - The method
This method works for intraday trading for timeframes between m5 and H1. Any timeframe above could work but would give signals too late - in this case, I would recommend changing the inputs with smaller values to adjust
I see a trend being composed of a main trend, and mini sub trends. In other words, for instance, a weekly bullish trend is made of smaller H4 bullish trends. Hope it makes sense so far
Let's call the weekly trend the MAIN trend and the H4 smaller trends the SECONDARY trends
That's exactly what this indicator is about
It will catch the best MAIN trend and all the SECONDARY trends in the same direction of the MAIN trend.
It's up to you if you want to take all the SECONDARY trends or only the first one in the sequence.
3 - Invalidation signal
A signal invalidation is used to make you exiting your position with a small loss before your stop loss will get hit. Very powerful way to save your capital and limit your losses.
You'll find the indicator here on tradingview for free under the name Trend signal with Alert (made by myself)
Trend signal with Alert
to invalidate entries. You'll need to request an invite
Briefly, let's assume we get a BUY signal. I would exit the position either if I'm getting a DOWN trend signal. It means, if the oblique/logarithmic trendline is broken, then it's better to exit the position and wait for the indicator to give another BUY signal later hopefully
Best case, it will limit your loss in case the asset will dump.
Worst case, this strict management strategy will make you exiting your position for no reason and you'll re-enter later (with a signal) at almost the same price or a bit higher
In the long run, this method will prevent you from having big losses
4 - Stop Loss and Take profits levels
It's really up to you. It depends of your capital and psychology
This indicator is made to give big moves but that's not 100% guaranteed. You can draw some trendlines or use moving averages in big timeframes to set your take profit and stop loss levels.
I personally use this also, along with fibonacci on the weekly/monthly timeframes for my take profit levels
As I'm a nice person, I'm linking the Fibonacci indicator that I use here
Automatic Multi-timeframes fibonacci zones
. You'll also need to request an invite for that one
4-bis - Trailing stop
Not financial advice but I use a supertrend and I have a software that will trail my stop according to that supertrend level
For LONG positions, we could set the trailing below the supertrend.
For SHORT positions, we could set the trailing above the supertrend.
You'll find the indicator here on tradingview for free under the name Supertrend V1.0 - Buy or Sell Signal
5 - Which assets
It's working with the default values on major/mid/small caps and for ALTS/BTC, ALTS/USD and ALTS/ETH pairing
YES, THIS IS MOST AWESOME THING OF THE ENTIRE UNIVERSE !!!
6 - Best setup
m15 timeframe is my preferred one for this method. Best Risk/Reward/Invalidations ratio among all other timeframes
I strongly recommend to use the Trend Signal with the input value 14 for the invalidations
If you enter on a BUY signal, and get a RED trend signal, exit immediately the position without waiting for any other confirmation/pullback or anything else
If you enter on a SELL signal, and get a BLUE trend signal, exit immediately the position without waiting for any other confirmation/pullback or anything else
For the trailing stop/Supertrend value, it depends of your capital and how big your stop loss should be. I personally use the settings in the Supertrend indicator
7 - Alerts
You can setup alerts for the primary and secondary signals in Tradingview so that you won't have to stare at the charts all day long. You mental healthy is my priority above everything else :)
8 - More to come
I personally use the alerts from this indicator coupled with a system to take the trades given by the tradingview alerts. I'll publish it later on if I feel the indicator collects enough interest from you guys

DabYourSelfDab Your Self
Trading Script -
this script is an algo for determining certain values per candle
-- request by Dab Your Self

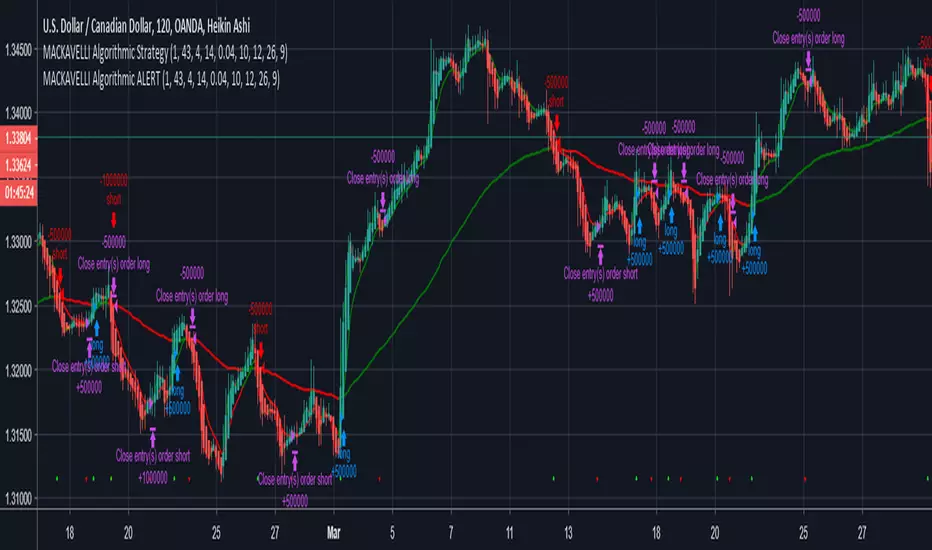
MACKAVELLI Algorithmic ALERTThis is the ALERT script to compliment the strategy script.
When you set the alerts, make sure you use "On Bar Close" as the option, otherwise you will get repeated alerts. You can use this ALERT script with Autoview for automated algorithmic trading.
I had a hard time finding a strategy that would work in different time-frames and multiple different currency pairs. This is what I ended up with after countless hours of research and testing. I designed this strategy for auto-algorithmic trading and it uses three different indicators for Long/Short positions and a 4th indicator for exiting positions.
1) A green-light indicator that tells you whether or not you can go long/short.
2) A confirmation indicator that executes the long/short positions.
3) A chop indicator that measures the distance between the two MA's. When they're too close a trade will not be executed, as this usually indicates a chop zone.
4) A third MA is used as an exit indicator.
5) Finally, a loop function is designed to prevent repeat signals. Once a signal is produced on bar close it cannot happen again until that trade is closed or a new position is opened.
Be advised, you need to adjust the settings for each currency pair and time-frame. Once you do that, back-test it and count the last 100 trades to determine accurately your wins/losses. Long entries are the top of the previous bar, shorts are the bottom of the previous bar. This is a more accurate way of counting wins/losses. Tradingview back-test's are not accurate because of where they estimate your long/short entries are, it's very misleading.
Right now I have it setup for 2hr USDCAD with a back-test of 58% win rate on the last 100 trades.
The chop indicator is set to 0.04, I suggest starting there. 0.03 is the lowest I would go. You can go all the way up to 0.1 and higher if needed. You'll start missing big trades though.
The EMA for green-light signal is set to 10, a lower number will give you more entries but less accurate results, bigger number will give less entries with more accuracy but with missed opportunities. 10 is a good starting point.
This strategy is also designed so you can use tight stop losses to prevent large losses. This is because the strategy typically catches trends on the way up/down, minimizing risk for reversal.
I use Heikin Ashi candles for a smoother chart to work with. I have not tested this strategy with normal candles.
DEMO this strategy before using it live and make sure you back-test and tune it before you start. This is written in PINE V3 SO IT WILL NOT REPAINT.
SmartWave Algorithm v2We've updated a fan favorite with some more kick ass features!
Version 2 of SmartWave Algorithm brings additional options such as :
- Take Profit - Set your profit target percent - Can be used along with AutoView alerts or any other similar bot
- Stop Loss - Set a stop loss target percent - Same as above, plays nice with AutoView
- Trend Filters - Disable Buy and/or Sells in either up trends or down trends
See the original SmartWave Algorithm here :
Want Access? Visit CryptoProTools.com For More Info
Have Questions? Message here or join our Discord via the link on our websites contact page

Omni-Divergence Pro [Hodldean]Omni-Divergence Pro
Most traders rely on a single indicator (like RSI or MACD) to make decisions. The problem? Single indicators are noisy, prone to false signals, and fail in changing market conditions.
Omni-Divergence Pro is different. It does not rely on one data point. Instead, it deploys a Consensus Engine—an underlying algorithm that aggregates 11 professional-grade market models into a single "Vote."
Only when the Price Action structurally disagrees with this Mathematical Consensus do you get a signal.
How It Works: The 3-Layer Filter
This script is designed to filter out 90% of market noise and only present high-probability setups using a proprietary 3-step validation process:
1. The Consensus Engine (11-Factor Model) Instead of just looking at momentum, we calculate a normalized score based on 11 distinct market dimensions, ranging from standard trend followers to advanced Digital Signal Processing (DSP):
Trend: Hull MA (HMA), Kaufman Adaptive MA (KAMA), Ichimoku Cloud.
Momentum: Smoothed RSI, Stochastic RSI, Donchian Channels.
Advanced DSP: Ehlers Super Smoother, Ehlers Fisher Transform, Ehlers Cyber Cycle.
Next-Gen Filters: Laguerre Filter, ALMA (Arnaud Legoux / JMA Proxy).
2. Structural Divergence (The Trigger) We do not look for simple "oversold" levels. We look for Structural Disagreement.
Bullish Signal: Price makes a Lower Low, but the Consensus of 11 indicators makes a Higher Low. The underlying data is screaming "Strength" while price is still dropping.
Bearish Signal: Price makes a Higher High, but the Consensus fails to confirm it.
3. The Volume Veto (The Confirmation) A divergence without volume is a trap. This system includes an integrated RVOL (Relative Volume) Filter.
If a signal forms on low volume (weekend/lunch hour), it is rejected.
Signals are only valid if Institutional Volume supports the move.
Features at a Glance
Clean Charts: No messy lines or oscillators. You only see "BUY" and "SELL" labels when a validated signal occurs.
Dual-Mode Detection:
Regular Divergence: For catching tops and bottoms (Reversals).
Hidden Divergence: For entering pullbacks in a strong trend (Trend Continuation).
Zero Repainting Logic: Signals are generated based on strict pivot confirmation. Once a signal is printed and the candle closes, it never disappears.
Technical Specifications
Confirmation Lag: This system prioritizes accuracy over speed. Signals appear upon the confirmation of a Pivot High/Low (default: 5 bars).
Visual Offset: Labels are plotted in the past (offset) to pinpoint exactly where the structural top/bottom occurred, providing clear context for stop-loss placement.
Best Timeframes: Optimized for 15m, 1H, 4H, and Daily charts. (For higher timeframes like 4H/Daily, consider lowering the Lookback setting to 3).
⛔ ACCESS & PRICING
This is an Invite-Only script. To protect the proprietary "Consensus Engine" logic, the source code is hidden.
Trading involves risk. This tool is designed to assist in analysis, not to guarantee profits. Past performance is not indicative of future results.