Quantitative R-Difference Trading Strategy/SystemWorks extremely well with many stocks.
This strategy was tested on all components of the Dow since 1987. It averaged 22% a year. Slippage and commission were accounted for. 70% of the trades were profitable. The average maximum drawdown was around 15%.
This strategy has also been tested against random. The results indicate that this strategy's results are not due to random chance, but rather it has an edge in the stock market.
Does not repaint, and is not a curve fitted strategy.
在腳本中搜尋"algo"

Absolute Price Oscillator (APO) Backtest 2.0 The Absolute Price Oscillator displays the difference between two exponential
moving averages of a security's price and is expressed as an absolute value.
How this indicator works
APO crossing above zero is considered bullish, while crossing below zero is bearish.
A positive indicator value indicates an upward movement, while negative readings
signal a downward trend.
Divergences form when a new high or low in price is not confirmed by the Absolute Price
Oscillator (APO). A bullish divergence forms when price make a lower low, but the APO
forms a higher low. This indicates less downward momentum that could foreshadow a bullish
reversal. A bearish divergence forms when price makes a higher high, but the APO forms a
lower high. This shows less upward momentum that could foreshadow a bearish reversal.
You can change long to short in the Input Settings
WARNING:
- For purpose educate only
- This script to change bars colors.

Market Facilitation Index (MFI) Backtest The Market Facilitation Index is an indicator that relates price range to
volume and measures the efficency of price movement. Use the indicator to
determine if the market is trending. If the Market Facilitation Index increased,
then the market is facilitating trade and is more efficient, implying that the
market is trending. If the Market Facilitation Index decreased, then the market
is becoming less efficient, which may indicate a trading range is developing that
may be a trend reversal.
You can change long to short in the Input Settings
WARNING:
- For purpose educate only
- This script to change bars colors.

Keltner Channel Backtest The Keltner Channel, a classic indicator
of technical analysis developed by Chester Keltner in 1960.
The indicator is a bit like Bollinger Bands and Envelopes.
You can change long to short in the Input Settings
WARNING:
- For purpose educate only
- This script to change bars colors.

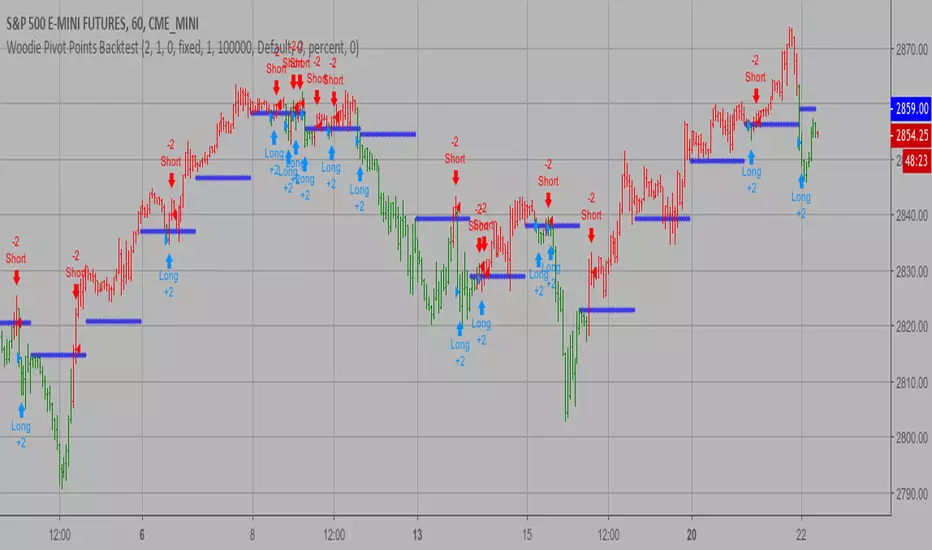
Woodie Pivot Points Backtest Simply input the vales of the high, low and closing price of the previous
period to calculate the Woodie pivot point and the associated resistance
and support levels for the present period.
You can change long to short in the Input Settings
WARNING:
- For purpose educate only
- This script to change bars colors.
Volatility Backtest The Volatility function measures the market volatility by plotting a
smoothed average of the True Range. It returns an average of the TrueRange
over a specific number of bars, giving higher weight to the TrueRange of
the most recent bar.
You can change long to short in the Input Settings
WARNING:
- For purpose educate only
- This script to change bars colors.

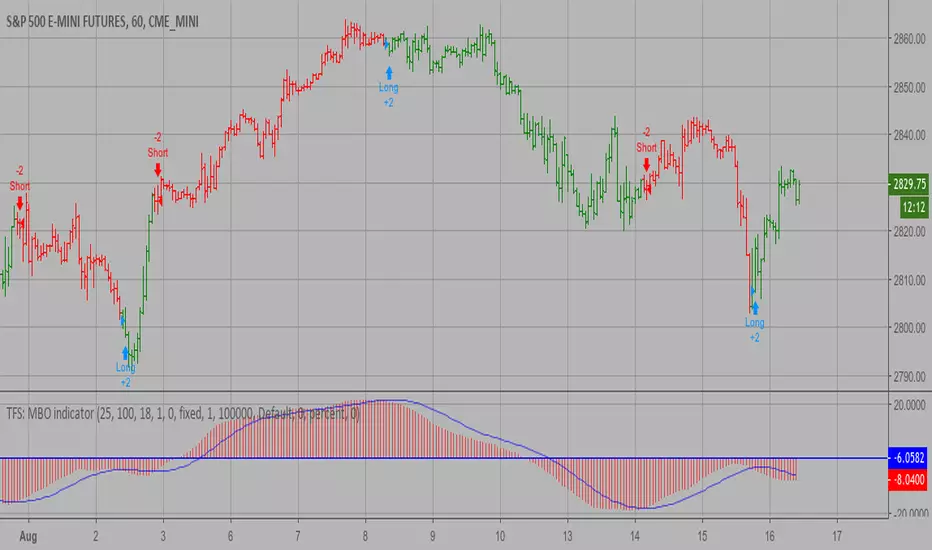
TFS: MBO Backtest MBO indicator is the third component of TFS trading system. This indicator
was developed by Bryan Strain and Mark Whitley.
The idea of MBO is similar to moving average convergence/divergence (MACD)
indicator. It is calculated by subtracting the 200-day moving average from
the 25-day moving average.
You can change long to short in the Input Settings
WARNING:
- For purpose educate only
- This script to change bars colors.
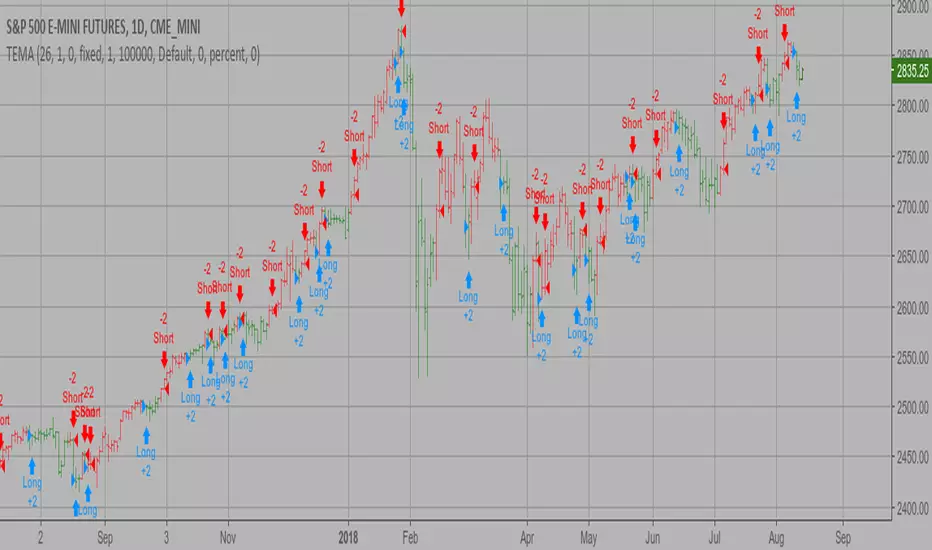
TEMA1 Backtest This study plots the TEMA1 indicator. TEMA1 ia s triple MA (Moving Average),
and is calculated as 3*MA - (3*MA(MA)) + (MA(MA(MA)))
You can change long to short in the Input Settings
WARNING:
- For purpose educate only
- This script to change bars colors.
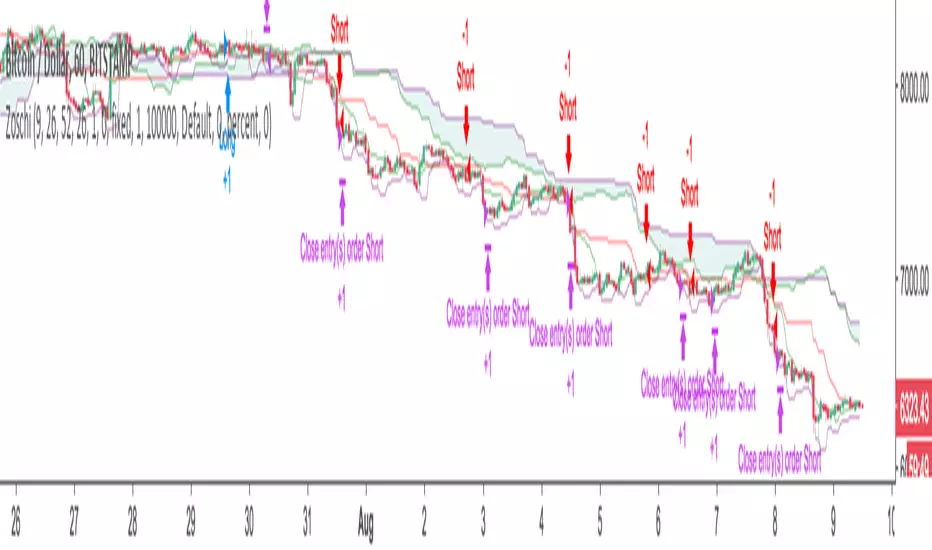
Zos Ichimoku Trading SystemFully automated Ichimoku Cloud based trading system. Automated entry and exits.
Message me on Telegram for access. @zacharyo
(c) Bronte Capital
Smart Money Index (SMI) Backtest Attention:
If you would to use this indicator on the ES, you should have intraday data 60min in your account.
Smart money index (SMI) or smart money flow index is a technical analysis indicator demonstrating investors sentiment.
The index was invented and popularized by money manager Don Hays. The indicator is based on intra-day price patterns.
The main idea is that the majority of traders (emotional, news-driven) overreact at the beginning of the trading day
because of the overnight news and economic data. There is also a lot of buying on market orders and short covering at the opening.
Smart, experienced investors start trading closer to the end of the day having the opportunity to evaluate market performance.
Therefore, the basic strategy is to bet against the morning price trend and bet with the evening price trend. The SMI may be calculated
for many markets and market indices (S&P 500, DJIA, etc.)
The SMI sends no clear signal whether the market is bullish or bearish. There are also no fixed absolute or relative readings signaling
about the trend. Traders need to look at the SMI dynamics relative to that of the market. If, for example, SMI rises sharply when the
market falls, this fact would mean that smart money is buying, and the market is to revert to an uptrend soon. The opposite situation
is also true. A rapidly falling SMI during a bullish market means that smart money is selling and that market is to revert to a downtrend
soon. The SMI is, therefore, a trend-based indicator.
Some analysts use the smart money index to claim that precious metals such as gold will continually maintain value in the future.
You can change long to short in the Input Settings
WARNING:
- For purpose educate only
- This script to change bars colors.

Percent difference between price and MA Backtest Percent difference between price and MA
You can change long to short in the Input Settings
WARNING:
- For purpose educate only
- This script to change bars colors.

Modified Price-Volume Trend Backtest The related article is copyrighted material from
Stocks & Commodities.
Strategy by HPotter.
You can change long to short in the Input Settings
WARNING:
- For purpose educate only
- This script to change bars colors.
NGRN MACD-X & RSI v4 STRATEGYMACD-X, RSI & Volume Indicator Strategy - Version 4
Overview
This strategy and it's associated study were modeled after the famous Philakone described algorithms on his now defunct instructional video series.
This indicator allows for full customisation of parameters and interaction between three indicators that allow users to shape their trading methods to their desired goals. This associated strategy also allows users to backtest the study alerts script and find the best settings towards that end.
MACD + RSI + VOLUME - are of the most powerful and widely usded indicators, MACD/Histogram crosses, coupled with RSI & Volume increases/decreases will detects areas of deeply oversold / overbought and buys/sells on the reversal
Features
Full customisation - All parameters are open for customising to allow the trader to build their own strategy and adapt from market to market.
Clean/Simple UI - Facilitating ease of use.
Enable Buying OR Selling, - or have them both active at the same time.
Toggle off and on ALTERNATING Buy and Sell feature (pyramiding) - to allow for consecutive DCA style buys or SCALING out of an entry (partial sell).
Customizable Stop-Loss plot - to enable users to create a STOP-LOSS alert option or other alert(s) based on the plot location.
Toggle Auto Stop-Loss sell option - to enable users choose whether or not to automatically issue a sell signal when close crosses stop loss plot, or choose to toggle off if not profitable.
Customizable Take-Profit plot - to enable users to create a TAKE-PROFIT alert option or other alert(s) based on the plot location.
Study and associated Strategy - to use the TradingView ‘Strategy Tester’ back-testing features to find the best alert settings for specific coins in bear, bull and sideways markets.
Changes Version 4
Improved STOP-LOSS plot draw.
Added the option to automatically sell when stop-loss cross triggered or have the option disabled, in the event a better profit can be achieved.
Added new TAKE-PROFIT plot (aqua line) to visually guide users where to place the TAKE-PROFIT parameter as well as give users options to create alerts based on the TAKE-PROFIT plot.
Access
Full Access is 0.1 ETH , one time fee for LIFETIME access to the STUDY indicator, STRATEGY and future updates as well as support and SETTINGS for various markets on the Binance Exchange.
Settings
SCREENSHOT LINKS:
BUY SETTINGS: prntscr.com
SELL SETTINGS: prntscr.com

Last High and Low Level Backtest This script shows a high and low period value.
SelectPeriod - Day or Week or Month and etc.
LookBackPeriods - Shift levels 0 - current period, 1 - previous and etc.
You can change long to short in the Input Settings
WARNING:
- For purpose educate only
- This script to change bars colors.
High and Low Levels Backtest This script shows a high and low period value.
Width - width of lines
SelectPeriod - Day or Week or Month and etc.
LookBack - Shift levels 0 - current period, 1 - previous and etc.
You can change long to short in the Input Settings
WARNING:
- For purpose educate only
- This script to change bars colors.

Nick's Momentum Trading Strategy - Beats Buy and Hold manifolds!This script works on the principle of short-term mean reversion and long term trend following, and uses minimal parameters to ensure no overfitting.
The scripts beats buy and hold for almost all major pairs that satisfy the following conditions:
- are trading on multiple exchanges as either ALTBTC or ALTUSD pairs
- have good volume available with them
- have an established history - (try not to use this script with really new pairs)
To run the script, follow these rules:
- script should be run on ALTBTC pair
- set first parameter such that when multiplied with resolution of chart, we get a whole day/week/month, etc. e.g. for a '4H' chart, set this to multiples of 6. The reason being that most algorithmic rebalancing in cryptosphere happens at these times, and we want to make effective use of this.
- set second parameter in the range of 1-6 - this is the smoothing factor (ema) we want to apply to our indicator (governed by our first parameter) - more smoothing = lesser trades. See what works for you.
- Last parameter is a filter condition. Just check/uncheck it once to see if market works better with this on or off.
- If script does not beat buy and hold on this pair (rarely), don't use script on this pair at all.
Access available only to friends. I do code trading strategies on request - so, let me know if you have a good set of rules to create a strategy.
Floor Pivot Points Backtest The name ‘Floor-Trader Pivot,’ came from the fact that Pivot points can
be calculated quickly, on the fly using price data from the previous day
as an input. Although time-frames of less than a day can be used, Pivots are
commonly plotted on the Daily Chart; using price data from the previous day’s
trading activity.
You can change long to short in the Input Settings
WARNING:
- For purpose educate only
- This script to change bars colors.
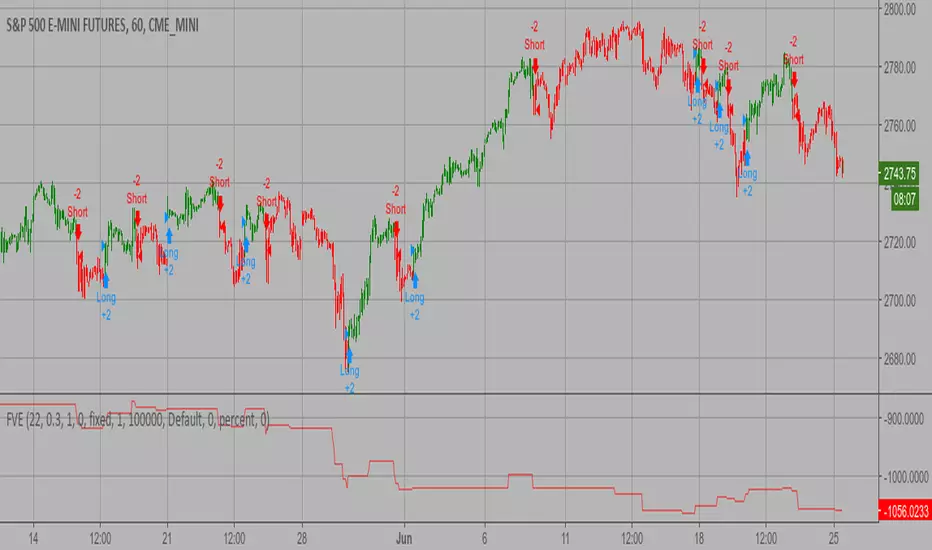
Finite Volume Elements (FVE) Backtest The FVE is a pure volume indicator. Unlike most of the other indicators
(except OBV), price change doesn?t come into the equation for the FVE (price
is not multiplied by volume), but is only used to determine whether money is
flowing in or out of the stock. This is contrary to the current trend in the
design of modern money flow indicators. The author decided against a price-volume
indicator for the following reasons:
- A pure volume indicator has more power to contradict.
- The number of buyers or sellers (which is assessed by volume) will be the same,
regardless of the price fluctuation.
- Price-volume indicators tend to spike excessively at breakouts or breakdowns.
You can change long to short in the Input Settings
WARNING:
- For purpose educate only
- This script to change bars colors.
Ergodic CSI Backtest This is one of the techniques described by William Blau in his book
"Momentum, Direction and Divergence" (1995). If you like to learn more,
we advise you to read this book. His book focuses on three key aspects
of trading: momentum, direction and divergence. Blau, who was an electrical
engineer before becoming a trader, thoroughly examines the relationship between
price and momentum in step-by-step examples. From this grounding, he then looks
at the deficiencies in other oscillators and introduces some innovative techniques,
including a fresh twist on Stochastics. On directional issues, he analyzes the
intricacies of ADX and offers a unique approach to help define trending and
non-trending periods.
This indicator plots Ergotic CSI and smoothed Ergotic CSI to filter out noise.
You can change long to short in the Input Settings
WARNING:
- For purpose educate only
- This script to change bars colors.

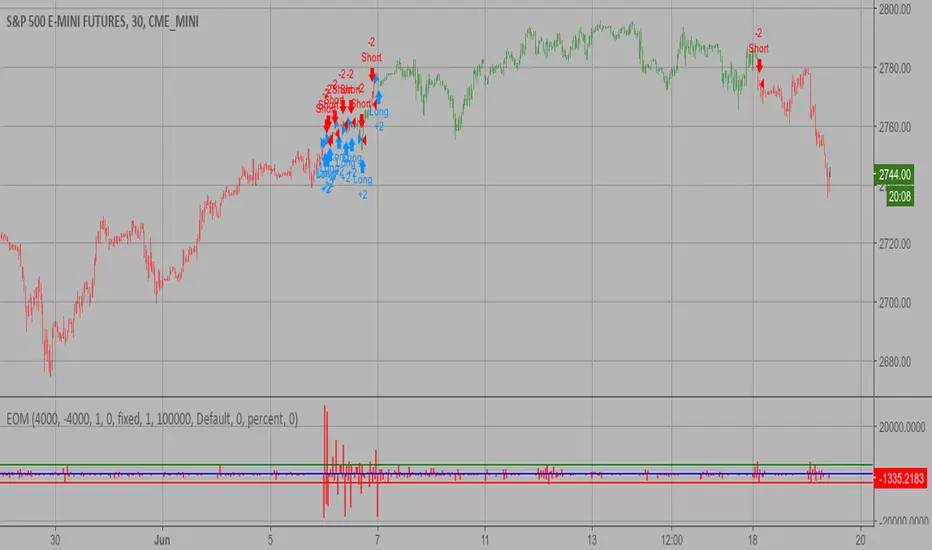
Ease of Movement (EOM) Backtest This indicator gauges the magnitude of price and volume movement.
The indicator returns both positive and negative values where a
positive value means the market has moved up from yesterday's value
and a negative value means the market has moved down. A large positive
or large negative value indicates a large move in price and/or lighter
volume. A small positive or small negative value indicates a small move
in price and/or heavier volume.
A positive or negative numeric value. A positive value means the market
has moved up from yesterday's value, whereas, a negative value means the
market has moved down.
You can change long to short in the Input Settings
WARNING:
- For purpose educate only
- This script to change bars colors.
Dynamic Pivot Point Backtest This Pivot points is calculated on the current day.
Pivot points simply took the high, low, and closing price from the previous period and
divided by 3 to find the pivot. From this pivot, traders would then base their
calculations for three support, and three resistance levels. The calculation for the most
basic flavor of pivot points, known as ‘floor-trader pivots’, along with their support and
resistance levels.
You can change long to short in the Input Settings
WARNING:
- For purpose educate only
- This script to change bars colors.

Wave & Trend Accompanying Backtesting StrategyVersion 1.0
Purpose
This backtesting strategy indicator is a accompanying tool for use with my popular trading and alert indicator: Wave & Trend Autoview Advanced Indicator & Alerts
Reference Indicator Link:
Features
This strategy has been programmed to act exactly how the accompanying indicator would be used with an automated strategy such as Autoview or through manual trading
Has identical coloured signals with correct icons for reference with the indicators standard alert conditions (BUY/SELL)
The ability to toggle on or off all the logic and UI presets you could previously use to enhance the standard indicator
No short / longs for the most accurate representation of buys and sells, The strategy will keep buying on every optimal signal (+1 order quantity each time) and then sell all assets on a met sell condition (-all quantity), matching exactly how the reference indicator is used to buy/sell on eg. Binance and also give the most accurate statistics.
Fully customisable in the settings regarding trading strategy to match exactly how you have the reference indicator set up with alerts or how you are trading manually with it.
Ability to choose a timeframe, want to ignore the crypto boom at the latter stages of 2017? Sure you can, change the time frames in the settings to see a more recent representation of your trades.
Access
This indicator is free for existing owners of my Wave & Trend Indicator linked above as an accompanying tool to improve their strategy and net more profit. If you would like access to any of my indicators or would like to know more please find me on my community discord channel where you can find indicator details/documentation and general help:
Discord Link: discord.gg
Thank you for the immense support everyone, happy trading!
- Falco

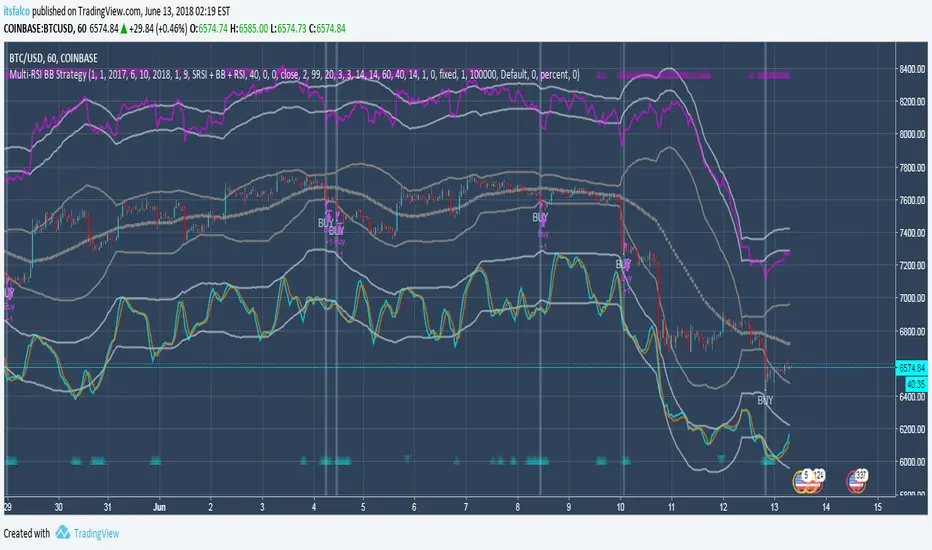
Multi-RSI BB Accompanying Backtesting StrategyVersion 1.0
Purpose
This backtesting strategy indicator is a accompanying tool for use with my popular trading and alert indicator: Multi RSI BB Fast Trader Autoview Alerts Indicator
Reference Indicator Link:
Features
This strategy has been programmed to act exactly how the accompanying indicator would be used with an automated strategy such as Autoview or through manual trading
Has identical coloured signals with correct icons for reference with the indicators standard alert conditions (BUY/SELL)
The ability to toggle on or off all the logic and UI presets you could previously use to enhance the standard indicator
No short / longs for the most accurate representation of buys and sells, The strategy will keep buying on every optimal signal (+1 order quantity each time) and then sell all assets on a met sell condition (-all quantity), matching exactly how the reference indicator is used to buy/sell on eg. Binance and also give the most accurate statistics.
Fully customisable in the settings regarding trading strategy to match exactly how you have the reference indicator set up with alerts or how you are trading manually with it.
Ability to choose a timeframe, want to ignore the crypto boom at the latter stages of 2017? Sure you can, change the time frames in the settings to see a more recent representation of your trades.
Access
This indicator is free for existing owners of my Multi RSI BB Indicator linked above as an accompanying tool to improve their strategy and net more profit. If you would like access to any of my indicators or would like to know more please find me on my community discord channel where you can find indicator details/documentation and general help:
Discord Link: discord.gg
Thank you for the immense support everyone, happy trading!
- Falco