IBD Style Candles [tradeviZion]IBD Style Candles - Visualize Price Bars Like the Pros
Transform your chart with institutional-grade IBD-style bars and customizable moving averages for both daily and weekly timeframes. This indicator helps you visualize price action the way professionals at Investors Business Daily do.
What This Indicator Offers:
IBD-style bar visualization (clean, professional appearance)
Customizable coloring based on price movement or previous close
Automatic timeframe detection for appropriate moving averages
Four customizable moving averages for daily timeframes (10, 21, 50, 200)
Four customizable moving averages for weekly timeframes (10, 20, 30, 40)
Options to use SMAs or EMAs with adjustable colors and line widths
"The IBD-style bars provide a cleaner view of price action, allowing you to focus on market structure without the visual noise of traditional candles."
How to Apply the IBD-Style Bars:
On your TradingView chart, select "Bars" as the chart type from the main chart type selection menu (next to the time interval options).
Right-click on the chart and select "Settings".
Go to the "Symbol" tab.
Uncheck the "Thin Bars" option to display thicker bars.
Set the "Up Color" and "Down Color" opacity to 0 for a clean IBD-style appearance.
Enable "IBD-style Candles" from the script's settings.
To revert to the original chart style, repeat the above steps and restore the default settings.
Moving Average Configuration:
The indicator automatically detects your timeframe and displays the appropriate moving averages:
Daily Timeframe Moving Averages:
10-day moving average (SMA/EMA)
21-day moving average (SMA/EMA)
50-day moving average (SMA/EMA)
200-day moving average (SMA/EMA)
Weekly Timeframe Moving Averages:
10-week moving average (SMA/EMA)
20-week moving average (SMA/EMA)
30-week moving average (SMA/EMA)
40-week moving average (SMA/EMA)
Usage Tips:
Enable "Color bars based on previous close" to identify momentum shifts based on prior candle closes
Customize colors to match your chart theme or preference
Enable only the moving averages relevant to your trading strategy
For cleaner charts, reduce the number of visible moving averages
For stock trading, the 10/21/50/200 daily and 10/40 weekly MAs are most commonly used by institutions
// Example configuration for different timeframes
if timeframe.isweekly
// Weekly configuration
showSMA1_Weekly = true // 10-week MA
showSMA4_Weekly = true // 40-week MA
else
// Daily configuration
showMA2_Daily = true // 21-day MA
showMA3_Daily = true // 50-day MA
showMA4_Daily = true // 200-day MA
While the IBD style provides clarity, remember that no visualization method guarantees trading success. Always combine with proper analysis and risk management.
If you found this indicator helpful, please consider leaving a comment or suggestion for future improvements. Happy trading!
在腳本中搜尋"a股板块+沪深两市+股价不超过10元的股票+技术形态好"

EXODUS EXODUS by (DAFE) Trading Systems
EXODUS is a sophisticated trading algorithm built by Dskyz (DAFE) Trading Systems for competitive and competition purposes, designed to identify high-probability trades with robust risk management. this strategy leverages a multi-signal voting system, combining three core components—SPR, VWMO, and VEI—alongside ADX, choppiness filters, and ATR-based volatility gates to ensure trades are taken only in favorable market conditions. the algo uses a take-profit to stop-loss ratio, dynamic position sizing, and a strict voting mechanism requiring all signals to align before entering a trade.
EXODUS was not overfitted for any specific symbol. instead, it uses a generic tuned setting, making it versatile across various markets. while it can trade futures, it’s not currently set up for it but has the potential to do more with further development. visuals are intentionally minimal due to its competition focus, prioritizing performance over aesthetics. a more visually stunning version may be released in the future with enhanced graphics.
The Unique Core Components Developed for EXODUS
SPR (Session Price Recalibration)
SPR measures momentum during regular trading hours (RTH, 0930-1600, America/New_York) to catch session-specific trends.
spr_lookback = input.int(15, "SPR Lookback") this sets how many bars back SPR looks to calculate momentum (default 15 bars). it compares the current session’s price-volume score to the score 15 bars ago to gauge momentum strength.
how it works: a longer lookback smooths out the signal, focusing on bigger trends. a shorter one makes SPR more sensitive to recent moves.
how to adjust: on a 1-hour chart, 15 bars is 15 hours (about 2 trading days). if you’re on a shorter timeframe like 5 minutes, 15 bars is just 75 minutes, so you might want to increase it to 50 or 100 to capture more meaningful trends. if you’re trading a choppy stock, a shorter lookback (like 5) can help catch quick moves, but it might give more false signals.
spr_threshold = input.float (0.7, "SPR Threshold")
this is the cutoff for SPR to vote for a trade (default 0.7). if SPR’s normalized value is above 0.7, it votes for a long; below -0.7, it votes for a short.
how it works: SPR normalizes its momentum score by ATR, so this threshold ensures only strong moves count. a higher threshold means fewer trades but higher conviction.
how to adjust: if you’re getting too few trades, lower it to 0.5 to let more signals through. if you’re seeing too many false entries, raise it to 1.0 for stricter filtering. test on your chart to find a balance.
spr_atr_length = input.int(21, "SPR ATR Length") this sets the ATR period (default 21 bars) used to normalize SPR’s momentum score. ATR measures volatility, so this makes SPR’s signal relative to market conditions.
how it works: a longer ATR period (like 21) smooths out volatility, making SPR less jumpy. a shorter one makes it more reactive.
how to adjust: if you’re trading a volatile stock like TSLA, a longer period (30 or 50) can help avoid noise. for a calmer stock, try 10 to make SPR more responsive. match this to your timeframe—shorter timeframes might need a shorter ATR.
rth_session = input.session("0930-1600","SPR: RTH Sess.") rth_timezone = "America/New_York" this defines the session SPR uses (0930-1600, New York time). SPR only calculates momentum during these hours to focus on RTH activity.
how it works: it ignores pre-market or after-hours noise, ensuring SPR captures the main market action.
how to adjust: if you trade a different session (like London hours, 0300-1200 EST), change the session to match. you can also adjust the timezone if you’re in a different region, like "Europe/London". just make sure your chart’s timezone aligns with this setting.
VWMO (Volume-Weighted Momentum Oscillator)
VWMO measures momentum weighted by volume to spot sustained, high-conviction moves.
vwmo_momlen = input.int(21, "VWMO Momentum Length") this sets how many bars back VWMO looks to calculate price momentum (default 21 bars). it takes the price change (close minus close 21 bars ago).
how it works: a longer period captures bigger trends, while a shorter one reacts to recent swings.
how to adjust: on a daily chart, 21 bars is about a month—good for trend trading. on a 5-minute chart, it’s just 105 minutes, so you might bump it to 50 or 100 for more meaningful moves. if you want faster signals, drop it to 10, but expect more noise.
vwmo_volback = input.int(30, "VWMO Volume Lookback") this sets the period for calculating average volume (default 30 bars). VWMO weights momentum by volume divided by this average.
how it works: it compares current volume to the average to see if a move has strong participation. a longer lookback smooths the average, while a shorter one makes it more sensitive.
how to adjust: for stocks with spiky volume (like NVDA on earnings), a longer lookback (50 or 100) avoids overreacting to one-off spikes. for steady volume stocks, try 20. match this to your timeframe—shorter timeframes might need a shorter lookback.
vwmo_smooth = input.int(9, "VWMO Smoothing")
this sets the SMA period to smooth VWMO’s raw momentum (default 9 bars).
how it works: smoothing reduces noise in the signal, making VWMO more reliable for voting. a longer smoothing period cuts more noise but adds lag.
how to adjust: if VWMO is too jumpy (lots of false votes), increase to 15. if it’s too slow and missing trades, drop to 5. test on your chart to see what keeps the signal clean but responsive.
vwmo_threshold = input.float(10, "VWMO Threshold") this is the cutoff for VWMO to vote for a trade (default 10). above 10, it votes for a long; below -10, a short.
how it works: it ensures only strong momentum signals count. a higher threshold means fewer but stronger trades.
how to adjust: if you want more trades, lower it to 5. if you’re getting too many weak signals, raise it to 15. this depends on your market—volatile stocks might need a higher threshold to filter noise.
VEI (Velocity Efficiency Index)
VEI measures market efficiency and velocity to filter out choppy moves and focus on strong trends.
vei_eflen = input.int(14, "VEI Efficiency Smoothing") this sets the EMA period for smoothing VEI’s efficiency calc (bar range / volume, default 14 bars).
how it works: efficiency is how much price moves per unit of volume. smoothing it with an EMA reduces noise, focusing on consistent efficiency. a longer period smooths more but adds lag.
how to adjust: for choppy markets, increase to 20 to filter out noise. for faster markets, drop to 10 for quicker signals. this should match your timeframe—shorter timeframes might need a shorter period.
vei_momlen = input.int(8, "VEI Momentum Length") this sets how many bars back VEI looks to calculate momentum in efficiency (default 8 bars).
how it works: it measures the change in smoothed efficiency over 8 bars, then adjusts for inertia (volume-to-range). a longer period captures bigger shifts, while a shorter one reacts faster.
how to adjust: if VEI is missing quick reversals, drop to 5. if it’s too noisy, raise to 12. test on your chart to see what catches the right moves without too many false signals.
vei_threshold = input.float(4.5, "VEI Threshold") this is the cutoff for VEI to vote for a trade (default 4.5). above 4.5, it votes for a long; below -4.5, a short.
how it works: it ensures only strong, efficient moves count. a higher threshold means fewer trades but higher quality.
how to adjust: if you’re not getting enough trades, lower to 3. if you’re seeing too many false entries, raise to 6. this depends on your market—fast stocks like NQ1 might need a lower threshold.
Features
Multi-Signal Voting: requires all three signals (SPR, VWMO, VEI) to align for a trade, ensuring high-probability setups.
Risk Management: uses ATR-based stops (2.1x) and take-profits (4.1x), with dynamic position sizing based on a risk percentage (default 0.4%).
Market Filters: ADX (default 27) ensures trending conditions, choppiness index (default 54.5) avoids sideways markets, and ATR expansion (default 1.12) confirms volatility.
Dashboard: provides real-time stats like SPR, VWMO, VEI values, net P/L, win rate, and streak, with a clean, functional design.
Visuals
EXODUS prioritizes performance over visuals, as it was built for competitive and competition purposes. entry/exit signals are marked with simple labels and shapes, and a basic heatmap highlights market regimes. a more visually stunning update may be released later, with enhanced graphics and overlays.
Usage
EXODUS is designed for stocks and ETFs but can be adapted for futures with adjustments. it performs best in trending markets with sufficient volatility, as confirmed by its generic tuning across symbols like TSLA, AMD, NVDA, and NQ1. adjust inputs like SPR threshold, VWMO smoothing, or VEI momentum length to suit specific assets or timeframes.
Setting I used: (Again, these are a generic setting, each security needs to be fine tuned)
SPR LB = 19 SPR TH = 0.5 SPR ATR L= 21 SPR RTH Sess: 9:30 – 16:00
VWMO L = 21 VWMO LB = 18 VWMO S = 6 VWMO T = 8
VEI ES = 14 VEI ML = 21 VEI T = 4
R % = 0.4
ATR L = 21 ATR M (S) =1.1 TP Multi = 2.1 ATR min mult = 0.8 ATR Expansion = 1.02
ADX L = 21 Min ADX = 25
Choppiness Index = 14 Chop. Max T = 55.5
Backtesting: TSLA
Frame: Jan 02, 2018, 08:00 — May 01, 2025, 09:00
Slippage: 3
Commission .01
Disclaimer
this strategy is for educational purposes. past performance is not indicative of future results. trading involves significant risk, and you should only trade with capital you can afford to lose. always backtest and validate any strategy before using it in live markets.
(This publishing will most likely be taken down do to some miscellaneous rule about properly displaying charting symbols, or whatever. Once I've identified what part of the publishing they want to pick on, I'll adjust and repost.)
About the Author
Dskyz (DAFE) Trading Systems is dedicated to building high-performance trading algorithms. EXODUS is a product of rigorous research and development, aimed at delivering consistent, and data-driven trading solutions.
Use it with discipline. Use it with clarity. Trade smarter.
**I will continue to release incredible strategies and indicators until I turn this into a brand or until someone offers me a contract.
2025 Created by Dskyz, powered by DAFE Trading Systems. Trade smart, trade bold.

Dskyz (DAFE) Quantum Sentiment Flux - Beginners Dskyz (DAFE) Quantum Sentiment Flux - Beginners:
Welcome to the Dskyz (DAFE) Quantum Sentiment Flux - Beginners , a strategy and concept that’s your ultimate wingman for trading futures like MNQ, NQ, MES, and ES. This gem combines lightning-fast momentum signals, market sentiment smarts, and bulletproof risk management into a system so intuitive, even newbies can trade like pros. With clean DAFE visuals, preset modes for every vibe, and a revamped dashboard that’s basically a market GPS, this strategy makes futures trading feel like a high-octane sci-fi mission.
Built on the Dskyz (DAFE) legacy of Aurora Divergence, the Quantum Sentiment Flux is designed to empower beginners while giving seasoned traders a lean, sentiment-driven edge. It uses fast/slow EMA crossovers for entries, filters trades with VIX, SPX trends, and sector breadth, and keeps your account safe with adaptive stops and cooldowns. Tuned for more action with faster signals and a slick bottom-left dashboard, this updated version is ready to light up your charts and outsmart institutional traps. Let’s dive into why this strat’s a must-have and break down its brilliance.
Why Traders Need This Strategy
Futures markets are a wild ride—fast moves, volatility spikes (like the April 28, 2025 NQ 1k-point drop), and institutional games that can wreck unprepared traders. Beginners often get lost in complex systems or burned by impulsive trades. The Quantum Sentiment Flux is the antidote, offering:
Dead-Simple Setup: Preset modes (Aggressive, Balanced, Conservative) auto-tune signals, risk, and sizing, so you can trade without a quant degree.
Sentiment Superpower: VIX filter, SPX trend, and sector breadth visuals keep you aligned with market health, dodging chop and riding trends.
Ironclad Safety: Tighter ATR-based stops, 2:1 take-profits, and preset cooldowns protect your capital, even in chaotic sessions.
Next-Level Visuals: Green/red entry triangles, vibrant EMAs, a sector breadth background, and a beefed-up dashboard make signals and context pop.
DAFE Swagger: The clean aesthetics, sleek dashboard—ties it to Dskyz’s elite brand, making your charts a work of art.
Traders need this because it’s a plug-and-play system that blends beginner-friendly simplicity with pro-level market awareness. Whether you’re just starting or scalping 5min MNQ, this strat’s your key to trading with confidence and style.
Strategy Components
1. Core Signal Logic (High-Speed Momentum)
The strategy’s engine is a momentum-based system using fast and slow Exponential Moving Averages (EMAs), now tuned for faster, more frequent trades.
How It Works:
Fast/Slow EMAs: Fast EMA (Aggressive: 5, Balanced: 7, Conservative: 9 bars) and slow EMA (12/14/18 bars) track short-term vs. longer-term momentum.
Crossover Signals:
Buy: Fast EMA crosses above slow EMA, and trend_dir = 1 (fast EMA > slow EMA + ATR * strength threshold).
Sell: Fast EMA crosses below slow EMA, and trend_dir = -1 (fast EMA < slow EMA - ATR * strength threshold).
Strength Filter: ma_strength = fast EMA - slow EMA must exceed an ATR-scaled threshold (Aggressive: 0.15, Balanced: 0.18, Conservative: 0.25) for robust signals.
Trend Direction: trend_dir confirms momentum, filtering out weak crossovers in choppy markets.
Evolution:
Faster EMAs (down from 7–10/21–50) catch short-term trends, perfect for active futures markets.
Lower strength thresholds (0.15–0.25 vs. 0.3–0.5) make signals more sensitive, boosting trade frequency without sacrificing quality.
Preset tuning ensures beginners get optimized settings, while pros can tweak via mode selection.
2. Market Sentiment Filters
The strategy leans hard into market sentiment with a VIX filter, SPX trend analysis, and sector breadth visuals, keeping trades aligned with the big picture.
VIX Filter:
Logic: Blocks long entries if VIX > threshold (default: 20, can_long = vix_close < vix_limit). Shorts are always allowed (can_short = true).
Impact: Prevents longs during high-fear markets (e.g., VIX spikes in crashes), while allowing shorts to capitalize on downturns.
SPX Trend Filter:
Logic: Compares S&P 500 (SPX) close to its SMA (Aggressive: 5, Balanced: 8, Conservative: 12 bars). spx_trend = 1 (UP) if close > SMA, -1 (DOWN) if < SMA, 0 (FLAT) if neutral.
Impact: Provides dashboard context, encouraging trades that align with market direction (e.g., longs in UP trend).
Sector Breadth (Visual):
Logic: Tracks 10 sector ETFs (XLK, XLF, XLE, etc.) vs. their SMAs (same lengths as SPX). Each sector scores +1 (bullish), -1 (bearish), or 0 (neutral), summed as breadth (-10 to +10).
Display: Green background if breadth > 4, red if breadth < -4, else neutral. Dashboard shows sector trends (↑/↓/-).
Impact: Faster SMA lengths make breadth more responsive, reflecting sector rotations (e.g., tech surging, energy lagging).
Why It’s Brilliant:
- VIX filter adds pro-level volatility awareness, saving beginners from panic-driven losses.
- SPX and sector breadth give a 360° view of market health, boosting signal confidence (e.g., green BG + buy signal = high-probability trade).
- Shorter SMAs make sentiment visuals react faster, perfect for 5min charts.
3. Risk Management
The risk controls are a fortress, now tighter and more dynamic to support frequent trading while keeping accounts safe.
Preset-Based Risk:
Aggressive: Fast EMAs (5/12), tight stops (1.1x ATR), 1-bar cooldown. High trade frequency, higher risk.
Balanced: EMAs (7/14), 1.2x ATR stops, 1-bar cooldown. Versatile for most traders.
Conservative: EMAs (9/18), 1.3x ATR stops, 2-bar cooldown. Safer, fewer trades.
Impact: Auto-scales risk to match style, making it foolproof for beginners.
Adaptive Stops and Take-Profits:
Logic: Stops = entry ± ATR * atr_mult (1.1–1.3x, down from 1.2–2.0x). Take-profits = entry ± ATR * take_mult (2x stop distance, 2:1 reward/risk). Longs: stop below entry, TP above; shorts: vice versa.
Impact: Tighter stops increase trade turnover while maintaining solid risk/reward, adapting to volatility.
Trade Cooldown:
Logic: Preset-driven (Aggressive/Balanced: 1 bar, Conservative: 2 bars vs. old user-input 2). Ensures bar_index - last_trade_bar >= cooldown.
Impact: Faster cooldowns (especially Aggressive/Balanced) allow more trades, balanced by VIX and strength filters.
Contract Sizing:
Logic: User sets contracts (default: 1, max: 10), no preset cap (unlike old 7/5/3 suggestion).
Impact: Flexible but risks over-leverage; beginners should stick to low contracts.
Built To Be Reliable and Consistent:
- Tighter stops and faster cooldowns make it a high-octane system without blowing up accounts.
- Preset-driven risk removes guesswork, letting newbies trade confidently.
- 2:1 TPs ensure profitable trades outweigh losses, even in volatile sessions like April 27, 2025 ES slippage.
4. Trade Entry and Exit Logic
The entry/exit rules are simple yet razor-sharp, now with VIX filtering and faster signals:
Entry Conditions:
Long Entry: buy_signal (fast EMA crosses above slow EMA, trend_dir = 1), no position (strategy.position_size = 0), cooldown passed (can_trade), and VIX < 20 (can_long). Enters with user-defined contracts.
Short Entry: sell_signal (fast EMA crosses below slow EMA, trend_dir = -1), no position, cooldown passed, can_short (always true).
Logic: Tracks last_entry_bar for visuals, last_trade_bar for cooldowns.
Exit Conditions:
Stop-Loss/Take-Profit: ATR-based stops (1.1–1.3x) and TPs (2x stop distance). Longs exit if price hits stop (below) or TP (above); shorts vice versa.
No Other Exits: Keeps it straightforward, relying on stops/TPs.
5. DAFE Visuals
The visuals are pure DAFE magic, blending clean function with informative metrics utilized by professionals, now enhanced by faster signals and a responsive breadth background:
EMA Plots:
Display: Fast EMA (blue, 2px), slow EMA (orange, 2px), using faster lengths (5–9/12–18).
Purpose: Highlights momentum shifts, with crossovers signaling entries.
Sector Breadth Background:
Display: Green (90% transparent) if breadth > 4, red (90%) if breadth < -4, else neutral.
Purpose: Faster breadth_sma_len (5–12 vs. 10–50) reflects sector shifts in real-time, reinforcing signal strength.
- Visuals are intuitive, turning complex signals into clear buy/sell cues.
- Faster breadth background reacts to market rotations (e.g., tech vs. energy), giving a pro-level edge.
6. Sector Breadth Dashboard
The new bottom-left dashboard is a game-changer, a 3x16 table (black/gray theme) that’s your market command center:
Metrics:
VIX: Current VIX (red if > 20, gray if not).
SPX: Trend as “UP” (green), “DOWN” (red), or “FLAT” (gray).
Trade Longs: “OK” (green) if VIX < 20, “BLOCK” (red) if not.
Sector Breadth: 10 sectors (Tech, Financial, etc.) with trend arrows (↑ green, ↓ red, - gray).
Placeholder Row: Empty for future metrics (e.g., ATR, breadth score).
Purpose: Consolidates regime, volatility, market trend, and sector data, making decisions a breeze.
- VIX and SPX metrics add context, helping beginners avoid bad trades (e.g., no longs if “BLOCK”).
Sector arrows show market health at a glance, like a cheat code for sentiment.
Key Features
Beginner-Ready: Preset modes and clear visuals make futures trading a breeze.
Sentiment-Driven: VIX filter, SPX trend, and sector breadth keep you in sync with the market.
High-Frequency: Faster EMAs, tighter stops, and short cooldowns boost trade volume.
Safe and Smart: Adaptive stops/TPs and cooldowns protect capital while maximizing wins.
Visual Mastery: DAFE’s clean flair, EMAs, dashboard—makes trading fun and clear.
Backtestable: Lean code and fixed qty ensure accurate historical testing.
How to Use
Add to Chart: Load on a 5min MNQ/ES chart in TradingView.
Pick Preset: Aggressive (scalping), Balanced (versatile), or Conservative (safe). Balanced is default.
Set Contracts: Default 1, max 10. Stick low for safety.
Check Dashboard: Bottom-left shows preset, VIX, SPX, and sectors. “OK” + green breadth = strong buy.
Backtest: Run in strategy tester to compare modes.
Live Trade: Connect to Tradovate or similar. Watch for slippage (e.g., April 27, 2025 ES issues).
Replay Test: Try April 28, 2025 NQ drop to see VIX filter and stops in action.
Why It’s Brilliant
The Dskyz (DAFE) Quantum Sentiment Flux - Beginners is a masterpiece of simplicity and power. It takes pro-level tools—momentum, VIX, sector breadth—and wraps them in a system anyone can run. Faster signals and tighter stops make it a trading machine, while the VIX filter and dashboard keep you ahead of market chaos. The DAFE visuals and bottom-left command center turn your chart into a futuristic cockpit, guiding you through every trade. For beginners, it’s a safe entry to futures; for pros, it’s a scalping beast with sentiment smarts. This strat doesn’t just trade—it transforms how you see the market.
Final Notes
This is more than a strategy—it’s your launchpad to mastering futures with Dskyz (DAFE) flair. The Quantum Sentiment Flux blends accessibility, speed, and market savvy to help you outsmart the game. Load it, watch those triangles glow, and let’s make the markets your canvas!
Official Statement from Pine Script Team
(see TradingView help docs and forums):
"This warning may appear when you call functions such as ta.sma inside a request.security in a loop. There is no runtime impact. If you need to loop through a dynamic list of tickers, this cannot be avoided in the present version... Values will still be correct. Ignore this warning in such contexts."
(This publishing will most likely be taken down do to some miscellaneous rule about properly displaying charting symbols, or whatever. Once I've identified what part of the publishing they want to pick on, I'll adjust and repost.)
Use it with discipline. Use it with clarity. Trade smarter.
**I will continue to release incredible strategies and indicators until I turn this into a brand or until someone offers me a contract.
Created by Dskyz, powered by DAFE Trading Systems. Trade fast, trade bold.

Weighted Ichimoku StrategyLSE:HSBA
The Ichimoku Kinko Hyo indicator is a comprehensive tool that combines multiple signals to identify market trends and potential buying/selling opportunities. My weighted variant of this strategy attempts to assign specific weights to each signal, allowing for a more nuanced and customizable approach to trend identification. The intent is to try and make a more informed trading decision based on the cumulative strength of various signals.
I've tried not to make it a mishmash of this and that + MACD + RSI and on and on; most people have their preferred indicator that focuses on just that that they can use in conjunction.
The signals used can be grouped into two groups the 'Core Ichimoku Signals' & the 'Additional Signals' (at the end you will find the signals and their assigned weights followed by the thresholds where they align).
The Core Ichimoku Signals are the primary signals used in Ichimoku analysis, including Kumo Breakout, Chikou Cross, Kijun Cross, Tenkan Cross, and Kumo Twist.
While the Additional Signals provide further insights and confirmations, such as Kijun Confirmation, Tenkan-Kijun Above Cloud, Chikou Above Cloud, Price-Kijun Cross, Chikou Span Signal, and Price Positioning.
Entries are triggered when the cumulative weight of bullish signals exceeds a specified buy threshold, indicating a strong uptrend or potential trend reversal.
Exits are initiated when the cumulative weight of bearish signals surpasses a specified sell threshold, or when additional conditions such as consolidation patterns or ATR-based targets are met.
There are various exit types that you can choose between, which can be used separately or in conjunction with one another. As an example you might want to exit on a different condition during consolidation periods than during other periods or just use ATR with some other backstop.
They are listed in evaluation order i.e. ATR trumps all, Consolidation exit trumps the regular Kumo sell and so on:
**ATR Sell**: Exits trades based on ATR-based profit targets and stop-losses.
**Consolidation Exit**: Exits trades during consolidation periods to reduce drawdown.
**Sell Below Kumo**: Exits trades when the price is below the Kumo, indicating a potential downtrend.
**Sell Threshold**: Exits trades when the cumulative weight of bearish signals surpasses a specified sell threshold.
There are various 'filters' which are really behavior modifiers:
**Kumo Breakout Filter**: Requires price to close above the Kumo for buy signals (essentially a entry delay).
**Whipsaw Filter**: Ensures trend strength over specified days to reduce false signals.
**Buy Cooldown**: Prevents new entries until half the Kijun period passes after an exit (prevents flapping).
**Chikou Filter**: Delays exits unless the previous close is below the Chikou Span.
**Consolidation Trend Filter**: Prevents consolidation exits if the trend is bullish (rare, but happens).
Then there are some debugging options. Ichimoku periods have some presets (personally I like 8/22/44/22) but are freely configurable, preset to the traditional values for purists.
The list of signals and most thresholds follow, play around with them. Thats all.
Cheers,
**Core Ichimoku Signals**
**Kumo Breakout**
- 30 (Bullish) / -30 (Bearish)
- Indicates a strong trend when the price breaks above (bullish) or below (bearish) the Kumo (cloud). This signal suggests a significant shift in market sentiment.
**Chikou Cross**
- 20 (Bullish) / -20 (Bearish)
- Shows the relationship between the Chikou Span (lagging span) and the current price. A bullish signal occurs when the Chikou Span is above the price, indicating a potential uptrend. Conversely, a bearish signal occurs when the Chikou Span is below the price, suggesting a downtrend.
**Kijun Cross**
- 15 (Bullish) / -15 (Bearish)
- Signals trend changes when the Tenkan-sen (conversion line) crosses above (bullish) or below (bearish) the Kijun-sen (base line). This crossover is often used to identify potential trend reversals.
**Tenkan Cross**
- 10 (Bullish) / -10 (Bearish)
- Indicates short-term trend changes when the price crosses above (bullish) or below (bearish) the Tenkan-sen. This signal helps identify minor trend shifts within the broader trend.
**Kumo Twist**
- 5 (Bullish) / -5 (Bearish)
- Shows changes in the Kumo's direction, indicating potential trend shifts. A bullish Kumo Twist occurs when Senkou Span A crosses above Senkou Span B, and a bearish twist occurs when Senkou Span A crosses below Senkou Span B.
**Additional Signals**
**Kijun Confirmation**
- 8 (Bullish) / -8 (Bearish)
- Confirms the trend based on the price's position relative to the Kijun-sen. A bullish signal occurs when the price is above the Kijun-sen, and a bearish signal occurs when the price is below it.
**Tenkan-Kijun Above Cloud**
- 5 (Bullish) / -5 (Bearish)
- Indicates a strong bullish trend when both the Tenkan-sen and Kijun-sen are above the Kumo. Conversely, a bearish signal occurs when both lines are below the Kumo.
**Chikou Above Cloud**
- 5 (Bullish) / -5 (Bearish)
- Shows the Chikou Span's position relative to the Kumo, indicating trend strength. A bullish signal occurs when the Chikou Span is above the Kumo, and a bearish signal occurs when it is below.
**Price-Kijun Cross**
- 2 (Bullish) / -2 (Bearish)
- Signals short-term trend changes when the price crosses above (bullish) or below (bearish) the Kijun-sen. This signal is similar to the Kijun Cross but focuses on the price's direct interaction with the Kijun-sen.
**Chikou Span Signal**
- 10 (Bullish) / -10 (Bearish)
- Indicates the trend based on the Chikou Span's position relative to past price highs and lows. A bullish signal occurs when the Chikou Span is above the highest high of the past period, and a bearish signal occurs when it is below the lowest low.
**Price Positioning**
- 10 (Bullish) / -10 (Bearish)
- Shows indecision when the price is between the Tenkan-sen and Kijun-sen, indicating a potential consolidation phase. A bullish signal occurs when the price is above both lines, and a bearish signal occurs when the price is below both lines.
**Confidence Level**: Highly Sensitive
- **Buy Threshold**: 50
- **Sell Threshold**: -50
- **Notes / Significance**: ~2–3 signals, very early trend detection. High sensitivity, may capture noise and false signals.
**Confidence Level**: Entry-Level
- **Buy Threshold**: 58
- **Sell Threshold**: -58
- **Notes / Significance**: ~3–4 signals, often Chikou Cross or Kumo Breakout. Very sensitive, risks noise (e.g., false buys in choppy markets).
**Confidence Level**: Entry-Level
- **Buy Threshold**: 60
- **Sell Threshold**: -60
- **Notes / Significance**: ~3–4 signals, Kumo Breakout or Chikou Cross anchors. Entry point for early trends.
**Confidence Level**: Moderate
- **Buy Threshold**: 65
- **Sell Threshold**: -65
- **Notes / Significance**: ~4–5 signals, balances sensitivity and reliability. Suitable for moderate risk tolerance.
**Confidence Level**: Conservative
- **Buy Threshold**: 70
- **Sell Threshold**: -70
- **Notes / Significance**: ~4–5 signals, emphasizes stronger confirmations. Reduces false signals but may miss some opportunities.
**Confidence Level**: Very Conservative
- **Buy Threshold**: 75
- **Sell Threshold**: -75
- **Notes / Significance**: ~5–6 signals, prioritizes high confidence. Minimizes risk but may enter trades late.
**Confidence Level**: High Confidence
- **Buy Threshold**: 80
- **Sell Threshold**: -80
- **Notes / Significance**: ~6–7 signals, very strong confirmations needed. Suitable for cautious traders.
**Confidence Level**: Very High Confidence
- **Buy Threshold**: 85
- **Sell Threshold**: -85
- **Notes / Significance**: ~7–8 signals, extremely high confidence required. Minimizes false signals significantly.
**Confidence Level**: Maximum Confidence
- **Buy Threshold**: 90
- **Sell Threshold**: -90
- **Notes / Significance**: ~8–9 signals, maximum confidence level. Ensures trades are highly reliable but may result in fewer trades.
**Confidence Level**: Ultra Conservative
- **Buy Threshold**: 100
- **Sell Threshold**: -100
- **Notes / Significance**: ~9–10 signals, ultra-high confidence. Trades are extremely reliable but opportunities are rare.
**Confidence Level**: Extreme Confidence
- **Buy Threshold**: 110
- **Sell Threshold**: -110
- **Notes / Significance**: All signals align, extreme confidence. Trades are almost certain but very few opportunities.

Green*DiamondGreen*Diamond (GD1)
Unleash Dynamic Trading Signals with Volatility and Momentum
Overview
GreenDiamond is a versatile overlay indicator designed for traders seeking actionable buy and sell signals across various markets and timeframes. Combining Volatility Bands (VB) bands, Consolidation Detection, MACD, RSI, and a unique Ribbon Wave, it highlights high-probability setups while filtering out noise. With customizable signals like Green-Yellow Buy, Pullback Sell, and Inverse Pullback Buy, plus vibrant candle and volume visuals, GreenDiamond adapts to your trading style—whether you’re scalping, day trading, or swing trading.
Key Features
Volatility Bands (VB): Plots dynamic upper and lower bands to identify breakouts or reversals, with toggleable buy/sell signals outside consolidation zones.
Consolidation Detection: Marks low-range periods to avoid choppy markets, ensuring signals fire during trending conditions.
MACD Signals: Offers flexible buy/sell conditions (e.g., cross above signal, above zero, histogram up) with RSI divergence integration for precision.
RSI Filter: Enhances signals with customizable levels (midline, oversold/overbought) and bullish divergence detection.
Ribbon Wave: Visualizes trend strength using three EMAs, colored by MACD and RSI for intuitive momentum cues.
Custom Signals: Includes Green-Yellow Buy, Pullback Sell, and Inverse Pullback Buy, with limits on consecutive signals to prevent overtrading.
Candle & Volume Styling: Blends MACD/RSI colors on candles and scales volume bars to highlight momentum spikes.
Alerts: Set up alerts for VB signals, MACD crosses, Green*Diamond signals, and custom conditions to stay on top of opportunities.
How It Works
Green*Diamond integrates multiple indicators to generate signals:
Volatility Bands: Calculates bands using a pivot SMA and standard deviation. Buy signals trigger on crossovers above the lower band, sell signals on crossunders below the upper band (if enabled).
Consolidation Filter: Suppresses signals when candle ranges are below a threshold, keeping you out of flat markets.
MACD & RSI: Combines MACD conditions (e.g., cross above signal) with RSI filters (e.g., above midline) and optional volume spikes for robust signals.
Custom Logic: Green-Yellow Buy uses MACD bullishness, Pullback Sell targets retracements, and Inverse Pullback Buy catches reversals after downmoves—all filtered to avoid consolidation.
Visuals: Ribbon Wave shows trend direction, candles blend momentum colors, and volume bars scale dynamically to confirm signals.
Settings
Volatility Bands Settings:
VB Lookback Period (20): Adjust to 10–15 for faster markets (e.g., 1-minute scalping) or 25–30 for daily charts.
Upper/Lower Band Multiplier (1.0): Increase to 1.5–2.0 for wider bands in volatile stocks like AEHL; decrease to 0.5 for calmer markets.
Show Volatility Bands: Toggle off to reduce chart clutter.
Use VB Signals: Enable for breakout-focused trades; disable to focus on Green*Diamond signals.
Consolidation Settings:
Consolidation Lookback (14): Set to 5–10 for small caps (e.g., AEHL) to catch quick consolidations; 20 for higher timeframes.
Range Threshold (0.5): Lower to 0.3 for stricter filtering in choppy markets; raise to 0.7 for looser signals.
MACD Settings:
Fast/Slow Length (12/26): Shorten to 8/21 for scalping; extend to 15/34 for swing trading.
Signal Smoothing (9): Reduce to 5 for faster signals; increase to 12 for smoother trends.
Buy/Sell Signal Options: Choose “Cross Above Signal” for classic MACD; “Histogram Up” for momentum plays.
Use RSI Div + MACD Cross: Enable for high-probability reversal signals.
RSI Settings:
RSI Period (14): Drop to 10 for 1-minute charts; raise to 20 for daily.
Filter Level (50): Set to 55 for stricter buys; 45 for sells.
Overbought/Oversold (70/30): Tighten to 65/35 for small caps; widen to 75/25 for indices.
RSI Buy/Sell Options: Select “Bullish Divergence” for reversals; “Cross Above Oversold” for momentum.
Color Settings:
Adjust bullish/bearish colors for visibility (e.g., brighter green/red for dark themes).
Border Thickness (1): Increase to 2–3 for clearer candle outlines.
Volume Settings:
Volume Average Length (20): Shorten to 10 for scalping; extend to 30 for swing trades.
Volume Multiplier (2.0): Raise to 3.0 for AEHL’s volume surges; lower to 1.5 for steady stocks.
Bar Height (10%): Increase to 15% for prominent bars; decrease to 5% to reduce clutter.
Ribbon Settings:
EMA Periods (10/20/30): Tighten to 5/10/15 for scalping; widen to 20/40/60 for trends.
Color by MACD/RSI: Disable for simpler visuals; enable for dynamic momentum cues.
Gradient Fill: Toggle on for trend clarity; off for minimalism.
Custom Signals:
Enable Green-Yellow Buy: Use for momentum confirmation; limit to 1–2 signals to avoid spam.
Pullback/Inverse Pullback % (50): Set to 30–40% for small caps; 60–70% for indices.
Max Buy Signals (1): Increase to 2–3 for active markets; keep at 1 for discipline.
Tips and Tricks
Scalping Small Caps (e.g., AEHL):
Use 1-minute charts with VB Lookback = 10, Consolidation Lookback = 5, and Volume Multiplier = 3.0 to catch $0.10–$0.20 moves.
Enable Green-Yellow Buy and Inverse Pullback Buy for quick entries; disable VB Signals to focus on Green*Diamond logic.
Pair with SMC+ green boxes (if you use them) for reversal confirmation.
Day Trading:
Try 5-minute charts with MACD Fast/Slow = 8/21 and RSI Period = 10.
Enable RSI Divergence + MACD Cross for high-probability setups; set Max Buy Signals = 2.
Watch for volume bars turning yellow to confirm entries.
Swing Trading:
Use daily charts with VB Lookback = 30, Ribbon EMAs = 20/40/60.
Enable Pullback Sell (60%) to exit after rallies; disable RSI Color for cleaner candles.
Check Ribbon Wave gradient for trend strength—bright green signals strong bulls.
Avoiding Noise:
Increase Consolidation Threshold to 0.7 on volatile days to skip false breakouts.
Disable Ribbon Wave or Volume Bars if the chart feels crowded.
Limit Max Buy Signals to 1 for disciplined trading.
Alert Setup:
In TradingView’s Alerts panel, select:
“GD Buy Signal” for standard entries.
“RSI Div + MACD Cross Buy” for reversals.
“VB Buy Signal” for breakout plays.
Set to “Once Per Bar Close” for confirmed signals; “Once Per Bar” for scalping.
Backtesting:
Replay on small caps ( Float < 5M, Price $0.50–$5) to test signals.
Focus on “GD Buy Signal” with yellow volume bars and green Ribbon Wave.
Avoid signals during gray consolidation squares unless paired with RSI Divergence.
Usage Notes
Markets: Works on stocks, forex, crypto, and indices. Best for volatile assets (e.g., small-cap stocks, BTCUSD).
Timeframes: Scalping (1–5 minutes), day trading (15–60 minutes), or swing trading (daily). Adjust settings per timeframe.
Risk Management: Combine with stop-losses (e.g., 1% risk, $0.05 below AEHL entry) and take-profits (3–5%).
Customization: Tweak inputs to match your strategy—experiment in replay to find your sweet spot.
Disclaimer
Green*Diamond is a technical tool to assist with trade identification, not a guarantee of profits. Trading involves risks, and past performance doesn’t predict future results. Always conduct your own analysis, manage risk, and test settings before live trading.
Feedback
Love Green*Diamond? Found a killer setup?

M & W Checklistindicator to Validate & Grade M & W Patterns.
Indicator Inputs
Table Color Palette
• Position Valid : Positions the Valid Trade table on the chart.
• Position Grade : Positions the Grade table on the chart, hover over the Column 1 Row 1 for a description of the bands.
• Size: Text size for all tables.
• Text Color : Sets text color.
• Border Color : Sets the table border color for all tables.
• Background Color : Sets table backgroud color for all tables.
Valid Trade Table
Checkboxes to indicate if the trade is valid. Fail is displayed if unchecked, Pass if checked.
Grade Table
• S/R Level 1: distance between neckline and 1st resistance area in % of the total distance between neckline and take profit. This is not for road blocks but pivot points etc before the initial run up/down in price. I have this set to 30% , this means that if there is a pivot point between the neckline and 30% of the TP level I weight it negatively.
• S/R Level 2: distance between neckline and 1st resistance area in % of the total distance between neckline and take profit. This is not for road blocks but pivot points etc before the initial run up/down in price. I have this set to 50% , this means that if there is a pivot point between the neckline and 50% of the TP level 2 weight it negatively but less so than level 1.
• S/R Level 3: distance between neckline and 1st resistance area in % of the total distance between neckline and take profit. This is not for road blocks but pivot points etc before the initial run up/down in price. I have this set to 70% , this means that if there is a pivot point between the neckline and 70% of the TP level 3 weight it negatively but less so than level 1 & level 2.
• Checkboxes are self explanatory, they are binary options, all are weighted negatively if checked and are weighted positively if unchecked. Divergence values for weighting are neutral if unckecked & weighted positively if checked.
• The select options are neutral weighting if set to neutral , if set to For its weighted positive and set to Against weighted negatively.
Technical Specification of the Scoring and Band System
Overview
The scoring system is designed to evaluate a set of technical trade conditions, assigning weights to various criteria that influence the quality of the trade. The system calculates a total score based on both positive and negative conditions. Based on the final score, the system assigns a grade or band (A, B, or C) for positive scores, and a "Negative" label for negative scores.
Scoring System
The system calculates the score by evaluating a set of 12 conditions (gradeCondition1 to gradeCondition12). These conditions are manually input by the user via checkboxes or dropdowns in a technical indicator (written in Pine Script for TradingView). The score weights vary according to the relative importance of each condition.
Condition Breakdown and Weighting:
1. Divergences (GradeCondition1 & GradeCondition2):
◦ 1H Divergence: +5 points if condition is true.
◦ 4H Divergence: +10 points if condition is true (stronger weight than 1H).
2. Support/Resistance at Neckline (GradeCondition3):
◦ Negative if present: -15 points if true (carries significant negative weight).
3. RB near Entry (GradeCondition4):
◦ Very Negative: -20 points if true (this is a critical negative condition).
4. RB can Manage (GradeCondition5):
◦ Slightly Negative: -5 points if true.
5. Institutional Value Zones (GradeCondition6 to GradeCondition8):
◦ For the trade: +5 points.
◦ Against the trade: -5 points.
◦ Neutral: 0 points.
6. S/R between Neckline & Targets (GradeCondition9 to GradeCondition11):
◦ Level 1: -10 points if true, +7 points if false.
◦ Level 2: -7 points if true, +7 points if false.
◦ Level 3: -5 points if true, +7 points if false.
◦ Use fib tool or Gann Box to measure any S/R levels setup according to your preferences.
7. News Timing (GradeCondition12):
◦ News within 3 hours: -20 points if true (strong negative factor).
◦ No upcoming news: +10 points if false.
Scoring Calculation Formula:
totalScore = score1 + score2 + score3 + score4 + score5 + score6 + score7 + score8 + score9 + score10 + score11 + score12
Where:
• score1 to score12 represent the points derived from the conditions described above.
Coloring and Visual Feedback:
• Positive Scores: Displayed in green.
• Negative Scores: Displayed in red.
Band System
The Band System classifies the total score into different grades, depending on the final value of totalScore. This classification provides an intuitive ranking for trades, helping users quickly assess trade quality.
Band Classification:
• Band A: If the totalScore is 41 or more.
◦ Represents a highly favorable trade setup.
• Band B: If the totalScore is between 21 and 40.
◦ Represents a favorable trade setup with good potential.
• Band C: If the totalScore is between 1 and 20.
◦ Represents a trade setup that is acceptable but may have risks.
• Negative: If the totalScore is 0 or less.
◦ Represents a poor trade setup with significant risks or unfavorable conditions.
Band Calculation Logic (in Pine Script):
var string grade = ""
if (totalScore >= 41)
grade := "Band A"
else if (totalScore >= 21)
grade := "Band B"
else if (totalScore >= 1)
grade := "Band C"
else
grade := "Negative"
Technical Key Points:
• Highly Negative Conditions:
◦ The system penalizes certain conditions more heavily, especially those that suggest significant risks (e.g., News in less than 3 hours, RB near Entry).
• Positive Trade Conditions:
◦ Divergences, Institutional Value Zones in favor of the trade, and lack of significant nearby resistance all contribute positively to the score.
• Flexible System:
◦ The system can be adapted or fine-tuned by adjusting the weights of individual conditions according to trading preferences.
Use Case Example:
• If a trade has 1H and 4H Divergence, RB near Entry (negative), and no upcoming news:
◦ 1H Divergence: +5 points.
◦ 4H Divergence: +10 points.
◦ RB near Entry: -20 points.
◦ No news: +10 points.
◦ Total Score: 5 + 10 - 20 + 10 = 5 → Band C.
This modular and flexible scoring system allows traders to systematically evaluate trades and quickly gauge the trade's potential based on technical indicators
Summary:
Maximum Score: 61
Minimum Score: -97
These are the bounds of the score range based on the current logic of the script.

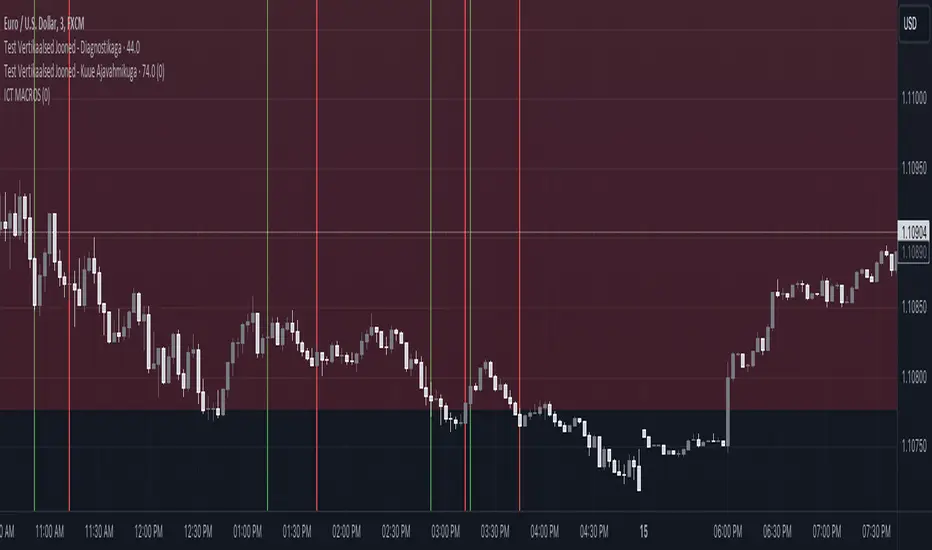
ICT MACROS (UTC-4)This Pine Script creates an indicator that draws vertical lines on a TradingView chart to mark specific time intervals during the day. It allows the user to see when certain predefined time periods start and end, using vertical lines of different colors. The script is designed to work with time frames aligned to the UTC-4 timezone.
### Key Features of the Script
1. **Vertical Line Drawing Function**:
- The script uses a custom function, `draw_vertical_line`, to draw vertical lines at specific times.
- This function takes four parameters:
- `specificTime`: The specific timestamp when the vertical line should be drawn.
- `lineColor`: The color of the vertical line.
- `labelText`: The text label for the line (used internally for debugging purposes).
- `adjustment_minutes`: An integer value that allows time adjustment (in minutes) to make the lines align more accurately with the chart’s candles.
- The function calculates an adjusted time using the `adjustment_minutes` parameter and checks if the current time (`time`) falls within a 3-minute range of the adjusted time. If it does, it draws a vertical line.
2. **User Input for Time Adjustment**:
- The `adjustment_minutes` input allows users to fine-tune the appearance of the lines by shifting them slightly forward or backward in time to ensure they align with the chart candles. This is useful because of potential minor discrepancies between the script’s timestamps and the chart’s actual candle times.
3. **Predefined Time Intervals**:
- The script specifies six different time intervals (using the UTC-4 timezone) and draws vertical lines to mark the start and end of each interval:
- **First interval**: 8:50 - 9:10 AM
- **Second interval**: 9:50 - 10:10 AM
- **Third interval**: 10:50 - 11:10 AM
- **Fourth interval**: 13:10 - 13:40 PM
- **Fifth interval**: 14:50 - 15:10 PM
- **Sixth interval**: 15:15 - 15:45 PM
- For each interval, there are two timestamps: the start time and the end time. The script draws a green vertical line for the start and a red vertical line for the end.
4. **Line Drawing Logic**:
- For each time interval, the script calculates the timestamp using the `timestamp()` function with the specified time in UTC-4.
- The `draw_vertical_line` function is called twice for each interval: once for the start time (with a green line) and once for the end time (with a red line).
5. **Visual Overlay**:
- The script uses the `overlay=true` setting, which means that the vertical lines are drawn directly on top of the existing price chart. This helps in visually identifying the specific time intervals without cluttering the chart.
### Summary
This Pine Script is designed for traders or analysts who want to visualize specific time intervals directly on their TradingView charts. It provides a customizable way to highlight these intervals using vertical lines, making it easier to analyze price action or trading volume during key times of the day. The `adjustment_minutes` input adds flexibility to align these lines accurately with chart data.
Macro Times [Blu_Ju]About ICT Macro Times:
The Inner Circle Trader (ICT) has taught that there are certain time sessions when the Interbank Price Delivery Algorithm (IPDA) is running a macro. The macro itself could be a repricing macro, a consolidation macro, etc. - this depends on where price currently is in relation to its draw. The times the macro is active do not change however, and are always the following (in New York local time):
8:50-9:10 (premarket macro)
9:50-10:10 (AM macro 1)
10:50-11:10 (AM macro 2)
11:50-12:10 (lunch macro)
13:10-13:40 (PM macro)
15:15-15:45 (final hour macro)
Because these times are fixed, traders can anticipate a setup is likely to form in or around these sessions. Setups may involve sweeps of liquidity (highs/lows), repricing to inefficiencies (e.g., fair value gaps), breaker setups, etc. (The specific setup involved is beyond the scope of this script; this script is concerned with visually marking the time sessions only.)
About this Script:
The scope of this script is to visually identify the macro active time sessions. This script draws vertical lines to mark the start and end of the macro time sessions. Optionally, the user can use a background color for the macro session with or without the vertical lines. The user can also toggle on or off any of the macro sessions, if he or she is only interested in certain ones. The user also has the freedom to change the times of the macro sessions if he or she is interested in a different time.
What makes this script unique is that it plots the macro time sessions after midnight for each day, before the real-time bar reaches the macro times. This is advantageous to the trader, as it gives the trader a visual cue that the macro times are approaching. When watching price it is easy to lose track of time, and the purpose of this script is to help the trader maintain where price is in relation to the macro time sessions in a simple, visual way.

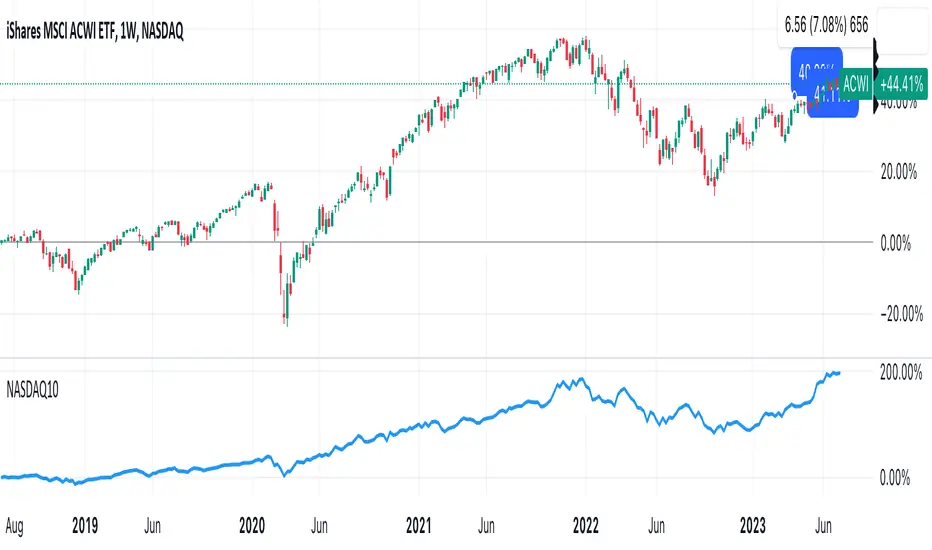
DrNon_NASDAQ10Title: NASDAQ 10 Index with TOP 10 Securities
Introduction:
TradingView offers traders and investors a powerful platform for technical analysis and trading. One of its notable features is the ability to create custom indices based on the values of multiple individual securities. In this blog post, we will explore how to build a custom index with 10 securities in TradingView using Pine Script, the platform's proprietary programming language.
Description:
Custom indices allow market participants to track the performance of a specific group of securities, providing valuable insights into the collective performance of the chosen assets. By leveraging Pine Script, traders can easily develop and deploy custom indicators and strategies to build their own indices.
The script provided focuses on creating a custom index with 10 securities. The selected securities include popular stocks such as AAPL (Apple Inc.), MSFT (Microsoft Corporation), GOOG (Alphabet Inc.), AMZN (Amazon.com Inc.), NVDA (NVIDIA Corporation), TSLA (Tesla Inc.), META (Facebook, Inc.), AVGO (Broadcom Inc.), PEP (PepsiCo, Inc.), and COST (Costco Wholesale Corporation).
Using the security() function in Pine Script, we retrieve the closing prices of each individual security to ensure accurate data for the index calculation.
The index value is then calculated by summing the closing prices of the 10 securities. This simple arithmetic operation captures the overall performance of the custom index.
To visualize the index, we use the plot() function to display the index value on the chart. Traders can observe the custom index alongside other technical indicators or price action, aiding in decision-making and market analysis.
By building a custom index with 10 securities in TradingView, traders gain a consolidated view of the performance of these chosen assets. This allows for easier tracking of sector trends, evaluation of specific strategies, and the ability to compare the performance of individual portfolios against the broader market.
Conclusion:
TradingView's Pine Script provides traders and investors with a flexible solution to build custom indices. By defining the 10 individual securities, calculating the index value, and plotting it on the chart, traders can monitor the collective performance of these chosen assets. Custom indices offer insights into sector performance, enable the evaluation of specific strategies, and provide a benchmark for comparing portfolio performance. By harnessing the power of custom indices in TradingView, traders can enhance their decision-making process and gain a competitive edge in the market.
ICT Algorithmic Macro Tracker° (Open-Source) by toodegreesDescription:
The ICT Algorithmic Macro Tracker° Indicator is a powerful tool designed to enhance your trading experience by clearly and efficiently plotting the known ICT Macro Times on your chart.
Based on the teachings of the Inner Circle Trader , these Time windows correspond to periods when the Interbank Price Delivery Algorithm undergoes a series of checks ( Macros ) and is probable to move towards Liquidity.
The indicator allows traders to visualize and analyze these crucial moments in NY Time:
- 2:33-3:00
- 4:03-4:30
- 8:50-9:10
- 9:50-10:10
- 10:50-11:10
- 11:50-12:10
- 13:10-13:50
- 15:15-15:45
By providing a clean and clutter-free representation of ICT Macros, this indicator empowers traders to make more informed decisions, optimize and build their strategies based on Time.
Massive shoutout to @reastruth for his ICT Macros Indicator , and for allowing to create one of my own, go check him out!
Indicator Features:
– Track ongoing ICT Macros to aid your Live analysis.
- Gain valuable insights by hovering over the plotted ICT Macros to reveal tooltips with interval information.
– Plot the ICT Macros in one of two ways:
"On Chart": visualize ICT Macro timeframes directly on your chart, with automatic adjustments as Price moves.
Pro Tip: toggle Projections to see exactly where Macros begin and end without difficulty.
"New Pane": move the indicator two a New Pane to see both Live and Upcoming Macro events with ease in a dedicated section
Pro Tip: this section can be collapsed by double-clicking on the main chart, allowing for seamless trading preparation.
This indicator is available only on the TradingView platform.
⚠️ Open Source ⚠️
Coders and TV users are authorized to copy this code base, but a paid distribution is prohibited. A mention to the original author is expected, and appreciated.
⚠️ Terms and Conditions ⚠️
This financial tool is for educational purposes only and not financial advice. Users assume responsibility for decisions made based on the tool's information. Past performance doesn't guarantee future results. By using this tool, users agree to these terms.

ICT Macros by CryptoforICT Macros by Cryptofor
Time periods in which the price is most volatile. At this time, the algorithm is programmed to attack liquidity or fill a significant FVG from which the OF can continue.
Plots of macros:
1. London Macros:
02:33 - 03:00
04:03 - 04:30
2. New York AM Macros:
08:50 - 09:10
09:50 - 10:10
10:50 - 11:10
3. New York Lunch + PM Macros:
11:50 - 12:10
13:10 - 13:40
15:15 - 15:45
Features:
Flexible line settings
Flexible text settings
Display data for all time or for the last 24 hours
Switch for each type of macro
Macro background color settings

Machine Learning: kNN (New Approach)Description:
kNN is a very robust and simple method for data classification and prediction. It is very effective if the training data is large. However, it is distinguished by difficulty at determining its main parameter, K (a number of nearest neighbors), beforehand. The computation cost is also quite high because we need to compute distance of each instance to all training samples. Nevertheless, in algorithmic trading KNN is reported to perform on a par with such techniques as SVM and Random Forest. It is also widely used in the area of data science.
The input data is just a long series of prices over time without any particular features. The value to be predicted is just the next bar's price. The way that this problem is solved for both nearest neighbor techniques and for some other types of prediction algorithms is to create training records by taking, for instance, 10 consecutive prices and using the first 9 as predictor values and the 10th as the prediction value. Doing this way, given 100 data points in your time series you could create 10 different training records. It's possible to create even more training records than 10 by creating a new record starting at every data point. For instance, you could take the first 10 data points and create a record. Then you could take the 10 consecutive data points starting at the second data point, the 10 consecutive data points starting at the third data point, etc.
By default, shown are only 10 initial data points as predictor values and the 6th as the prediction value.
Here is a step-by-step workthrough on how to compute K nearest neighbors (KNN) algorithm for quantitative data:
1. Determine parameter K = number of nearest neighbors.
2. Calculate the distance between the instance and all the training samples. As we are dealing with one-dimensional distance, we simply take absolute value from the instance to value of x (| x – v |).
3. Rank the distance and determine nearest neighbors based on the K'th minimum distance.
4. Gather the values of the nearest neighbors.
5. Use average of nearest neighbors as the prediction value of the instance.
The original logic of the algorithm was slightly modified, and as a result at approx. N=17 the resulting curve nicely approximates that of the sma(20). See the description below. Beside the sma-like MA this algorithm also gives you a hint on the direction of the next bar move.

CDC ActionZone BF for ETHUSD-1D © PRoSkYNeT-EE
Based on improvements from "Kitti-Playbook Action Zone V.4.2.0.3 for Stock Market"
Based on improvements from "CDC Action Zone V3 2020 by piriya33"
Based on Triple MACD crossover between 9/15, 21/28, 15/28 for filter error signal (noise) from CDC ActionZone V3
MACDs generated from the execution of millions of times in the "Brute Force Algorithm" to backtest data from the past 5 years. ( 2017-08-21 to 2022-08-01 )
Released 2022-08-01
***** The indicator is used in the ETHUSD 1 Day period ONLY *****
Recommended Stop Loss : -4 % (execute stop Loss after candlestick has been closed)
Backtest Result ( Start $100 )
Winrate 63 % (Win:12, Loss:7, Total:19)
Live Days 1,806 days
B : Buy
S : Sell
SL : Stop Loss
2022-07-19 07 - 1,542 : B 6.971 ETH
2022-04-13 07 - 3,118 : S 8.98 % $10,750 12,7,19 63 %
2022-03-20 07 - 2,861 : B 3.448 ETH
2021-12-03 07 - 4,216 : SL -8.94 % $9,864 11,7,18 61 %
2021-11-30 07 - 4,630 : B 2.340 ETH
2021-11-18 07 - 3,997 : S 13.71 % $10,832 11,6,17 65 %
2021-10-05 07 - 3,515 : B 2.710 ETH
2021-09-20 07 - 2,977 : S 29.38 % $9,526 10,6,16 63 %
2021-07-28 07 - 2,301 : B 3.200 ETH
2021-05-20 07 - 2,769 : S 50.49 % $7,363 9,6,15 60 %
2021-03-30 07 - 1,840 : B 2.659 ETH
2021-03-22 07 - 1,681 : SL -8.29 % $4,893 8,6,14 57 %
2021-03-08 07 - 1,833 : B 2.911 ETH
2021-02-26 07 - 1,445 : S 279.27 % $5,335 8,5,13 62 %
2020-10-13 07 - 381 : B 3.692 ETH
2020-09-05 07 - 335 : S 38.43 % $1,407 7,5,12 58 %
2020-07-06 07 - 242 : B 4.199 ETH
2020-06-27 07 - 221 : S 28.49 % $1,016 6,5,11 55 %
2020-04-16 07 - 172 : B 4.598 ETH
2020-02-29 07 - 217 : S 47.62 % $791 5,5,10 50 %
2020-01-12 07 - 147 : B 3.644 ETH
2019-11-18 07 - 178 : S -2.73 % $536 4,5,9 44 %
2019-11-01 07 - 183 : B 3.010 ETH
2019-09-23 07 - 201 : SL -4.29 % $551 4,4,8 50 %
2019-09-18 07 - 210 : B 2.740 ETH
2019-07-12 07 - 275 : S 63.69 % $575 4,3,7 57 %
2019-05-03 07 - 168 : B 2.093 ETH
2019-04-28 07 - 158 : S 29.51 % $352 3,3,6 50 %
2019-02-15 07 - 122 : B 2.225 ETH
2019-01-10 07 - 125 : SL -6.02 % $271 2,3,5 40 %
2018-12-29 07 - 133 : B 2.172 ETH
2018-05-22 07 - 641 : S 5.95 % $289 2,2,4 50 %
2018-04-21 07 - 605 : B 0.451 ETH
2018-02-02 07 - 922 : S 197.42 % $273 1,2,3 33 %
2017-11-11 07 - 310 : B 0.296 ETH
2017-10-09 07 - 297 : SL -4.50 % $92 0,2,2 0 %
2017-10-07 07 - 311 : B 0.309 ETH
2017-08-22 07 - 310 : SL -4.02 % $96 0,1,1 0 %
2017-08-21 07 - 323 : B 0.310 ETH

CDOI ProfileCumulative Delta of Open Interest Profile
This script lets you visualize where there were Open Interest build-ups and discharges on a price basis.
It only supports pairs where TradingView added the appropriate Open Interest data (at the time of posting that is only Binance and Kraken perpetual contracts)
The script uses my own functions to poll lower timeframe data and compile it into a higher timeframe profile. And as such, it needs some tweaking to adjust it to your timeframe until Tradingview lets me do it codewise (hopefully one day)
The instructions for using the Indicators are as follows:
Condition: How often a new profile should be generated
Sampling Rate and 1/Nth of the TF: These have to be calculated together to have a product that should correspond to the current timeframe in minutes. A few examples below
----------- Sampling - 1Nth of the TF
5 min ------- 5 --------------- 1
10 min ------ 10 ------------- 1
15 min ------ 5 --------------- 3
20 min ------ 10 ------------- 2
30 min ------ 10 -------------- 3
45 min ------- 9 -------------- 5
1 hour ------- 10 ------------- 6
4 hours ----- 10 -------------- 24
1 day -------- 10 ------------- 144
Transparency: This one is pretty self-explanatory but only applies to the Profile bars
% change for a bar: This one indicates how precise each bar will be, but if you go too low the script becomes too heavy and stop running
Bar limit: Limits the amounts of bars the script is run for (ae for the last 1000 bars). Lower = faster loading, too high will stop running
UI color: Color and transparency of the center line and the box surrounding the whole profile

EMA with time-interval dependant visiblity settingThis scrip exposes 4 Exponential Moving Average (EMA) indicators which their visibility can be set to a daily or weekly time-frame (aka intervals). Based on your current chart time-frame, the matching EMA indicators come on and off.
This helps to have meaningful EMAs relevant to your time internal.
In a traditional 10 EMA indicates a plotted indicator would bear a meaning of a 10 day EMA when in daily and 10 week EMA when in weekly chart which may or may not be useful as some who for example only require a 10 week EMA for thier analysis and wouldn't want to cloud a daily chart with an EMA which won't resemble a valuable output for this particular user.
With EMA+, you can choose to see the 10 week EMA only when your chart is in the weekly time interval, so when switched to a daily interval a 10x EMA is not shown anymore.
If you prefer to see a 10 week EMA and a 21 day EMA on the other hand, you will only have 1 EMA shown when in weekly mode which is a 10 week EMA and one EMA when in daily mode with is 21 day EMA.

Cowabunga System from babypips.comPlease do read the information below as well, especially if you are new to Forex.
The Cowabunga System is a type of Mechanical Trading System that filters trades based on the trend of the 4 hour chart with EMAs and some other familiar indicators (RSI, Stochastics and MACD) while entering trades base on 15 minute chart.
I have coded (quite amateurishly) the basic system onto a 15 minute chart (the 4 hour settings are coded as well). The author says the system is to be traded off the 15 minute chart with the 4 hour chart only as a reference for trend direction.
4 Hour Chart Settings
5 EMA
10 EMA
Stochastics (10,3,3)
RSI (9)
Then we move onto the 15 minute chart, where he gives us the trade entry rules.
15 Minute Chart Settings
5 EMA
10 EMA
Stochastics (10,3,3)
RSI (9)
MACD (12,26,9)
Entry Rules - long entry rules used, obviously reverse these for shorting.
1. EMA must cross above the 10 EMA.
2. RSI must be greater than 50 and not overbought.
3. Stochastic must be headed up and not be in overbought territory.
4. MACD histogram must go from negative to positive OR be negative and start to increase in value.
What I did.
1. Set the RSI and Stochastic levels to avoid entries when they indicate overbought conditions for long and oversold conditions for short (80 and 20 levels).
2. Users can input specific times they want to backtest.
3. User's can configure profit targets, trailing stops and stops. Default is set it to was 100 pips profit target with a 40 pip trailing stop. (Note, when you are changing these values, please note that each pip is worth 10, so 100 pips is entered as 1000.)
The Cowabunga System from babypips.com is another popular and active system. The author, Pip Surfer, continues to post wins and losses with this system. It shows there is a lot of honesty and integrity with this system if the author keeps up to date even 10 years later and is not afraid of sharing the times the system causes losses.
As an example of this, here is post he shared just last week . It's almost like a journal, he gives specific times and reasons why he entered, lets the readers know when he was stopped out, etc. I think that what he does is equally important as his system.
To read more about this system, visit the thread on babypips.com, click here.


Hash SupertrendHash Supertrend is a visually enhanced Supertrend-based indicator designed by Hash Capital Research, tuned specifically for crypto trend trading on Solana (SOL) and Bitcoin (BTC). It combines institutional-style color coding, an optional session time filter, and production-ready alerts for systematic and discretionary traders alike.
What This Indicator Is
Hash Supertrend is a trend-following volatility band indicator built on TradingView’s native ta.supertrend() function.
It’s optimized and visually styled for:
High-volatility crypto pairs (especially SOL/USDT, SOL/USD, BTC/USDT, BTC/USD)
Timeframes typically used by crypto traders (from 5m scalping to 4H swing and 1D trend following)
The script is an indicator, not a strategy:
It does not place trades or show backtest results.
It provides clear trend states, flips, and alerts that you can plug into your own execution stack or manual trading.
Key Features
✅ Tuned for Crypto (Solana & Bitcoin)
Parameters are chosen to respond well to the volatility profile of SOL and BTC, reducing noise while still catching strong moves.
✅ Non-repainting Supertrend Core
Uses TradingView’s built-in ta.supertrend — values may move intrabar as the bar forms, but once a bar closes, the historical line and signals do not repaint.
✅ Fluorescent Trend Visualization
Bright green for bullish phases
Bright red for bearish phases
Adaptive color intensity based on user setting
✅ Glow Layer & Trend Zones
Glow effect around the Supertrend line for instant visual recognition
Optional filled zones between price and line for “trend cloud” style visualization
✅ Time Filter (Session Control)
Option to only mark signals during specific hours for those wanting to integrate with webhooks
Designed for traders who avoid certain sessions (e.g., low-liquidity hours)
✅ Signal Dots & Alerts
Tiny green dots for bullish flips
Tiny red dots for bearish flips
Professional, preconfigured alerts for:
Long Entry
Short Entry
Any Trend Change
Filtered signals outside trading hours (for monitoring only)
The core logic is built on:
ATR Length (ATR Length) Default: 16
Lower values (7–10): more sensitive, more signals, more noise
Higher values (12–20): smoother, fewer but stronger trend signals
Factor (Factor) Default: 3.11
Lower values (1.5–2.5): tighter bands, earlier entries, higher whipsaws
Higher values (3.0–4.0+): wider bands, later entries, stronger trend confirmation
The indicator reads direction from ta.supertrend and classifies:
Bullish Trend: direction < 0
Bearish Trend: direction > 0
A trend flip happens when direction changes sign:
longSignal: Supertrend flips from above price to below price (bearish → bullish)
shortSignal: Supertrend flips from below price to above price (bullish → bearish)

Smart RSI MTF Matrix [DotGain]Summary
Are you tired of trading trend signals, only to miss the bigger picture because you are focused on a single timeframe?
The Smart RSI MTF Matrix is the ultimate "Cockpit View" for momentum traders. Unlike chart overlays that can sometimes clutter your price action, this indicator organizes RSI conditions across 10 different timeframes simultaneously into a clean, separate Heatmap pane.
It monitors everything from the 5-minute chart all the way up to the 12-Month view , giving you a complete X-ray vision of the market's momentum structure instantly.
⚙️ Core Components and Logic
The Smart RSI MTF Matrix relies on a sophisticated hierarchy to deliver clear, actionable context:
Multi-Timeframe Engine: The script runs 10 independent RSI calculations in the background, organized in rows from bottom (Short Term) to top (Long Term).
Classic RSI Thresholds:
Overbought (> 70): Indicates price may be extended to the upside.
Oversold (< 30): Indicates price may be extended to the downside.
Smart Visibility System (The "Secret Sauce"): Not all signals are equal. A 5-minute signal is "noise" compared to a Yearly signal. This indicator automatically applies Transparency to differentiate importance. The visibility increases by 10% for each higher timeframe slot (Row).
🚦 How to Read the Matrix
The indicator plots dots in 10 stacked rows. The position and opacity tell you the direction and significance:
🟥 RED DOTS (Overbought Condition)
Trigger: RSI is above 70 on that specific timeframe.
Meaning: Potential bearish reversal or pullback.
🟩 GREEN DOTS (Oversold Condition)
Trigger: RSI is below 30 on that specific timeframe.
Meaning: Potential bullish reversal or bounce.
⚪ GRAY DOTS (Neutral)
Trigger: RSI is between 30 and 70.
Meaning: No extreme momentum present.
👻 TRANSPARENCY (Signal Strength)
The visibility of the dot tells you exactly which Timeframe (Row) is triggered. The higher the row, the more solid the color:
Faint (10-30% Visibility): Rows 1-3 (5m, 15m, 1h). Used for scalping entries.
Medium (40-60% Visibility): Rows 4-6 (4h, 1D, 1W). Used for swing trading context.
Solid (70-100% Visibility): Rows 7-10 (1M, 3M, 6M, 12M). Used for identifying major macro cycles.
Visual Elements
Structure: Row 1 (Bottom) represents the 5-minute timeframe. Row 10 (Top) represents the 12-Month timeframe.
Vertical Alignment: If you see a vertical column of Red or Green dots, it indicates Multi-Timeframe Confluence —a highly probable reversal point.
Key Benefit
The goal of the Smart RSI MTF Matrix is to keep your main chart clean while providing maximum information. You can instantly see if a short-term pullback (Faint Green Dot) is happening within a long-term uptrend (Solid Gray/Red Dot), allowing for precision entries.
Have fun :)
Disclaimer
This "Smart RSI MTF Matrix" indicator is provided for informational and educational purposes only. It does not, and should not be construed as, financial, investment, or trading advice.
The signals generated by this tool (both "Buy" and "Sell" indications) are the result of a specific set of algorithmic conditions. They are not a direct recommendation to buy or sell any asset. All trading and investing in financial markets involves substantial risk of loss. You can lose all of your invested capital.
Past performance is not indicative of future results. The signals generated may produce false or losing trades. The creator (© DotGain) assumes no liability for any financial losses or damages you may incur as a result of using this indicator.
You are solely responsible for your own trading and investment decisions. Always conduct your own research (DYOR) and consider your personal risk tolerance before making any trades.

Stochastic Hash Strat [Hash Capital Research]# Stochastic Hash Strategy by Hash Capital Research
## 🎯 What Is This Strategy?
The **Stochastic Slow Strategy** is a momentum-based trading system that identifies oversold and overbought market conditions to capture mean-reversion opportunities. Think of it as a "buy low, sell high" approach with smart mathematical filters that remove emotion from your trading decisions.
Unlike fast-moving indicators that generate excessive noise, this strategy uses **smoothed stochastic oscillators** to identify only the highest-probability setups when momentum truly shifts.
---
## 💡 Why This Strategy Works
Most traders fail because they:
- **Chase prices** after big moves (buying high, selling low)
- **Overtrade** in choppy, directionless markets
- **Exit too early** or hold losses too long
This strategy solves all three problems:
1. **Entry Discipline**: Only trades when the stochastic oscillator crosses in extreme zones (oversold for longs, overbought for shorts)
2. **Cooldown Filter**: Prevents revenge trading by forcing a waiting period after each trade
3. **Fixed Risk/Reward**: Pre-defined stop-loss and take-profit levels ensure consistent risk management
**The Math Behind It**: The stochastic oscillator measures where the current price sits relative to its recent high-low range. When it's below 25, the market is oversold (time to buy). When above 70, it's overbought (time to sell). The crossover with its moving average confirms momentum is shifting.
---
## 📊 Best Markets & Timeframes
### ⭐ OPTIMAL PERFORMANCE:
**Crude Oil (WTI) - 12H Timeframe**
- **Why it works**: Oil markets have predictable volatility patterns and respect technical levels
**AAVE/USD - 4H to 12H Timeframe**
- **Why it works**: DeFi tokens exhibit strong momentum cycles with clear extremes
### ✅ Also Works Well On:
- **BTC/USD** (12H, Daily) - Lower frequency but high win rate
- **ETH/USD** (8H, 12H) - Balanced volatility and liquidity
- **Gold (XAU/USD)** (Daily) - Classic mean-reversion asset
- **EUR/USD** (4H, 8H) - Lower volatility, requires patience
### ❌ Avoid Using On:
- Timeframes below 4H (too much noise)
- Low-liquidity altcoins (wide spreads kill performance)
- Strongly trending markets without pullbacks (Bitcoin in 2021)
- News-driven instruments during major events
---
## 🎛️ Understanding The Settings
### Core Stochastic Parameters
**Stochastic Length (Default: 16)**
- Controls the lookback period for price comparison
- Lower = faster reactions, more signals (10-14 for volatile markets)
- Higher = smoother signals, fewer trades (16-21 for stable markets)
- **Pro tip**: Use 10 for crypto 4H, 16 for commodities 12H
**Overbought Level (Default: 70)**
- Threshold for short entries
- Lower values (65-70) = more trades, earlier entries
- Higher values (75-80) = fewer but higher-conviction trades
- **Sweet spot**: 70 works for most assets
**Oversold Level (Default: 25)**
- Threshold for long entries
- Higher values (25-30) = more trades, earlier entries
- Lower values (15-20) = fewer but stronger bounce setups
- **Sweet spot**: 20-25 depending on market conditions
**Smooth K & Smooth D (Default: 7 & 3)**
- Additional smoothing to filter out whipsaws
- K=7 makes the indicator slower and more reliable
- D=3 is the signal line that confirms the trend
- **Don't change these unless you know what you're doing**
---
### Risk Management
**Stop Loss % (Default: 2.2%)**
- Automatically exits losing trades
- Should be 1.5x to 2x your average market volatility
- Too tight = death by a thousand cuts
- Too wide = uncontrolled losses
- **Calibration**: Check ATR indicator and set SL slightly above it
**Take Profit % (Default: 7%)**
- Automatically exits winning trades
- Should be 2.5x to 3x your stop loss (reward-to-risk ratio)
- This default gives 7% / 2.2% = 3.18:1 R:R
- **The golden rule**: Never have R:R below 2:1
---
### Trade Filters
**Bar Cooldown Filter (Default: ON, 3 bars)**
- **What it does**: Forces you to wait X bars after closing a trade before entering a new one
- **Why it matters**: Prevents emotional revenge trading and overtrading in choppy markets
- **Settings guide**:
- 3 bars = Standard (good for most cases)
- 5-7 bars = Conservative (oil, slow-moving assets)
- 1-2 bars = Aggressive (only for experienced traders)
**Exit on Opposite Extreme (Default: ON)**
- Closes your long when stochastic hits overbought (and vice versa)
- Acts as an early profit-taking mechanism
- **Leave this ON** unless you're testing other exit strategies
**Divergence Filter (Default: OFF)**
- Looks for price/momentum divergences for additional confirmation
- **When to enable**: Trending markets where you want fewer but higher-quality trades
- **Keep OFF for**: Mean-reverting markets (oil, forex, most of the time)
---
## 🚀 Quick Start Guide
### Step 1: Set Up in TradingView
1. Open TradingView and navigate to your chart
2. Click "Pine Editor" at the bottom
3. Copy and paste the strategy code
4. Click "Add to Chart"
5. The strategy will appear in a separate pane below your price chart
### Step 2: Choose Your Market
**If you're trading Crude Oil:**
- Timeframe: 12H
- Keep all default settings
- Watch for signals during London/NY overlap (8am-11am EST)
**If you're trading AAVE or crypto:**
- Timeframe: 4H or 12H
- Consider these adjustments:
- Stochastic Length: 10-14 (faster)
- Oversold: 20 (more aggressive)
- Take Profit: 8-10% (higher targets)
### Step 3: Wait for Your First Signal
**LONG Entry** (Green circle appears):
- Stochastic crosses up below oversold level (25)
- Price likely near recent lows
- System places limit order at take profit and stop loss
**SHORT Entry** (Red circle appears):
- Stochastic crosses down above overbought level (70)
- Price likely near recent highs
- System places limit order at take profit and stop loss
**EXIT** (Orange circle):
- Position closes either at stop, target, or opposite extreme
- Cooldown period begins
### Step 4: Let It Run
The biggest mistake? **Interfering with the system.**
- Don't close trades early because you're scared
- Don't skip signals because you "have a feeling"
- Don't increase position size after a big win
- Don't revenge trade after a loss
**Follow the system or don't use it at all.**
---
### Important Risks:
1. **Drawdown Pain**: You WILL experience losing streaks of 5-7 trades. This is mathematically normal.
2. **Whipsaw Markets**: Choppy, range-bound conditions can trigger multiple small losses.
3. **Gap Risk**: Overnight gaps can cause your actual fill to be worse than the stop loss.
4. **Slippage**: Real execution prices differ from backtested prices (factor in 0.1-0.2% slippage).
---
## 🔧 Optimization Guide
### When to Adjust Settings:
**Market Volatility Increased?**
- Widen stop loss by 0.5-1%
- Increase take profit proportionally
- Consider increasing cooldown to 5-7 bars
**Getting Too Few Signals?**
- Decrease stochastic length to 10-12
- Increase oversold to 30, decrease overbought to 65
- Reduce cooldown to 2 bars
**Getting Too Many Losses?**
- Increase stochastic length to 18-21 (slower, smoother)
- Enable divergence filter
- Increase cooldown to 5+ bars
- Verify you're on the right timeframe
### A/B Testing Method:
1. **Run default settings for 50 trades** on your chosen market
2. Document: Win rate, profit factor, max drawdown, emotional tolerance
3. **Change ONE variable** (e.g., oversold from 25 to 20)
4. Run another 50 trades
5. Compare results
6. Keep the better version
**Never change multiple settings at once** or you won't know what worked.
---
## 📚 Educational Resources
### Key Concepts to Learn:
**Stochastic Oscillator**
- Developed by George Lane in the 1950s
- Measures momentum by comparing closing price to price range
- Formula: %K = (Close - Low) / (High - Low) × 100
- Similar to RSI but more sensitive to price movements
**Mean Reversion vs. Trend Following**
- This is a **mean reversion** strategy (price returns to average)
- Works best in ranging markets with defined support/resistance
- Fails in strong trending markets (2017 Bitcoin, 2020 Tech stocks)
- Complement with trend filters for better results
**Risk:Reward Ratio**
- The cornerstone of profitable trading
- Winning 40% of trades with 3:1 R:R = profitable
- Winning 60% of trades with 1:1 R:R = breakeven (after fees)
- **This strategy aims for 45% win rate with 2.5-3:1 R:R**
### Recommended Reading:
- *"Trading Systems and Methods"* by Perry Kaufman (Chapter on Oscillators)
- *"Mean Reversion Trading Systems"* by Howard Bandy
- *"The New Trading for a Living"* by Dr. Alexander Elder
---
## 🛠️ Troubleshooting
### "I'm not seeing any signals!"
**Check:**
- Is your timeframe 4H or higher?
- Is the stochastic actually reaching extreme levels (check if your asset is stuck in middle range)?
- Is cooldown still active from a previous trade?
- Are you on a low-liquidity pair?
**Solution**: Switch to a more volatile asset or lower the overbought/oversold thresholds.
---
### "The strategy keeps losing money!"
**Check:**
- What's your win rate? (Below 35% is concerning)
- What's your profit factor? (Below 0.8 means serious issues)
- Are you trading during major news events?
- Is the market in a strong trend?
**Solution**:
1. Verify you're using recommended markets/timeframes
2. Increase cooldown period to avoid choppy markets
3. Reduce position size to 5% while you diagnose
4. Consider switching to daily timeframe for less noise
---
### "My stop losses keep getting hit!"
**Check:**
- Is your stop loss tighter than the average ATR?
- Are you trading during high-volatility sessions?
- Is slippage eating into your buffer?
**Solution**:
1. Calculate the 14-period ATR
2. Set stop loss to 1.5x the ATR value
3. Avoid trading right after market open or major news
4. Factor in 0.2% slippage for crypto, 0.1% for oil
---
## 💪 Pro Tips from the Trenches
### Psychological Discipline
**The Three Deadly Sins:**
1. **Skipping signals** - "This one doesn't feel right"
2. **Early exits** - "I'll just take profit here to be safe"
3. **Revenge trading** - "I need to make back that loss NOW"
**The Solution:** Treat your strategy like a business system. Would McDonald's skip making fries because the cashier "doesn't feel like it today"? No. Systems work because of consistency.
---
### Position Management
**Scaling In/Out** (Advanced)
- Enter 50% position at signal
- Add 50% if stochastic reaches 10 (oversold) or 90 (overbought)
- Exit 50% at 1.5x take profit, let the rest run
**This is NOT for beginners.** Master the basic system first.
---
### Market Awareness
**Oil Traders:**
- OPEC meetings = volatility spikes (avoid or widen stops)
- US inventory reports (Wed 10:30am EST) = avoid trading 2 hours before/after
- Summer driving season = different patterns than winter
**Crypto Traders:**
- Monday-Tuesday = typically lower volatility (fewer signals)
- Thursday-Sunday = higher volatility (more signals)
- Avoid trading during exchange maintenance windows
---
## ⚖️ Legal Disclaimer
This trading strategy is provided for **educational purposes only**.
- Past performance does not guarantee future results
- Trading involves substantial risk of loss
- Only trade with capital you can afford to lose
- No one associated with this strategy is a licensed financial advisor
- You are solely responsible for your trading decisions
**By using this strategy, you acknowledge that you understand and accept these risks.**
---
## 🙏 Acknowledgments
Strategy development inspired by:
- George Lane's original Stochastic Oscillator work
- Modern quantitative trading research
- Community feedback from hundreds of backtests
Built with ❤️ for retail traders who want systematic, disciplined approaches to the markets.
---
**Good luck, stay disciplined, and trade the system, not your emotions.**

Static K-means Clustering | InvestorUnknownStatic K-Means Clustering is a machine-learning-driven market regime classifier designed for traders who want a data-driven structure instead of subjective indicators or manually drawn zones.
This script performs offline (static) K-means training on your chosen historical window. Using four engineered features:
RSI (Momentum)
CCI (Price deviation / Mean reversion)
CMF (Money flow / Strength)
MACD Histogram (Trend acceleration)
It groups past market conditions into K distinct clusters (regimes). After training, every new bar is assigned to the nearest cluster via Euclidean distance in 4-dimensional standardized feature space.
This allows you to create models like:
Regime-based long/short filters
Volatility phase detectors
Trend vs. chop separation
Mean-reversion vs. breakout classification
Volume-enhanced money-flow regime shifts
Full machine-learning trading systems based solely on regimes
Note:
This script is not a universal ML strategy out of the box.
The user must engineer the feature set to match their trading style and target market.
K-means is a tool, not a ready made system, this script provides the framework.
Core Idea
K-means clustering takes raw, unlabeled market observations and attempts to discover structure by grouping similar bars together.
// STEP 1 — DATA POINTS ON A COORDINATE PLANE
// We start with raw, unlabeled data scattered in 2D space (x/y).
// At this point, nothing is grouped—these are just observations.
// K-means will try to discover structure by grouping nearby points.
//
// y ↑
// |
// 12 | •
// | •
// 10 | •
// | •
// 8 | • •
// |
// 6 | •
// |
// 4 | •
// |
// 2 |______________________________________________→ x
// 2 4 6 8 10 12 14
//
//
//
// STEP 2 — RANDOMLY PLACE INITIAL CENTROIDS
// The algorithm begins by placing K centroids at random positions.
// These centroids act as the temporary “representatives” of clusters.
// Their starting positions heavily influence the first assignment step.
//
// y ↑
// |
// 12 | •
// | •
// 10 | • C2 ×
// | •
// 8 | • •
// |
// 6 | C1 × •
// |
// 4 | •
// |
// 2 |______________________________________________→ x
// 2 4 6 8 10 12 14
//
//
//
// STEP 3 — ASSIGN POINTS TO NEAREST CENTROID
// Each point is compared to all centroids.
// Using simple Euclidean distance, each point joins the cluster
// of the centroid it is closest to.
// This creates a temporary grouping of the data.
//
// (Coloring concept shown using labels)
//
// - Points closer to C1 → Cluster 1
// - Points closer to C2 → Cluster 2
//
// y ↑
// |
// 12 | 2
// | 1
// 10 | 1 C2 ×
// | 2
// 8 | 1 2
// |
// 6 | C1 × 2
// |
// 4 | 1
// |
// 2 |______________________________________________→ x
// 2 4 6 8 10 12 14
//
// (1 = assigned to Cluster 1, 2 = assigned to Cluster 2)
// At this stage, clusters are formed purely by distance.
Your chosen historical window becomes the static training dataset , and after fitting, the centroids never change again.
This makes the model:
Predictable
Repeatable
Consistent across backtests
Fast for live use (no recalculation of centroids every bar)
Static Training Window
You select a period with:
Training Start
Training End
Only bars inside this range are used to fit the K-means model. This window defines:
the market regime examples
the statistical distributions (means/std) for each feature
how the centroids will be positioned post-trainin
Bars before training = fully transparent
Training bars = gray
Post-training bars = full colored regimes
Feature Engineering (4D Input Vector)
Every bar during training becomes a 4-dimensional point:
This combination balances: momentum, volatility, mean-reversion, trend acceleration giving the algorithm a richer "market fingerprint" per bar.
Standardization
To prevent any feature from dominating due to scale differences (e.g., CMF near zero vs CCI ±200), all features are standardized:
standardize(value, mean, std) =>
(value - mean) / std
Centroid Initialization
Centroids start at diverse coordinates using various curves:
linear
sinusoidal
sign-preserving quadratic
tanh compression
init_centroids() =>
// Spread centroids across using different shapes per feature
for c = 0 to k_clusters - 1
frac = k_clusters == 1 ? 0.0 : c / (k_clusters - 1.0) // 0 → 1
v = frac * 2 - 1 // -1 → +1
array.set(cent_rsi, c, v) // linear
array.set(cent_cci, c, math.sin(v)) // sinusoidal
array.set(cent_cmf, c, v * v * (v < 0 ? -1 : 1)) // quadratic sign-preserving
array.set(cent_mac, c, tanh(v)) // compressed
This makes initial cluster spread “random” even though true randomness is hardly achieved in pinescript.
K-Means Iterative Refinement
The algorithm repeats these steps:
(A) Assignment Step, Each bar is assigned to the nearest centroid via Euclidean distance in 4D:
distance = sqrt(dx² + dy² + dz² + dw²)
(B) Update Step, Centroids update to the mean of points assigned to them. This repeats iterations times (configurable).
LIVE REGIME CLASSIFICATION
After training, each new bar is:
Standardized using the training mean/std
Compared to all centroids
Assigned to the nearest cluster
Bar color updates based on cluster
No re-training occurs. This ensures:
No lookahead bias
Clean historical testing
Stable regimes over time
CLUSTER BEHAVIOR & TRADING LOGIC
Clusters (0, 1, 2, 3…) hold no inherent meaning. The user defines what each cluster does.
Example of custom actions:
Cluster 0 → Cash
Cluster 1 → Long
Cluster 2 → Short
Cluster 3+ → Cash (noise regime)
This flexibility means:
One trader might have cluster 0 as consolidation.
Another might repurpose it as a breakout-loading zone.
A third might ignore 3 clusters entirely.
Example on ETHUSD
Important Note:
Any change of parameters or chart timeframe or ticker can cause the “order” of clusters to change
The script does NOT assume any cluster equals any actionable bias, user decides.
PERFORMANCE METRICS & ROC TABLE
The indicator computes average 1-bar ROC for each cluster in:
Training set
Test (live) set
This helps measure:
Cluster profitability consistency
Regime forward predictability
Whether a regime is noise, trend, or reversion-biased
EQUITY SIMULATION & FEES
Designed for close-to-close realistic backtesting.
Position = cluster of previous bar
Fees applied only on regime switches. Meaning:
Staying long → no fee
Switching long→short → fee applied
Switching any→cash → fee applied
Fee input is percentage, but script already converts internally.
Disclaimers
⚠️ This indicator uses machine-learning but does not predict the future. It classifies similarity to past regimes, nothing more.
⚠️ Backtest results are not indicative of future performance.
⚠️ Clusters have no inherent “bullish” or “bearish” meaning. You must interpret them based on your testing and your own feature engineering.
