SuperTrend AI Oscillator StrategySuperTrend AI Oscillator Strategy
Overview
This strategy is a trend-following approach that combines the SuperTrend indicator with oscillator-based filtering.
By identifying market trends while utilizing oscillator-based momentum analysis, it aims to improve entry precision.
Additionally, it incorporates a trailing stop to strengthen risk management while maximizing profits.
This strategy can be applied to various markets, including Forex, Crypto, and Stocks, as well as different timeframes. However, its effectiveness varies depending on market conditions, so thorough testing is required.
Features
1️⃣ Trend Identification Using SuperTrend
The SuperTrend indicator (a volatility-adjusted trend indicator based on ATR) is used to determine trend direction.
A long entry is considered when SuperTrend turns bullish.
A short entry is considered when SuperTrend turns bearish.
The goal is to capture clear trend reversals and avoid unnecessary trades in ranging markets.
2️⃣ Entry Filtering with an Oscillator
The Super Oscillator is used to filter entry signals.
If the oscillator exceeds 50, it strengthens long entries (indicating strong bullish momentum).
If the oscillator drops below 50, it strengthens short entries (indicating strong bearish momentum).
This filter helps reduce trades in uncertain market conditions and improves entry accuracy.
3️⃣ Risk Management with a Trailing Stop
Instead of a fixed stop loss, a SuperTrend-based trailing stop is implemented.
The stop level adjusts automatically based on market volatility.
This allows profits to run while managing downside risk effectively.
4️⃣ Adjustable Risk-Reward Ratio
The default risk-reward ratio is set at 1:2.
Example: A 1% stop loss corresponds to a 2% take profit target.
The ratio can be customized according to the trader’s risk tolerance.
5️⃣ Clear Trade Signals & Visual Support
Green "BUY" labels indicate long entry signals.
Red "SELL" labels indicate short entry signals.
The Super Oscillator is plotted in a separate subwindow to visually assess trend strength.
A real-time trailing stop is displayed to support exit strategies.
These visual aids make it easier to identify entry and exit points.
Trading Parameters & Considerations
Initial Account Balance: Default is $7,000 (adjustable).
Base Currency: USD
Order Size: 10,000 USD
Pyramiding: 1
Trading Fees: $0.94 per trade
Long Position Margin: 50%
Short Position Margin: 50%
Total Trades (M5 Timeframe): 1,032
Visual Aids for Clarity
This strategy includes clear visual trade signals to enhance decision-making:
Green "BUY" labels for long entries
Red "SELL" labels for short entries
Super Oscillator plotted in a subwindow with a 50 midline
Dynamic trailing stop displayed for real-time trend tracking
These visual aids allow traders to quickly identify trade setups and manage positions with greater confidence.
Summary
The SuperTrend AI Oscillator Strategy is developed based on indicators from Black Cat and LuxAlgo.
By integrating high-precision trend analysis with AI-based oscillator filtering, it provides a strong risk-managed trading approach.
Important Notes
This strategy does not guarantee profits—performance varies based on market conditions.
Past performance does not guarantee future results. Markets are constantly changing.
Always test extensively with backtesting and demo trading before using it in live markets.
Risk management, position sizing, and market conditions should always be considered when trading.
Conclusion
This strategy combines trend analysis with momentum filtering, enhancing risk management in trading.
By following market trends carefully, making precise entries, and using trailing stops, it seeks to reduce risk while maximizing potential profits.
Before using this strategy, be sure to test it thoroughly via backtesting and demo trading, and adjust the settings to match your trading style.
在腳本中搜尋"backtesting"

MACD Volume Strategy for XAUUSD (15m) [PineIndicators]The MACD Volume Strategy is a momentum-based trading system designed for XAUUSD on the 15-minute timeframe. It integrates two key market indicators: the Moving Average Convergence Divergence (MACD) and a volume-based oscillator to identify strong trend shifts and confirm trade opportunities. This strategy uses dynamic position sizing, incorporates leverage customization, and applies structured entry and exit conditions to improve risk management.
⚙️ Core Strategy Components
1️⃣ Volume-Based Momentum Calculation
The strategy includes a custom volume oscillator to filter trade signals based on market activity. The oscillator is derived from the difference between short-term and long-term volume trends using Exponential Moving Averages (EMAs)
Short EMA (default = 5) represents recent volume activity.
Long EMA (default = 8) captures broader volume trends.
Positive values indicate rising volume, supporting momentum-based trades.
Negative values suggest weak market activity, reducing signal reliability.
By requiring positive oscillator values, the strategy ensures momentum confirmation before entering trades.
2️⃣ MACD Trend Confirmation
The strategy uses the MACD indicator as a trend filter. The MACD is calculated as:
Fast EMA (16-period) detects short-term price trends.
Slow EMA (26-period) smooths out price fluctuations to define the overall trend.
Signal Line (9-period EMA) helps identify crossovers, signaling potential trend shifts.
Histogram (MACD – Signal) visualizes trend strength.
The system generates trade signals based on MACD crossovers around the zero line, confirming bullish or bearish trend shifts.
📌 Trade Logic & Conditions
🔹 Long Entry Conditions
A buy signal is triggered when all the following conditions are met:
✅ MACD crosses above 0, signaling bullish momentum.
✅ Volume oscillator is positive, confirming increased trading activity.
✅ Current volume is at least 50% of the previous candle’s volume, ensuring market participation.
🔻 Short Entry Conditions
A sell signal is generated when:
✅ MACD crosses below 0, indicating bearish momentum.
✅ Volume oscillator is positive, ensuring market activity is sufficient.
✅ Current volume is less than 50% of the previous candle’s volume, showing decreasing participation.
This multi-factor approach filters out weak or false signals, ensuring that trades align with both momentum and volume dynamics.
📏 Position Sizing & Leverage
Dynamic Position Calculation:
Qty = strategy.equity × leverage / close price
Leverage: Customizable (default = 1x), allowing traders to adjust risk exposure.
Adaptive Sizing: The strategy scales position sizes based on account equity and market price.
Slippage & Commission: Built-in slippage (2 points) and commission (0.01%) settings provide realistic backtesting results.
This ensures efficient capital allocation, preventing overexposure in volatile conditions.
🎯 Trade Management & Exits
Take Profit & Stop Loss Mechanism
Each position includes predefined profit and loss targets:
Take Profit: +10% of risk amount.
Stop Loss: Fixed at 10,100 points.
The risk-reward ratio remains balanced, aiming for controlled drawdowns while maximizing trade potential.
Visual Trade Tracking
To improve trade analysis, the strategy includes:
📌 Trade Markers:
"Buy" label when a long position opens.
"Close" label when a position exits.
📌 Trade History Boxes:
Green for profitable trades.
Red for losing trades.
📌 Horizontal Trade Lines:
Shows entry and exit prices.
Helps identify trend movements over multiple trades.
This structured visualization allows traders to analyze past performance directly on the chart.
⚡ How to Use This Strategy
1️⃣ Apply the script to a XAUUSD (Gold) 15m chart in TradingView.
2️⃣ Adjust leverage settings as needed.
3️⃣ Enable backtesting to assess past performance.
4️⃣ Monitor volume and MACD conditions to understand trade triggers.
5️⃣ Use the visual trade markers to review historical performance.
The MACD Volume Strategy is designed for short-term trading, aiming to capture momentum-driven opportunities while filtering out weak signals using volume confirmation.

MTF Signal XpertMTF Signal Xpert – Detailed Description
Overview:
MTF Signal Xpert is a proprietary, open‑source trading signal indicator that fuses multiple technical analysis methods into one cohesive strategy. Developed after rigorous backtesting and extensive research, this advanced tool is designed to deliver clear BUY and SELL signals by analyzing trend, momentum, and volatility across various timeframes. Its integrated approach not only enhances signal reliability but also incorporates dynamic risk management, helping traders protect their capital while navigating complex market conditions.
Detailed Explanation of How It Works:
Trend Detection via Moving Averages
Dual Moving Averages:
MTF Signal Xpert computes two moving averages—a fast MA and a slow MA—with the flexibility to choose from Simple (SMA), Exponential (EMA), or Hull (HMA) methods. This dual-MA system helps identify the prevailing market trend by contrasting short-term momentum with longer-term trends.
Crossover Logic:
A BUY signal is initiated when the fast MA crosses above the slow MA, coupled with the condition that the current price is above the lower Bollinger Band. This suggests that the market may be emerging from a lower price region. Conversely, a SELL signal is generated when the fast MA crosses below the slow MA and the price is below the upper Bollinger Band, indicating potential bearish pressure.
Recent Crossover Confirmation:
To ensure that signals reflect current market dynamics, the script tracks the number of bars since the moving average crossover event. Only crossovers that occur within a user-defined “candle confirmation” period are considered, which helps filter out outdated signals and improves overall signal accuracy.
Volatility and Price Extremes with Bollinger Bands
Calculation of Bands:
Bollinger Bands are calculated using a 20‑period simple moving average as the central basis, with the upper and lower bands derived from a standard deviation multiplier. This creates dynamic boundaries that adjust according to recent market volatility.
Signal Reinforcement:
For BUY signals, the condition that the price is above the lower Bollinger Band suggests an undervalued market condition, while for SELL signals, the price falling below the upper Bollinger Band reinforces the bearish bias. This volatility context adds depth to the moving average crossover signals.
Momentum Confirmation Using Multiple Oscillators
RSI (Relative Strength Index):
The RSI is computed over 14 periods to determine if the market is in an overbought or oversold state. Only readings within an optimal range (defined by user inputs) validate the signal, ensuring that entries are made during balanced conditions.
MACD (Moving Average Convergence Divergence):
The MACD line is compared with its signal line to assess momentum. A bullish scenario is confirmed when the MACD line is above the signal line, while a bearish scenario is indicated when it is below, thus adding another layer of confirmation.
Awesome Oscillator (AO):
The AO measures the difference between short-term and long-term simple moving averages of the median price. Positive AO values support BUY signals, while negative values back SELL signals, offering additional momentum insight.
ADX (Average Directional Index):
The ADX quantifies trend strength. MTF Signal Xpert only considers signals when the ADX value exceeds a specified threshold, ensuring that trades are taken in strongly trending markets.
Optional Stochastic Oscillator:
An optional stochastic oscillator filter can be enabled to further refine signals. It checks for overbought conditions (supporting SELL signals) or oversold conditions (supporting BUY signals), thus reducing ambiguity.
Multi-Timeframe Verification
Higher Timeframe Filter:
To align short-term signals with broader market trends, the script calculates an EMA on a higher timeframe as specified by the user. This multi-timeframe approach helps ensure that signals on the primary chart are consistent with the overall trend, thereby reducing false signals.
Dynamic Risk Management with ATR
ATR-Based Calculations:
The Average True Range (ATR) is used to measure current market volatility. This value is multiplied by a user-defined factor to dynamically determine stop loss (SL) and take profit (TP) levels, adapting to changing market conditions.
Visual SL/TP Markers:
The calculated SL and TP levels are plotted on the chart as distinct colored dots, enabling traders to quickly identify recommended exit points.
Optional Trailing Stop:
An optional trailing stop feature is available, which adjusts the stop loss as the trade moves favorably, helping to lock in profits while protecting against sudden reversals.
Risk/Reward Ratio Calculation:
MTF Signal Xpert computes a risk/reward ratio based on the dynamic SL and TP levels. This quantitative measure allows traders to assess whether the potential reward justifies the risk associated with a trade.
Condition Weighting and Signal Scoring
Binary Condition Checks:
Each technical condition—ranging from moving average crossovers, Bollinger Band positioning, and RSI range to MACD, AO, ADX, and volume filters—is assigned a binary score (1 if met, 0 if not).
Cumulative Scoring:
These individual scores are summed to generate cumulative bullish and bearish scores, quantifying the overall strength of the signal and providing traders with an objective measure of its viability.
Detailed Signal Explanation:
A comprehensive explanation string is generated, outlining which conditions contributed to the current BUY or SELL signal. This explanation is displayed on an on‑chart dashboard, offering transparency and clarity into the signal generation process.
On-Chart Visualizations and Debug Information
Chart Elements:
The indicator plots all key components—moving averages, Bollinger Bands, SL and TP markers—directly on the chart, providing a clear visual framework for understanding market conditions.
Combined Dashboard:
A dedicated dashboard displays key metrics such as RSI, ADX, and the bullish/bearish scores, alongside a detailed explanation of the current signal. This consolidated view allows traders to quickly grasp the underlying logic.
Debug Table (Optional):
For advanced users, an optional debug table is available. This table breaks down each individual condition, indicating which criteria were met or not met, thus aiding in further analysis and strategy refinement.
Mashup Justification and Originality
MTF Signal Xpert is more than just an aggregation of existing indicators—it is an original synthesis designed to address real-world trading complexities. Here’s how its components work together:
Integrated Trend, Volatility, and Momentum Analysis:
By combining moving averages, Bollinger Bands, and multiple oscillators (RSI, MACD, AO, ADX, and an optional stochastic), the indicator captures diverse market dynamics. Each component reinforces the others, reducing noise and filtering out false signals.
Multi-Timeframe Analysis:
The inclusion of a higher timeframe filter aligns short-term signals with longer-term trends, enhancing overall reliability and reducing the potential for contradictory signals.
Adaptive Risk Management:
Dynamic stop loss and take profit levels, determined using ATR, ensure that the risk management strategy adapts to current market conditions. The optional trailing stop further refines this approach, protecting profits as the market evolves.
Quantitative Signal Scoring:
The condition weighting system provides an objective measure of signal strength, giving traders clear insight into how each technical component contributes to the final decision.
How to Use MTF Signal Xpert:
Input Customization:
Adjust the moving average type and period settings, ATR multipliers, and oscillator thresholds to align with your trading style and the specific market conditions.
Enable or disable the optional stochastic oscillator and trailing stop based on your preference.
Interpreting the Signals:
When a BUY or SELL signal appears, refer to the on‑chart dashboard, which displays key metrics (e.g., RSI, ADX, bullish/bearish scores) along with a detailed breakdown of the conditions that triggered the signal.
Review the SL and TP markers on the chart to understand the associated risk/reward setup.
Risk Management:
Use the dynamically calculated stop loss and take profit levels as guidelines for setting your exit points.
Evaluate the provided risk/reward ratio to ensure that the potential reward justifies the risk before entering a trade.
Debugging and Verification:
Advanced users can enable the debug table to see a condition-by-condition breakdown of the signal generation process, helping refine the strategy and deepen understanding of market dynamics.
Disclaimer:
MTF Signal Xpert is intended for educational and analytical purposes only. Although it is based on robust technical analysis methods and has undergone extensive backtesting, past performance is not indicative of future results. Traders should employ proper risk management and adjust the settings to suit their financial circumstances and risk tolerance.
MTF Signal Xpert represents a comprehensive, original approach to trading signal generation. By blending trend detection, volatility assessment, momentum analysis, multi-timeframe alignment, and adaptive risk management into one integrated system, it provides traders with actionable signals and the transparency needed to understand the logic behind them.

Enhanced Bollinger Bands Strategy with SL/TP// Title: Enhanced Bollinger Bands Strategy with SL/TP
// Description:
// This strategy is based on the classic Bollinger Bands indicator and incorporates Stop Loss (SL) and Take Profit (TP) levels for automated trading. It identifies potential long and short entry points based on price crossing the lower and upper Bollinger Bands, respectively. The strategy allows users to customize several parameters to suit different market conditions and risk tolerances.
// Key Features:
// * **Bollinger Bands:** Uses Simple Moving Average (SMA) as the basis and calculates upper and lower bands based on a user-defined standard deviation multiplier.
// * **Customizable Parameters:** Offers extensive customization, including SMA length, standard deviation multiplier, Stop Loss (SL) in pips, and Take Profit (TP) in pips.
// * **Long/Short Position Control:** Allows users to independently enable or disable long and short positions.
// * **Stop Loss and Take Profit:** Implements Stop Loss and Take Profit levels based on pip values to manage risk and secure profits. Entry prices are set to the band levels on signals.
// * **Visualizations:** Provides options to display Bollinger Bands and entry signals on the chart for easy analysis.
// Strategy Logic:
// 1. **Bollinger Bands Calculation:** The strategy calculates the Bollinger Bands using the specified SMA length and standard deviation multiplier.
// 2. **Entry Conditions:**
// * **Long Entry:** Enters a long position when the closing price crosses above the lower Bollinger Band and the `Enable Long Positions` setting is enabled.
// * **Short Entry:** Enters a short position when the closing price crosses below the upper Bollinger Band and the `Enable Short Positions` setting is enabled.
// 3. **Exit Conditions:**
// * **Stop Loss:** Exits the position if the price reaches the Stop Loss level, calculated based on the input `Stop Loss (Pips)`.
// * **Take Profit:** Exits the position if the price reaches the Take Profit level, calculated based on the input `Take Profit (Pips)`.
// Input Parameters:
// * **SMA Length (length):** The length of the Simple Moving Average used to calculate the Bollinger Bands (default: 20).
// * **Standard Deviation Multiplier (mult):** The multiplier applied to the standard deviation to determine the width of the Bollinger Bands (default: 2.0).
// * **Enable Long Positions (enableLong):** A boolean value to enable or disable long positions (default: true).
// * **Enable Short Positions (enableShort):** A boolean value to enable or disable short positions (default: true).
// * **Pip Value (pipValue):** The value of a pip for the traded instrument. This is crucial for accurate Stop Loss and Take Profit calculations (default: 0.0001 for most currency pairs). **Important: Adjust this value to match the specific instrument you are trading.**
// * **Stop Loss (Pips) (slPips):** The Stop Loss level in pips (default: 10).
// * **Take Profit (Pips) (tpPips):** The Take Profit level in pips (default: 20).
// * **Show Bollinger Bands (showBands):** A boolean value to show or hide the Bollinger Bands on the chart (default: true).
// * **Show Entry Signals (showSignals):** A boolean value to show or hide entry signals on the chart (default: true).
// How to Use:
// 1. Add the strategy to your TradingView chart.
// 2. Adjust the input parameters to optimize the strategy for your chosen instrument and timeframe. Pay close attention to the `Pip Value`.
// 3. Backtest the strategy over different periods to evaluate its performance.
// 4. Use the `Enable Long Positions` and `Enable Short Positions` settings to customize the strategy for specific market conditions (e.g., only long positions in an uptrend).
// Important Notes and Disclaimers:
// * **Backtesting Results:** Past performance is not indicative of future results. Backtesting results can be affected by various factors, including market volatility, slippage, and transaction costs.
// * **Risk Management:** This strategy is provided for informational and educational purposes only and should not be considered financial advice. Always use proper risk management techniques when trading. Adjust Stop Loss and Take Profit levels according to your risk tolerance.
// * **Slippage:** The strategy takes into account slippage by specifying a slippage parameter on the `strategy` declaration. However, real-world slippage may vary.
// * **Market Conditions:** The performance of this strategy can vary significantly depending on market conditions. It may perform well in trending markets but poorly in ranging or choppy markets.
// * **Pip Value Accuracy:** **Ensure the `Pip Value` is correctly set for the specific instrument you are trading. Incorrect pip value will result in incorrect stop loss and take profit placement.** This is critical.
// * **Broker Compatibility:** The strategy's performance may vary depending on your broker's execution policies and fees.
// * **Disclaimer:** I am not a financial advisor, and this script is not financial advice. Use this strategy at your own risk. I am not responsible for any losses incurred while using this strategy.

Bollinger Bounce Reversal Strategy – Visual EditionOverview:
The Bollinger Bounce Reversal Strategy – Visual Edition is designed to capture potential reversal moves at price extremes—often termed “bounce points”—by using a combination of technical indicators. The strategy integrates Bollinger Bands, MACD, and volume analysis, and it provides rich on‑chart visual cues to help traders understand its signals and conditions. Additionally, the strategy enforces a maximum of 5 trades per day and uses fixed risk management parameters. This publication is intended for educational purposes and offers a systematic, transparent approach that you can further adjust to fit your market or risk profile.
How It Works:
Bollinger Bands:
A 20‑period simple moving average (SMA) and a user‑defined standard deviation multiplier (default 2.0) are used to calculate the Bollinger Bands.
When the price reaches or crosses these bands (i.e. falls below the lower band or rises above the upper band), it suggests that the price is in an extreme, potentially oversold or overbought, state.
MACD Filter:
The MACD (calculated with standard lengths, e.g. 12, 26, 9) provides momentum information.
For a bullish (long) signal, the MACD line should be above its signal line; for a bearish (short) signal, the MACD line should be below.
Volume Confirmation:
The strategy uses a 20‑period volume moving average to determine if current volume is strong enough to validate a signal.
A signal is confirmed only if the current volume is at or above a specified multiple (by default, 1.0×) of this moving average, ensuring that the move is supported by increased market participation.
Visual Cues:
Bollinger Bands and Fill: The basis (SMA), upper, and lower Bollinger Bands are plotted, and the area between the upper and lower bands is filled with a semi‑transparent color.
Signal Markers: When a long or short signal is generated, corresponding markers (labels) appear on the chart.
Background Coloring: The chart’s background changes color (green for long signals and red for short signals) on the bars where signals occur.
Information Table: An on‑chart table displays key indicator values (MACD, signal line, volume, average volume) and the number of trades executed that day.
Entry Conditions:
Long Entry:
A long trade is triggered when the previous bar’s close is below the lower Bollinger Band and the current bar’s close crosses above it, combined with a bullish MACD condition and strong volume.
Short Entry:
A short trade is triggered when the previous bar’s close is above the upper Bollinger Band and the current bar’s close crosses below it, with a bearish MACD condition and high volume.
Risk Management:
Daily Trade Limit: The strategy restricts trading to no more than 5 trades per day.
Stop-Loss and Take-Profit:
For each position, a stop loss is set at a fixed percentage away from the entry price (typically 2%), and a take profit is set to target a 1:2 risk-reward ratio (typically 4% from the entry price).
Backtesting Setup:
Initial Capital: $10,000
Commission: 0.1% per trade
Slippage: 1 tick per bar
These realistic parameters help ensure that backtesting results reflect the conditions of an average trader.
Disclaimer:
Past performance is not indicative of future results. This strategy is experimental and provided solely for educational purposes. It is essential to backtest extensively and paper trade before any live deployment. All risk management practices are advisory, and you should adjust parameters to suit your own trading style and risk tolerance.
Conclusion:
By combining Bollinger Bands, MACD, and volume analysis, the Bollinger Bounce Reversal Strategy – Visual Edition provides a clear, systematic method to identify potential reversal opportunities at price extremes. The added visual cues help traders quickly interpret signals and assess market conditions, while strict risk management and a daily trade cap help keep trading disciplined. Adjust and refine the settings as needed to better suit your specific market and risk profile.

Adaptive Trend Flow Strategy with Filters for SPXThe Adaptive Trend Flow Strategy with Filters for SPX is a complete trading algorithm designed to identify traits and offer actionable alerts for the SPX index. This Pine Script approach leverages superior technical signs and user-described parameters to evolve to marketplace conditions and optimize performance.
Key Features and Functionality
Dynamic Trend Detection: Utilizes a dual EMA-based totally adaptive method for fashion calculation.
The script smooths volatility the usage of an EMA filter and adjusts sensitivity through the sensitivity enter. This allows for real-time adaptability to market fluctuations.
Trend Filters for Precision:
SMA Filter: A Simple Moving Average (SMA) guarantees that trades are achieved best while the rate aligns with the shifting average trend, minimizing false indicators.
MACD Filter: The Moving Average Convergence Divergence (MACD) adds some other layer of confirmation with the aid of requiring alignment among the MACD line and its sign line.
Signal Generation:
Long Signals: Triggered when the fashion transitions from bearish to bullish, with all filters confirming the pass.
Short Signals: Triggered while the trend shifts from bullish to bearish, imparting opportunities for final positions.
User Customization:
Adjustable parameters for EMAs, smoothing duration, and sensitivity make certain the strategy can adapt to numerous buying and selling patterns.
Enable or disable filters (SMA or MACD) based totally on particular market conditions or consumer possibilities.
Leverage and Position Sizing: Incorporates a leverage aspect for dynamic position sizing.
Automatically calculates the exchange length based on account fairness and the leverage element, making sure hazard control is in area.
Visual Enhancements: Plots adaptive fashion ranges (foundation, top, decrease) for actual-time insights into marketplace conditions.
Color-coded bars and heritage to visually represent bullish or bearish developments.
Custom labels indicating crossover and crossunder occasions for clean sign visualization.
Alerts and Automation: Configurable alerts for each lengthy and quick indicators, well matched with automated buying and selling structures like plugpine.Com.
JSON-based alert messages consist of account credentials, motion type, and calculated position length for seamless integration.
Backtesting and Realistic Assumptions: Includes practical slippage, commissions, and preliminary capital settings for backtesting accuracy.
Leverages excessive-frequency trade sampling to make certain strong strategy assessment.
How It Works
Trend Calculation: The method derives a principal trend basis with the aid of combining fast and gradual EMAs. It then uses marketplace volatility to calculate adaptive upper and decrease obstacles, creating a dynamic channel.
Filter Integration: SMA and MACD filters work in tandem with the fashion calculation to ensure that handiest excessive-probability signals are accomplished.
Signal Execution: Signals are generated whilst the charge breaches those dynamic tiers and aligns with the fashion and filters, ensuring sturdy change access situations.
How to Use
Setup: Apply the approach to SPX or other well suited indices.
Adjust person inputs, together with ATR length, EMA smoothing, and sensitivity, to align together with your buying and selling possibilities.
Enable or disable the SMA and MACD filters to test unique setups.
Alerts: Configure signals for computerized notifications or direct buying and selling execution through third-celebration systems.
Use the supplied JSON payload to integrate with broking APIs or automation tools.
Optimization:
Experiment with leverage, filter out settings, and sensitivity to find most effective configurations to your hazard tolerance and marketplace situations.
Considerations and Best Practices
Risk Management: Always backtest the method with realistic parameters, together with conservative leverage and commissions.
Market Suitability: While designed for SPX, this method can adapt to other gadgets by means of adjusting key parameters.
Limitations: The method is trend-following and can underperform in enormously risky or ranging markets. Regularly evaluate and modify parameters primarily based on recent market conduct.
If you have any questions please let me know - I'm here to help!

Uptrick: Volatility Reversion BandsUptrick: Volatility Reversion Bands is an indicator designed to help traders identify potential reversal points in the market by combining volatility and momentum analysis within one comprehensive framework. It calculates dynamic bands around a simple moving average and issues signals when price interacts with these bands. Below is a fully expanded description, structured in multiple sections, detailing originality, usefulness, uniqueness, and the purpose behind blending standard deviation-based and ATR-based concepts. All references to code have been removed to focus on the written explanation only.
Section 1: Overview
Uptrick: Volatility Reversion Bands centers on a moving average around which various bands are constructed. These bands respond to changes in price volatility and can help gauge potential overbought or oversold conditions. Signals occur when the price moves beyond certain thresholds, which may imply a reversal or significant momentum shift.
Section 2: Originality, Usefulness, Uniqness, Purpose
This indicator merges two distinct volatility measurements—Bollinger Bands and ATR—into one cohesive system. Bollinger Bands use standard deviation around a moving average, offering a baseline for what is statistically “normal” price movement relative to a recent mean. When price hovers near the upper band, it may indicate overbought conditions, whereas price near the lower band suggests oversold conditions. This straightforward construction often proves invaluable in moderate-volatility settings, as it pinpoints likely turning points and gauges a market’s typical trading range.
Yet Bollinger Bands alone can falter in conditions marked by abrupt volatility spikes or sudden gaps that deviate from recent norms. Intraday news, earnings releases, or macroeconomic data can alter market behavior so swiftly that standard-deviation bands do not keep pace. This is where ATR (Average True Range) adds an important layer. ATR tracks recent highs, lows, and potential gaps to produce a dynamic gauge of how much price is truly moving from bar to bar. In quieter times, ATR contracts, reflecting subdued market activity. In fast-moving markets, ATR expands, exposing heightened volatility on each new bar.
By overlaying Bollinger Bands and ATR-based calculations, the indicator achieves a broader situational awareness. Bollinger Bands excel at highlighting relative overbought or oversold areas tied to an established average. ATR simultaneously scales up or down based on real-time market swings, signaling whether conditions are calm or turbulent. When combined, this means a price that barely crosses the Bollinger Band but also triggers a high ATR-based threshold is likely experiencing a volatility surge that goes beyond typical market fluctuations. Conversely, a price breach of a Bollinger Band when ATR remains low may still warrant attention, but not necessarily the same urgency as in a high-volatility regime.
The resulting synergy offers balanced, context-rich signals. In a strong trend, the ATR layer helps confirm whether an apparent price breakout really has momentum or if it is just a temporary spike. In a range-bound market, standard deviation-based Bollinger Bands define normal price extremes, while ATR-based extensions highlight whether a breakout attempt has genuine force behind it. Traders gain clarity on when a move is both statistically unusual and accompanied by real volatility expansion, thus carrying a higher probability of a directional follow-through or eventual reversion.
Practical advantages emerge across timeframes. Scalpers in fast-paced markets appreciate how ATR-based thresholds update rapidly, revealing if a sudden price push is routine or exceptional. Swing traders can rely on both indicators to filter out false signals in stable conditions or identify truly notable moves. By calibrating to changes in volatility, the merged system adapts naturally whether the market is trending, ranging, or transitioning between these phases.
In summary, combining Bollinger Bands (for a static sense of standard-deviation-based overbought/oversold zones) with ATR (for a dynamic read on current volatility) yields an adaptive, intuitive indicator. Traders can better distinguish fleeting noise from meaningful expansions, enabling more informed entries, exits, and risk management. Instead of relying on a single yardstick for all market conditions, this fusion provides a layered perspective, encouraging traders to interpret price moves in the broader context of changing volatility.
Section 3: Why Bollinger Bands and ATR are combined
Bollinger Bands provide a static snapshot of volatility by computing a standard deviation range above and below a central average. ATR, on the other hand, adapts in real time to expansions or contractions in market volatility. When combined, these measures offset each other’s limitations: Bollinger Bands add structure (overbought and oversold references), and ATR ensures responsiveness to rapid price shifts. This synergy helps reduce noisy signals, particularly during sudden market turbulence or extended consolidations.
Section 4: User Inputs
Traders can adjust several parameters to suit their preferences and strategies. These typically include:
1. Lookback length for calculating the moving average and standard deviation.
2. Multipliers to control the width of Bollinger Bands.
3. An ATR multiplier to set the distance for additional reversal bands.
4. An option to display weaker signals when the price merely approaches but does not cross the outer bands.
Section 5: Main Calculations
At the core of this indicator are four important steps:
1. Calculate a basis using a simple moving average.
2. Derive Bollinger Bands by adding and subtracting a product of the standard deviation and a user-defined multiplier.
3. Compute ATR over the same lookback period and multiply it by the selected factor.
4. Combine ATR-based distance with the Bollinger Bands to set the outer reversal bands, which serve as stronger signal thresholds.
Section 6: Signal Generation
The script interprets meaningful reversal points when the price:
1. Crosses below the lower outer band, potentially highlighting oversold conditions where a bullish reversal may occur.
2. Crosses above the upper outer band, potentially indicating overbought conditions where a bearish reversal may develop.
Section 7: Visualization
The indicator provides visual clarity through labeled signals and color-coded references:
1. Distinct colors for upper and lower reversal bands.
2. Markers that appear above or below bars to denote possible buying or selling signals.
3. A gradient bar color scheme indicating a bar’s position between the lower and upper bands, helping traders quickly see if the price is near either extreme.
Section 8: Weak Signals (Optional)
For those preferring early cues, the script can highlight areas where the price nears the outer bands. When weak signals are enabled:
1. Bars closer to the upper reversal zone receive a subtle marker suggesting a less robust, yet still noteworthy, potential selling area.
2. Bars closer to the lower reversal zone receive a subtle marker suggesting a less robust, yet still noteworthy, potential buying area.
Section 9: Simplicity, Effectiveness, and Lower Timeframes
Although combining standard deviation and ATR involves sophisticated volatility concepts, this indicator is visually straightforward. Reversal bands and gradient-colored bars make it easy to see at a glance when price approaches or crosses a threshold. Day traders operating on lower timeframes benefit from such clarity because it helps filter out minor fluctuations and focus on more meaningful signals.
Section 10: Adaptability across Market Phases
Because both the standard deviation (for Bollinger Bands) and ATR adapt to changing volatility, the indicator naturally adjusts to various environments:
1. Trending: The additional ATR-based outer bands help distinguish between temporary pullbacks and deeper reversals.
2. Ranging: Bollinger Bands often remain narrower, identifying smaller reversals, while the outer ATR bands remain relatively close to the main bands.
Section 11: Reduced Noise in High-Volatility Scenarios
By factoring ATR into the band calculations, the script widens or narrows the thresholds during rapid market fluctuations. This reduces the amount of false triggers typically found in indicators that rely solely on fixed calculations, preventing overreactions to abrupt but short-lived price spikes.
Section 12: Incorporation with Other Technical Tools
Many traders combine this indicator with oscillators such as RSI, MACD, or Stochastic, as well as volume metrics. Overbought or oversold signals in momentum oscillators can provide additional confirmation when price reaches the outer bands, while volume spikes may reinforce the significance of a breakout or potential reversal.
Section 13: Risk Management Considerations
All trading strategies carry risk. This indicator, like any tool, can and does produce losing trades if price unexpectedly reverses again or if broader market conditions shift rapidly. Prudent traders employ protective measures:
1. Stop-loss orders or trailing stops.
2. Position sizing that accounts for market volatility.
3. Diversification across different asset classes when possible.
Section 14: Overbought and Oversold Identification
Standard Bollinger Bands highlight regions where price might be overextended relative to its recent average. The extended ATR-based reversal bands serve as secondary lines of defense, identifying moments when price truly stretches beyond typical volatility bounds.
Section 15: Parameter Customization for Different Needs
Users can tailor the script to their unique preferences:
1. Shorter lookback settings yield faster signals but risk more noise.
2. Higher multipliers spread the bands further apart, filtering out small moves but generating fewer signals.
3. Longer lookback periods smooth out market noise, often leading to more stable but less frequent trading cues.
Section 16: Examples of Different Trading Styles
1. Day Traders: Often reduce the length to capture quick price swings.
2. Swing Traders: May use moderate lengths such as 20 to 50 bars.
3. Position Traders: Might opt for significantly longer settings to detect macro-level reversals.
Section 17: Performance Limitations and Reality Check
No technical indicator is free from false signals. Sudden fundamental news events, extreme sentiment changes, or low-liquidity conditions can render signals less reliable. Backtesting and forward-testing remain essential steps to gauge whether the indicator aligns well with a trader’s timeframe, risk tolerance, and instrument of choice.
Section 18: Merging Volatility and Momentum
A critical uniqueness of this indicator lies in how it merges Bollinger Bands (standard deviation-based) with ATR (pure volatility measure). Bollinger Bands provide a relative measure of price extremes, while ATR dynamically reacts to market expansions and contractions. Together, they offer an enhanced perspective on potential market turns, ideally reducing random noise and highlighting moments where price has traveled beyond typical bounds.
Section 19: Purpose of this Merger
The fundamental purpose behind blending standard deviation measures with real-time volatility data is to accommodate different market behaviors. Static standard deviation alone can underreact or overreact in abnormally volatile conditions. ATR alone lacks a baseline reference to normality. By merging them, the indicator aims to provide:
1. A versatile dynamic range for both typical and extreme moves.
2. A filter against frequent whipsaws, especially in choppy environments.
3. A visual framework that novices and experts can interpret rapidly.
Section 20: Summary and Practical Tips
Uptrick: Volatility Reversion Bands offers a powerful tool for traders looking to combine volatility-based signals with momentum-derived reversals. It emphasizes clarity through color-coded bars, defined reversal zones, and optional weak signal markers. While potentially useful across all major timeframes, it demands ongoing risk management, realistic expectations, and careful study of how signals behave under different market conditions. No indicator serves as a crystal ball, so integrating this script into an overall strategy—possibly alongside volume data, fundamentals, or momentum oscillators—often yields the best results.
Disclaimer and Educational Use
This script is intended for educational and informational purposes. It does not constitute financial advice, nor does it guarantee trading success. Sudden economic events, low-liquidity times, and unexpected market behaviors can all undermine technical signals. Traders should use proper testing procedures (backtesting and forward-testing) and maintain disciplined risk management measures.

EMA RSI Trend Reversal Ver.1Overview:
The EMA RSI Trend Reversal indicator combines the power of two well-known technical indicators—Exponential Moving Averages (EMAs) and the Relative Strength Index (RSI)—to identify potential trend reversal points in the market. The strategy looks for key crossovers between the fast and slow EMAs, and uses the RSI to confirm the strength of the trend. This combination helps to avoid false signals during sideways market conditions.
How It Works:
Buy Signal:
The Fast EMA (9) crosses above the Slow EMA (21), indicating a potential shift from a downtrend to an uptrend.
The RSI is above 50, confirming strong bullish momentum.
Visual Signal: A green arrow below the price bar and a Buy label are plotted on the chart.
Sell Signal:
The Fast EMA (9) crosses below the Slow EMA (21), indicating a potential shift from an uptrend to a downtrend.
The RSI is below 50, confirming weak or bearish momentum.
Visual Signal: A red arrow above the price bar and a Sell label are plotted on the chart.
Key Features:
EMA Crossovers: The Fast EMA crossing above the Slow EMA signals potential buying opportunities, while the Fast EMA crossing below the Slow EMA signals potential selling opportunities.
RSI Confirmation: The RSI helps confirm trend strength—values above 50 indicate bullish momentum, while values below 50 indicate bearish momentum.
Visual Cues: The strategy uses green arrows and red arrows along with Buy and Sell labels for clear visual signals of when to enter or exit trades.
Signal Interpretation:
Green Arrow / Buy Label: The Fast EMA (9) has crossed above the Slow EMA (21), and the RSI is above 50. This is a signal to buy or enter a long position.
Red Arrow / Sell Label: The Fast EMA (9) has crossed below the Slow EMA (21), and the RSI is below 50. This is a signal to sell or exit the long position.
Strategy Settings:
Fast EMA Length: Set to 9 (this determines how sensitive the fast EMA is to recent price movements).
Slow EMA Length: Set to 21 (this smooths out price movements to identify the broader trend).
RSI Length: Set to 14 (default setting to track momentum strength).
RSI Level: Set to 50 (used to confirm the strength of the trend—above 50 for buy signals, below 50 for sell signals).
Risk Management (Optional):
Use take profit and stop loss based on your preferred risk-to-reward ratio. For example, you can set a 2:1 risk-to-reward ratio (2x take profit for every 1x stop loss).
Backtesting and Optimization:
Backtest the strategy on TradingView by opening the Strategy Tester tab. This will allow you to see how the strategy would have performed on historical data.
Optimization: Adjust the EMA lengths, RSI period, and risk-to-reward settings based on your asset and time frame.
Limitations:
False Signals in Sideways Markets: Like any trend-following strategy, this indicator may generate false signals during periods of low volatility or sideways movement.
Not Suitable for All Market Conditions: This indicator performs best in trending markets. It may underperform in choppy or range-bound markets.
Strategy Example:
XRP/USD Example:
If you're trading XRP/USD and the Fast EMA (9) crosses above the Slow EMA (21), while the RSI is above 50, the indicator will signal a Buy.
Conversely, if the Fast EMA (9) crosses below the Slow EMA (21), and the RSI is below 50, the indicator will signal a Sell.
Bitcoin (BTC/USD):
On the BTC/USD chart, when the indicator shows a green arrow and a Buy label, it’s signaling a potential long entry. Similarly, a red arrow and Sell label indicate a short entry or exit from a previous long position.
Summary:
The EMA RSI Trend Reversal Indicator helps traders identify potential trend reversals with clear buy and sell signals based on the EMA crossovers and RSI confirmations. By using green arrows and red arrows, along with Buy and Sell labels, this strategy offers easy-to-understand visual signals for entering and exiting trades. Combine this with effective risk management and backtesting to optimize your trading performance.

MA Deviation Suite [InvestorUnknown]This indicator combines advanced moving average techniques with multiple deviation metrics to offer traders a versatile tool for analyzing market trends and volatility.
Moving Average Types :
SMA, EMA, HMA, DEMA, FRAMA, VWMA: Standard moving averages with different characteristics for smoothing price data.
Corrective MA: This method corrects the MA by considering the variance, providing a more responsive average to price changes.
f_cma(float src, simple int length) =>
ma = ta.sma(src, length)
v1 = ta.variance(src, length)
v2 = math.pow(nz(ma , ma) - ma, 2)
v3 = v1 == 0 or v2 == 0 ? 1 : v2 / (v1 + v2)
var tolerance = math.pow(10, -5)
float err = 1
// Gain Factor
float kPrev = 1
float k = 1
for i = 0 to 5000 by 1
if err > tolerance
k := v3 * kPrev * (2 - kPrev)
err := kPrev - k
kPrev := k
kPrev
ma := nz(ma , src) + k * (ma - nz(ma , src))
Fisher Least Squares MA: Aims to reduce lag by using a Fisher Transform on residuals.
f_flsma(float src, simple int len) =>
ma = src
e = ta.sma(math.abs(src - nz(ma )), len)
z = ta.sma(src - nz(ma , src), len) / e
r = (math.exp(2 * z) - 1) / (math.exp(2 * z) + 1)
a = (bar_index - ta.sma(bar_index, len)) / ta.stdev(bar_index, len) * r
ma := ta.sma(src, len) + a * ta.stdev(src, len)
Sine-Weighted MA & Cosine-Weighted MA: These give more weight to middle bars, creating a smoother curve; Cosine weights are shifted for a different focus.
Deviation Metrics :
Average Absolute Deviation (AAD) and Median Absolute Deviation (MAD): AAD calculates the average of absolute deviations from the MA, offering a measure of volatility. MAD uses the median, which can be less sensitive to outliers.
Standard Deviation (StDev): Measures the dispersion of prices from the mean.
Average True Range (ATR): Reflects market volatility by considering the day's range.
Average Deviation (adev): The average of previous deviations.
// Calculate deviations
float aad = f_aad(src, dev_len, ma) * dev_mul
float mad = f_mad(src, dev_len, ma) * dev_mul
float stdev = ta.stdev(src, dev_len) * dev_mul
float atr = ta.atr(dev_len) * dev_mul
float avg_dev = math.avg(aad, mad, stdev, atr)
// Calculated Median with +dev and -dev
float aad_p = ma + aad
float aad_m = ma - aad
float mad_p = ma + mad
float mad_m = ma - mad
float stdev_p = ma + stdev
float stdev_m = ma - stdev
float atr_p = ma + atr
float atr_m = ma - atr
float adev_p = ma + avg_dev
float adev_m = ma - avg_dev
// upper and lower
float upper = f_max4(aad_p, mad_p, stdev_p, atr_p)
float upper2 = f_min4(aad_p, mad_p, stdev_p, atr_p)
float lower = f_min4(aad_m, mad_m, stdev_m, atr_m)
float lower2 = f_max4(aad_m, mad_m, stdev_m, atr_m)
Determining Trend
The indicator generates trend signals by assessing where price stands relative to these deviation-based lines. It assigns a trend score by summing individual signals from each deviation measure. For instance, if price crosses above the MAD-based upper line, it contributes a bullish point; crossing below an ATR-based lower line contributes a bearish point.
When the aggregated trend score crosses above zero, it suggests a shift towards a bullish environment; crossing below zero indicates a bearish bias.
// Define Trend scores
var int aad_t = 0
if ta.crossover(src, aad_p)
aad_t := 1
if ta.crossunder(src, aad_m)
aad_t := -1
var int mad_t = 0
if ta.crossover(src, mad_p)
mad_t := 1
if ta.crossunder(src, mad_m)
mad_t := -1
var int stdev_t = 0
if ta.crossover(src, stdev_p)
stdev_t := 1
if ta.crossunder(src, stdev_m)
stdev_t := -1
var int atr_t = 0
if ta.crossover(src, atr_p)
atr_t := 1
if ta.crossunder(src, atr_m)
atr_t := -1
var int adev_t = 0
if ta.crossover(src, adev_p)
adev_t := 1
if ta.crossunder(src, adev_m)
adev_t := -1
int upper_t = src > upper ? 3 : 0
int lower_t = src < lower ? 0 : -3
int upper2_t = src > upper2 ? 1 : 0
int lower2_t = src < lower2 ? 0 : -1
float trend = aad_t + mad_t + stdev_t + atr_t + adev_t + upper_t + lower_t + upper2_t + lower2_t
var float sig = 0
if ta.crossover(trend, 0)
sig := 1
else if ta.crossunder(trend, 0)
sig := -1
Backtesting and Performance Metrics
The code integrates with a backtesting library that allows traders to:
Evaluate the strategy historically
Compare the indicator’s signals with a simple buy-and-hold approach
Generate performance metrics (e.g., mean returns, Sharpe Ratio, Sortino Ratio) to assess historical effectiveness.
Practical Usage and Calibration
Default settings are not optimized: The given parameters serve as a starting point for demonstration. Users should adjust:
len: Affects how smooth and lagging the moving average is.
dev_len and dev_mul: Influence the sensitivity of the deviation measures. Larger multipliers widen the bands, potentially reducing false signals but introducing more lag. Smaller multipliers tighten the bands, producing quicker signals but potentially more whipsaws.
This flexibility allows the trader to tailor the indicator for various markets (stocks, forex, crypto) and time frames.
Disclaimer
No guaranteed results: Historical performance does not guarantee future outcomes. Market conditions can vary widely.
User responsibility: Traders should combine this indicator with other forms of analysis, appropriate risk management, and careful calibration of parameters.

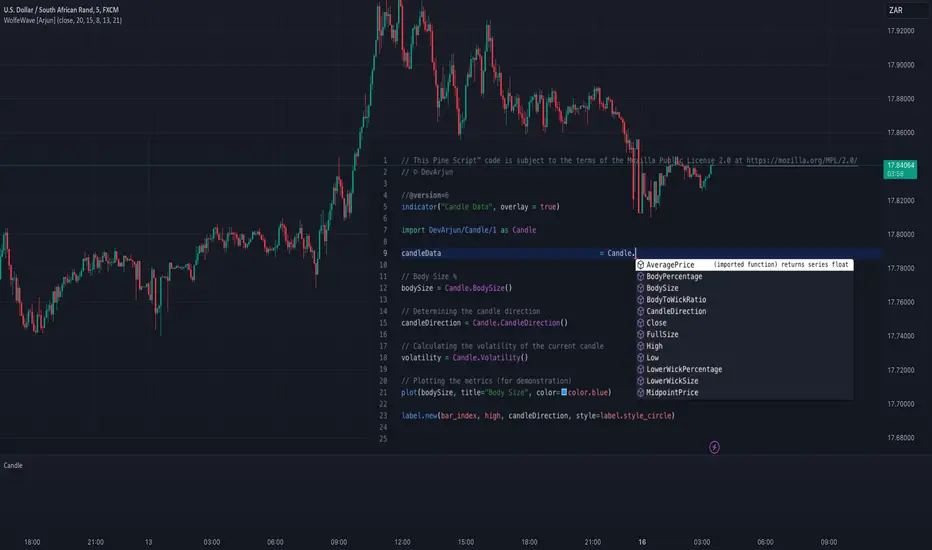
CandleCandle: A Comprehensive Pine Script™ Library for Candlestick Analysis
Overview
The Candle library, developed in Pine Script™, provides traders and developers with a robust toolkit for analyzing candlestick data. By offering easy access to fundamental candlestick components like open, high, low, and close prices, along with advanced derived metrics such as body-to-wick ratios, percentage calculations, and volatility analysis, this library enables detailed insights into market behavior.
This library is ideal for creating custom indicators, trading strategies, and backtesting frameworks, making it a powerful resource for any Pine Script™ developer.
Key Features
1. Core Candlestick Data
• Open : Access the opening price of the current candle.
• High : Retrieve the highest price.
• Low : Retrieve the lowest price.
• Close : Access the closing price.
2. Candle Metrics
• Full Size : Calculates the total range of the candle (high - low).
• Body Size : Computes the size of the candle’s body (open - close).
• Wick Size : Provides the combined size of the upper and lower wicks.
3. Wick and Body Ratios
• Upper Wick Size and Lower Wick Size .
• Body-to-Wick Ratio and Wick-to-Body Ratio .
4. Percentage Calculations
• Upper Wick Percentage : The proportion of the upper wick size relative to the full candle size.
• Lower Wick Percentage : The proportion of the lower wick size relative to the full candle size.
• Body Percentage and Wick Percentage relative to the candle’s range.
5. Candle Direction Analysis
• Determines if a candle is "Bullish" or "Bearish" based on its closing and opening prices.
6. Price Metrics
• Average Price : The mean of the open, high, low, and close prices.
• Midpoint Price : The midpoint between the high and low prices.
7. Volatility Measurement
• Calculates the standard deviation of the OHLC prices, providing a volatility metric for the current candle.
Code Architecture
Example Functionality
The library employs a modular structure, exporting various functions that can be used independently or in combination. For instance:
// This Pine Script™ code is subject to the terms of the Mozilla Public License 2.0 at mozilla.org
// © DevArjun
//@version=6
indicator("Candle Data", overlay = true)
import DevArjun/Candle/1 as Candle
// Body Size %
bodySize = Candle.BodySize()
// Determining the candle direction
candleDirection = Candle.CandleDirection()
// Calculating the volatility of the current candle
volatility = Candle.Volatility()
// Plotting the metrics (for demonstration)
plot(bodySize, title="Body Size", color=color.blue)
label.new(bar_index, high, candleDirection, style=label.style_circle)
Scalability
The modularity of the Candle library allows seamless integration into more extensive trading systems. Functions can be mixed and matched to suit specific analytical or strategic needs.
Use Cases
Trading Strategies
Developers can use the library to create strategies based on candle properties such as:
• Identifying long-bodied candles (momentum signals).
• Detecting wicks as potential reversal zones.
• Filtering trades based on candle ratios.
Visualization
Plotting components like body size, wick size, and directional labels helps visualize market behavior and identify patterns.
Backtesting
By incorporating volatility and ratio metrics, traders can design and test strategies on historical data, ensuring robust performance before live trading.
Education
This library is a great tool for teaching candlestick analysis and how each component contributes to market behavior.
Portfolio Highlights
Project Objective
To create a Pine Script™ library that simplifies candlestick analysis by providing comprehensive metrics and insights, empowering traders and developers with advanced tools for market analysis.
Development Challenges and Solutions
• Challenge : Achieving high precision in calculating ratios and percentages.
• Solution : Implemented robust mathematical operations and safeguarded against division-by-zero errors.
• Challenge : Ensuring modularity and scalability.
• Solution : Designed functions as independent modules, allowing flexible integration.
Impact
• Efficiency : The library reduces the time required to calculate complex candlestick metrics.
• Versatility : Supports various trading styles, from scalping to swing trading.
• Clarity : Clean code and detailed documentation ensure usability for developers of all levels.
Conclusion
The Candle library exemplifies the power of Pine Script™ in simplifying and enhancing candlestick analysis. By including this project in your portfolio, you showcase your expertise in:
• Financial data analysis.
• Pine Script™ development.
• Creating tools that solve real-world trading challenges.
This project demonstrates both technical proficiency and a keen understanding of market analysis, making it an excellent addition to your professional portfolio.
Library "Candle"
A comprehensive library to access and analyze the basic components of a candlestick, including open, high, low, close prices, and various derived metrics such as full size, body size, wick sizes, ratios, percentages, and additional analysis metrics.
Open()
Open
@description Returns the opening price of the current candle.
Returns: float - The opening price of the current candle.
High()
High
@description Returns the highest price of the current candle.
Returns: float - The highest price of the current candle.
Low()
Low
@description Returns the lowest price of the current candle.
Returns: float - The lowest price of the current candle.
Close()
Close
@description Returns the closing price of the current candle.
Returns: float - The closing price of the current candle.
FullSize()
FullSize
@description Returns the full size (range) of the current candle (high - low).
Returns: float - The full size of the current candle.
BodySize()
BodySize
@description Returns the body size of the current candle (open - close).
Returns: float - The body size of the current candle.
WickSize()
WickSize
@description Returns the size of the wicks of the current candle (full size - body size).
Returns: float - The size of the wicks of the current candle.
UpperWickSize()
UpperWickSize
@description Returns the size of the upper wick of the current candle.
Returns: float - The size of the upper wick of the current candle.
LowerWickSize()
LowerWickSize
@description Returns the size of the lower wick of the current candle.
Returns: float - The size of the lower wick of the current candle.
BodyToWickRatio()
BodyToWickRatio
@description Returns the ratio of the body size to the wick size of the current candle.
Returns: float - The body to wick ratio of the current candle.
UpperWickPercentage()
UpperWickPercentage
@description Returns the percentage of the upper wick size relative to the full size of the current candle.
Returns: float - The percentage of the upper wick size relative to the full size of the current candle.
LowerWickPercentage()
LowerWickPercentage
@description Returns the percentage of the lower wick size relative to the full size of the current candle.
Returns: float - The percentage of the lower wick size relative to the full size of the current candle.
WickToBodyRatio()
WickToBodyRatio
@description Returns the ratio of the wick size to the body size of the current candle.
Returns: float - The wick to body ratio of the current candle.
BodyPercentage()
BodyPercentage
@description Returns the percentage of the body size relative to the full size of the current candle.
Returns: float - The percentage of the body size relative to the full size of the current candle.
WickPercentage()
WickPercentage
@description Returns the percentage of the wick size relative to the full size of the current candle.
Returns: float - The percentage of the wick size relative to the full size of the current candle.
CandleDirection()
CandleDirection
@description Returns the direction of the current candle.
Returns: string - "Bullish" if the candle is bullish, "Bearish" if the candle is bearish.
AveragePrice()
AveragePrice
@description Returns the average price of the current candle (mean of open, high, low, and close).
Returns: float - The average price of the current candle.
MidpointPrice()
MidpointPrice
@description Returns the midpoint price of the current candle (mean of high and low).
Returns: float - The midpoint price of the current candle.
Volatility()
Volatility
@description Returns the standard deviation of the OHLC prices of the current candle.
Returns: float - The volatility of the current candle.
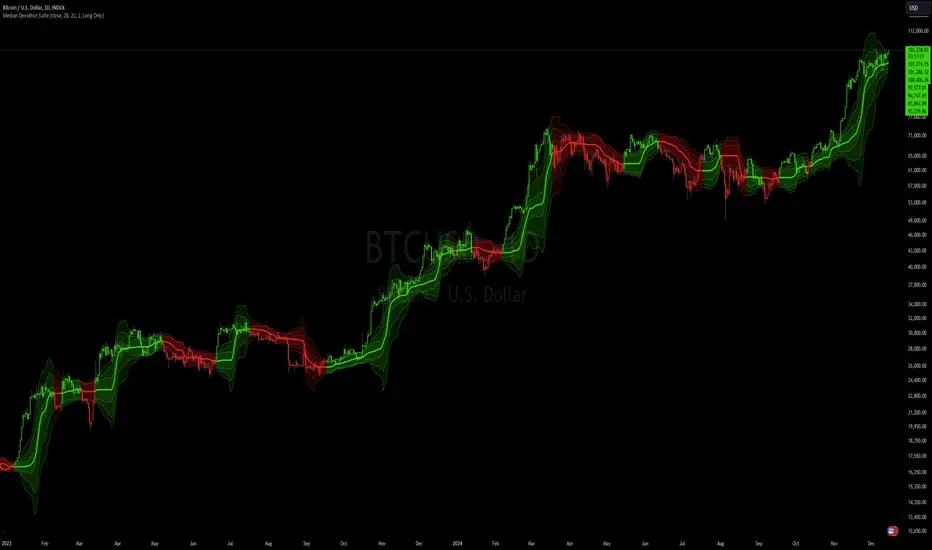
Median Deviation Suite [InvestorUnknown]The Median Deviation Suite uses a median-based baseline derived from a Double Exponential Moving Average (DEMA) and layers multiple deviation measures around it. By comparing price to these deviation-based ranges, it attempts to identify trends and potential turning points in the market. The indicator also incorporates several deviation types—Average Absolute Deviation (AAD), Median Absolute Deviation (MAD), Standard Deviation (STDEV), and Average True Range (ATR)—allowing traders to visualize different forms of volatility and dispersion. Users should calibrate the settings to suit their specific trading approach, as the default values are not optimized.
Core Components
Median of a DEMA:
The foundation of the indicator is a Median applied to the 7-day DEMA (Double Exponential Moving Average). DEMA aims to reduce lag compared to simple or exponential moving averages. By then taking a median over median_len periods of the DEMA values, the indicator creates a robust and stable central tendency line.
float dema = ta.dema(src, 7)
float median = ta.median(dema, median_len)
Multiple Deviation Measures:
Around this median, the indicator calculates several measures of dispersion:
ATR (Average True Range): A popular volatility measure.
STDEV (Standard Deviation): Measures the spread of price data from its mean.
MAD (Median Absolute Deviation): A robust measure of variability less influenced by outliers.
AAD (Average Absolute Deviation): Similar to MAD, but uses the mean absolute deviation instead of median.
Average of Deviations (avg_dev): The average of the above four measures (ATR, STDEV, MAD, AAD), providing a combined sense of volatility.
Each measure is multiplied by a user-defined multiplier (dev_mul) to scale the width of the bands.
aad = f_aad(src, dev_len, median) * dev_mul
mad = f_mad(src, dev_len, median) * dev_mul
stdev = ta.stdev(src, dev_len) * dev_mul
atr = ta.atr(dev_len) * dev_mul
avg_dev = math.avg(aad, mad, stdev, atr)
Deviation-Based Bands:
The indicator creates multiple upper and lower lines based on each deviation type. For example, using MAD:
float mad_p = median + mad // already multiplied by dev_mul
float mad_m = median - mad
Similar calculations are done for AAD, STDEV, ATR, and the average of these deviations. The indicator then determines the overall upper and lower boundaries by combining these lines:
float upper = f_max4(aad_p, mad_p, stdev_p, atr_p)
float lower = f_min4(aad_m, mad_m, stdev_m, atr_m)
float upper2 = f_min4(aad_p, mad_p, stdev_p, atr_p)
float lower2 = f_max4(aad_m, mad_m, stdev_m, atr_m)
This creates a layered structure of volatility envelopes. Traders can observe which layers price interacts with to gauge trend strength.
Determining Trend
The indicator generates trend signals by assessing where price stands relative to these deviation-based lines. It assigns a trend score by summing individual signals from each deviation measure. For instance, if price crosses above the MAD-based upper line, it contributes a bullish point; crossing below an ATR-based lower line contributes a bearish point.
When the aggregated trend score crosses above zero, it suggests a shift towards a bullish environment; crossing below zero indicates a bearish bias.
// Define Trend scores
var int aad_t = 0
if ta.crossover(src, aad_p)
aad_t := 1
if ta.crossunder(src, aad_m)
aad_t := -1
var int mad_t = 0
if ta.crossover(src, mad_p)
mad_t := 1
if ta.crossunder(src, mad_m)
mad_t := -1
var int stdev_t = 0
if ta.crossover(src, stdev_p)
stdev_t := 1
if ta.crossunder(src, stdev_m)
stdev_t := -1
var int atr_t = 0
if ta.crossover(src, atr_p)
atr_t := 1
if ta.crossunder(src, atr_m)
atr_t := -1
var int adev_t = 0
if ta.crossover(src, adev_p)
adev_t := 1
if ta.crossunder(src, adev_m)
adev_t := -1
int upper_t = src > upper ? 3 : 0
int lower_t = src < lower ? 0 : -3
int upper2_t = src > upper2 ? 1 : 0
int lower2_t = src < lower2 ? 0 : -1
float trend = aad_t + mad_t + stdev_t + atr_t + adev_t + upper_t + lower_t + upper2_t + lower2_t
var float sig = 0
if ta.crossover(trend, 0)
sig := 1
else if ta.crossunder(trend, 0)
sig := -1
Practical Usage and Calibration
Default settings are not optimized: The given parameters serve as a starting point for demonstration. Users should adjust:
median_len: Affects how smooth and lagging the median of the DEMA is.
dev_len and dev_mul: Influence the sensitivity of the deviation measures. Larger multipliers widen the bands, potentially reducing false signals but introducing more lag. Smaller multipliers tighten the bands, producing quicker signals but potentially more whipsaws.
This flexibility allows the trader to tailor the indicator for various markets (stocks, forex, crypto) and time frames.
Backtesting and Performance Metrics
The code integrates with a backtesting library that allows traders to:
Evaluate the strategy historically
Compare the indicator’s signals with a simple buy-and-hold approach
Generate performance metrics (e.g., mean returns, Sharpe Ratio, Sortino Ratio) to assess historical effectiveness.
Disclaimer
No guaranteed results: Historical performance does not guarantee future outcomes. Market conditions can vary widely.
User responsibility: Traders should combine this indicator with other forms of analysis, appropriate risk management, and careful calibration of parameters.
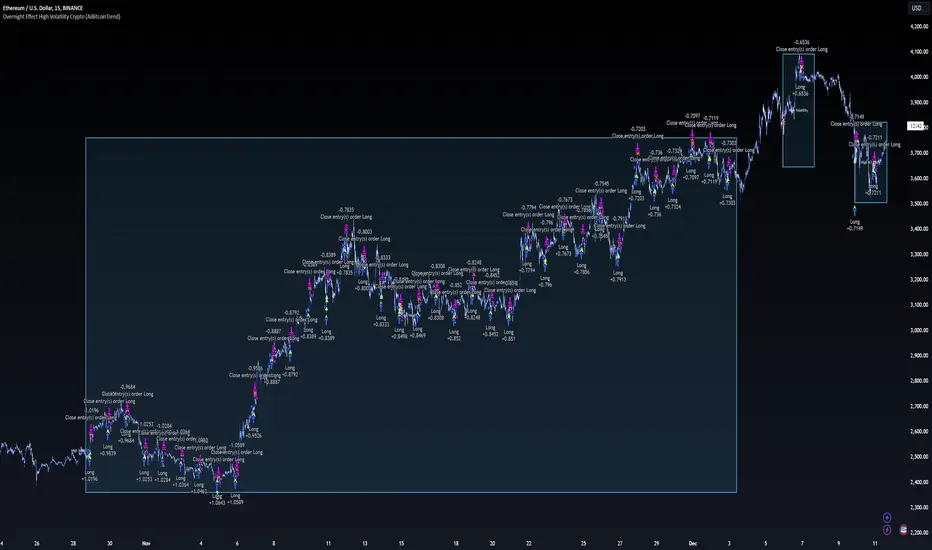
Overnight Effect High Volatility Crypto (AiBitcoinTrend)👽 Overview of the Strategy
This strategy leverages the overnight effect in the cryptocurrency market, specifically targeting the two-hour window from 21:00 UTC to 23:00 UTC. The strategy is designed to be applied only during periods of high volatility, which is determined using historical volatility data. This approach, inspired by research from Padyšák and Vojtko (2022), aims to capitalize on statistically significant return patterns observed during these hours.
Deep Backtesting with a High Volatility Filter
Deep Backtesting without a High Volatility Filter
👽 How the Strategy Works
Volatility Calculation:
Each day at 00:00 UTC, the strategy calculates the 30-day historical volatility of crypto returns (typically Bitcoin). The historical volatility is the standard deviation of the log returns over the past 30 days, representing the market's recent volatility level.
Median Volatility Benchmark:
The median of the 30-day historical volatility is calculated over a 365-day period (one year). This median acts as a benchmark to classify each day as either:
👾 High Volatility: When the current 30-day volatility exceeds the median volatility.
👾 Low Volatility: When the current 30-day volatility is below the median.
Trading Rule:
If the day is classified as a High Volatility Day, the strategy executes the following trades:
👾 Buy at 21:00 UTC.
👾 Sell at 23:00 UTC.
Trade Execution Details:
The strategy uses a 0.02% fee per trade.
Each trade is executed with 25% of the available capital. This allocation helps manage risk while allowing for compounding returns.
Rationale:
The returns during the 22:00 and 23:00 UTC hours have been found to be statistically significant during high volatility periods. The overnight effect is believed to drive this phenomenon due to the asynchronous closing hours of global financial markets. This creates unique trading opportunities in the cryptocurrency market, where exchanges remain open 24/7.
👽 Market Context and Global Time Zone Impact
👾 Why 21:00 to 23:00 UTC?
During this window, major traditional financial markets are closed:
NYSE (New York) closes at 21:00 UTC.
London and European markets are closed during these hours.
Asian markets (Tokyo, Hong Kong, etc.) open later, leaving this window largely unaffected by traditional trading flows.
This global market inactivity creates a period where significant moves can occur in the cryptocurrency market, particularly during high volatility.
👽 Strategy Parameters
Volatility Period: 30 days.
The lookback period for calculating historical volatility.
Median Period: 365 days.
The lookback period for calculating the median volatility benchmark.
Entry Time: 21:00 UTC.
Adjust this to your local time if necessary (e.g., 16:00 in New York, 22:00 in Stockholm).
Exit Time: 23:00 UTC.
Adjust this to your local time if necessary (e.g., 18:00 in New York, 00:00 midnight in Stockholm).
👽 Benefits of the Strategy
Seasonality Effect:
The strategy captures consistent patterns driven by the overnight effect and high volatility periods.
Risk Reduction:
Since trades are executed during a specific window and only on high volatility days, the strategy helps mitigate exposure to broader market risk.
Simplicity and Efficiency:
The strategy is moderately complex, making it accessible for traders while offering significant returns.
Global Applicability:
Suitable for traders worldwide, with clear guidelines on adjusting for local time zones.
👽 Considerations
Market Conditions: The strategy works best in a high-volatility environment.
Execution: Requires precise timing to enter and exit trades at the specified hours.
Time Zone Adjustments: Ensure you convert UTC times accurately based on your location to execute trades at the correct local times.
Disclaimer: This information is for entertainment purposes only and does not constitute financial advice. Please consult with a qualified financial advisor before making any investment decisions.
DCA Strategy with Mean Reversion and Bollinger BandDCA Strategy with Mean Reversion and Bollinger Band
The Dollar-Cost Averaging (DCA) Strategy with Mean Reversion and Bollinger Bands is a sophisticated trading strategy that combines the principles of DCA, mean reversion, and technical analysis using Bollinger Bands. This strategy aims to capitalize on market corrections by systematically entering positions during periods of price pullbacks and reversion to the mean.
Key Concepts and Principles
1. Dollar-Cost Averaging (DCA)
DCA is an investment strategy that involves regularly purchasing a fixed dollar amount of an asset, regardless of its price. The idea behind DCA is that by spreading out investments over time, the impact of market volatility is reduced, and investors can avoid making large investments at inopportune times. The strategy reduces the risk of buying all at once during a market high and can smooth out the cost of purchasing assets over time.
In the context of this strategy, the Investment Amount (USD) is set by the user and represents the amount of capital to be invested in each buy order. The strategy executes buy orders whenever the price crosses below the lower Bollinger Band, which suggests a potential market correction or pullback. This is an effective way to average the entry price and avoid the emotional pitfalls of trying to time the market perfectly.
2. Mean Reversion
Mean reversion is a concept that suggests prices will tend to return to their historical average or mean over time. In this strategy, mean reversion is implemented using the Bollinger Bands, which are based on a moving average and standard deviation. The lower band is considered a potential buy signal when the price crosses below it, indicating that the asset has become oversold or underpriced relative to its historical average. This triggers the DCA buy order.
Mean reversion strategies are popular because they exploit the natural tendency of prices to revert to their mean after experiencing extreme deviations, such as during market corrections or panic selling.
3. Bollinger Bands
Bollinger Bands are a technical analysis tool that consists of three lines:
Middle Band: The moving average, usually a 200-period Exponential Moving Average (EMA) in this strategy. This serves as the "mean" or baseline.
Upper Band: The middle band plus a certain number of standard deviations (multiplier). The upper band is used to identify overbought conditions.
Lower Band: The middle band minus a certain number of standard deviations (multiplier). The lower band is used to identify oversold conditions.
In this strategy, the Bollinger Bands are used to identify potential entry points for DCA trades. When the price crosses below the lower band, this is seen as a potential opportunity for mean reversion, suggesting that the asset may be oversold and could reverse back toward the middle band (the EMA). Conversely, when the price crosses above the upper band, it indicates overbought conditions and signals potential market exhaustion.
4. Time-Based Entry and Exit
The strategy has specific entry and exit points defined by time parameters:
Open Date: The date when the strategy begins opening positions.
Close Date: The date when all positions are closed.
This time-bound approach ensures that the strategy is active only during a specified window, which can be useful for testing specific market conditions or focusing on a particular time frame.
5. Position Sizing
Position sizing is determined by the Investment Amount (USD), which is the fixed amount to be invested in each buy order. The quantity of the asset to be purchased is calculated by dividing the investment amount by the current price of the asset (investment_amount / close). This ensures that the amount invested remains constant despite fluctuations in the asset's price.
6. Closing All Positions
The strategy includes an exit rule that closes all positions once the specified close date is reached. This allows for controlled exits and limits the exposure to market fluctuations beyond the strategy's timeframe.
7. Background Color Based on Price Relative to Bollinger Bands
The script uses the background color of the chart to provide visual feedback about the price's relationship with the Bollinger Bands:
Red background indicates the price is above the upper band, signaling overbought conditions.
Green background indicates the price is below the lower band, signaling oversold conditions.
This provides an easy-to-interpret visual cue for traders to assess the current market environment.
Postscript: Configuring Initial Capital for Backtesting
To ensure the backtest results align with the actual investment scenario, users must adjust the Initial Capital in the TradingView strategy properties. This is done by calculating the Initial Capital as the product of the Total Closed Trades and the Investment Amount (USD). For instance:
If the user is investing 100 USD per trade and has 10 closed trades, the Initial Capital should be set to 1,000 USD.
Similarly, if the user is investing 200 USD per trade and has 24 closed trades, the Initial Capital should be set to 4,800 USD.
This adjustment ensures that the backtesting results reflect the actual capital deployed in the strategy and provides an accurate representation of potential gains and losses.
Conclusion
The DCA strategy with Mean Reversion and Bollinger Bands is a systematic approach to investing that leverages the power of regular investments and technical analysis to reduce market timing risks. By combining DCA with the insights offered by Bollinger Bands and mean reversion, this strategy offers a structured way to navigate volatile markets while targeting favorable entry points. The clear entry and exit rules, coupled with time-based constraints, make it a robust and disciplined approach to long-term investing.

Optimal MA FinderIntroduction to the "Optimal MA Finder" Indicator
The "Optimal MA Finder" is a powerful and versatile tool designed to help traders optimize their moving average strategies. This script combines flexibility, precision, and automation to identify the most effective moving average (MA) length for your trading approach. Whether you're aiming to improve your long-only strategy or implement a buy-and-sell methodology, the "Optimal MA Finder" is your go-to solution for enhanced decision-making.
What Does It Do?
The script evaluates a wide range of moving average lengths, from 10 to 500, to determine which one produces the best results based on historical data. By calculating critical metrics such as the total number of trades and the profit factor for each MA length, it identifies the one that maximizes profitability. It supports both simple moving averages (SMA) and exponential moving averages (EMA), allowing you to tailor the analysis to your preferred method.
The logic works by backtesting each MA length against the price data and assessing the performance under two strategies:
Buy & Sell: Includes both long and short trades.
Long Only: Focuses solely on long positions for more conservative strategies.
Once the optimal MA length is identified, the script overlays it on the chart, highlighting periods when the price crosses over or under the optimal MA, helping traders identify potential entry and exit points.
Why Is It Useful?
This indicator stands out for its ability to automate a task that is often labor-intensive and subjective: finding the best MA length. By providing a clear, data-driven answer, it saves traders countless hours of manual testing while significantly enhancing the accuracy of their strategies. For example, instead of guessing whether a 50-period EMA is more effective than a 200-period SMA, the "Optimal MA Finder" will pinpoint the exact length and type of MA that has historically yielded the best results for your chosen strategy.
Key Benefits:
Precision: Identifies the MA length with the highest profit factor for maximum profitability.
Automation: Conducts thorough backtesting without manual effort.
Flexibility: Adapts to your preferred MA type (SMA or EMA) and trading strategy (Buy & Sell or Long Only).
Real-Time Feedback: Provides actionable insights by plotting the optimal MA directly on your chart and highlighting relevant trading periods.
Example of Use: Imagine you're trading a volatile stock and want to optimize your long-only strategy. By applying the "Optimal MA Finder," you discover that a 120-period EMA results in the highest profit factor. The indicator plots this EMA on your chart, showing you when to consider entering or exiting positions based on price movements relative to the EMA.
In short, the "Optimal MA Finder" empowers traders by delivering data-driven insights and improving the effectiveness of trading strategies. Its clear logic, combined with robust automation, makes it an invaluable tool for both novice and experienced traders seeking consistent results.
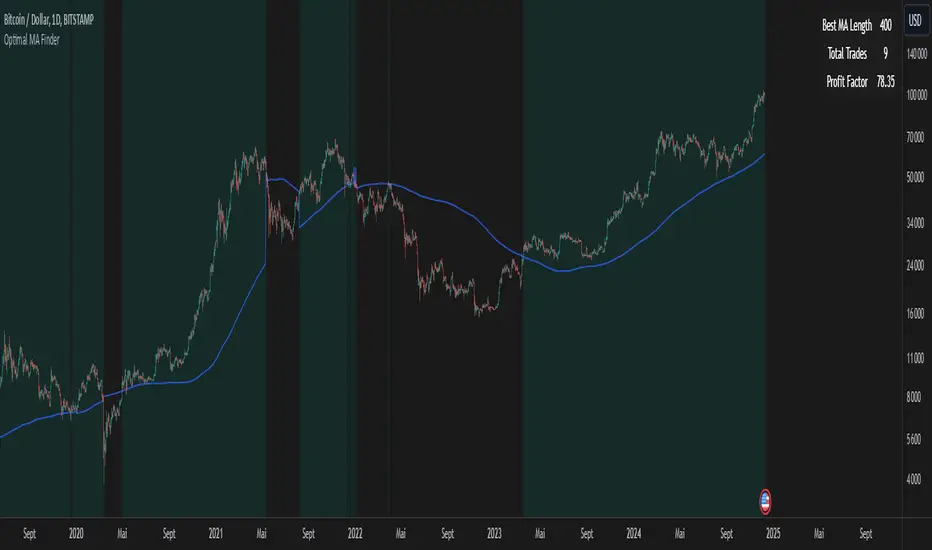
TrigWave Suite [InvestorUnknown]The TrigWave Suite combines Sine-weighted, Cosine-weighted, and Hyperbolic Tangent moving averages (HTMA) with a Directional Movement System (DMS) and a Relative Strength System (RSS).
Hyperbolic Tangent Moving Average (HTMA)
The HTMA smooths the price by applying a hyperbolic tangent transformation to the difference between the price and a simple moving average. It also adjusts this value by multiplying it by a standard deviation to create a more stable signal.
// Function to calculate Hyperbolic Tangent
tanh(x) =>
e_x = math.exp(x)
e_neg_x = math.exp(-x)
(e_x - e_neg_x) / (e_x + e_neg_x)
// Function to calculate Hyperbolic Tangent Moving Average
htma(src, len, mul) =>
tanh_src = tanh((src - ta.sma(src, len)) * mul) * ta.stdev(src, len) + ta.sma(src, len)
htma = ta.sma(tanh_src, len)
Sine-Weighted Moving Average (SWMA)
The SWMA applies sine-based weights to historical prices. This gives more weight to the central data points, making it responsive yet less prone to noise.
// Function to calculate the Sine-Weighted Moving Average
f_Sine_Weighted_MA(series float src, simple int length) =>
var float sine_weights = array.new_float(0)
array.clear(sine_weights) // Clear the array before recalculating weights
for i = 0 to length - 1
weight = math.sin((math.pi * (i + 1)) / length)
array.push(sine_weights, weight)
// Normalize the weights
sum_weights = array.sum(sine_weights)
for i = 0 to length - 1
norm_weight = array.get(sine_weights, i) / sum_weights
array.set(sine_weights, i, norm_weight)
// Calculate Sine-Weighted Moving Average
swma = 0.0
if bar_index >= length
for i = 0 to length - 1
swma := swma + array.get(sine_weights, i) * src
swma
Cosine-Weighted Moving Average (CWMA)
The CWMA uses cosine-based weights for data points, which produces a more stable trend-following behavior, especially in low-volatility markets.
f_Cosine_Weighted_MA(series float src, simple int length) =>
var float cosine_weights = array.new_float(0)
array.clear(cosine_weights) // Clear the array before recalculating weights
for i = 0 to length - 1
weight = math.cos((math.pi * (i + 1)) / length) + 1 // Shift by adding 1
array.push(cosine_weights, weight)
// Normalize the weights
sum_weights = array.sum(cosine_weights)
for i = 0 to length - 1
norm_weight = array.get(cosine_weights, i) / sum_weights
array.set(cosine_weights, i, norm_weight)
// Calculate Cosine-Weighted Moving Average
cwma = 0.0
if bar_index >= length
for i = 0 to length - 1
cwma := cwma + array.get(cosine_weights, i) * src
cwma
Directional Movement System (DMS)
DMS is used to identify trend direction and strength based on directional movement. It uses ADX to gauge trend strength and combines +DI and -DI for directional bias.
// Function to calculate Directional Movement System
f_DMS(simple int dmi_len, simple int adx_len) =>
up = ta.change(high)
down = -ta.change(low)
plusDM = na(up) ? na : (up > down and up > 0 ? up : 0)
minusDM = na(down) ? na : (down > up and down > 0 ? down : 0)
trur = ta.rma(ta.tr, dmi_len)
plus = fixnan(100 * ta.rma(plusDM, dmi_len) / trur)
minus = fixnan(100 * ta.rma(minusDM, dmi_len) / trur)
sum = plus + minus
adx = 100 * ta.rma(math.abs(plus - minus) / (sum == 0 ? 1 : sum), adx_len)
dms_up = plus > minus and adx > minus
dms_down = plus < minus and adx > plus
dms_neutral = not (dms_up or dms_down)
signal = dms_up ? 1 : dms_down ? -1 : 0
Relative Strength System (RSS)
RSS employs RSI and an adjustable moving average type (SMA, EMA, or HMA) to evaluate whether the market is in a bullish or bearish state.
// Function to calculate Relative Strength System
f_RSS(rsi_src, rsi_len, ma_type, ma_len) =>
rsi = ta.rsi(rsi_src, rsi_len)
ma = switch ma_type
"SMA" => ta.sma(rsi, ma_len)
"EMA" => ta.ema(rsi, ma_len)
"HMA" => ta.hma(rsi, ma_len)
signal = (rsi > ma and rsi > 50) ? 1 : (rsi < ma and rsi < 50) ? -1 : 0
ATR Adjustments
To minimize false signals, the HTMA, SWMA, and CWMA signals are adjusted with an Average True Range (ATR) filter:
// Calculate ATR adjusted components for HTMA, CWMA and SWMA
float atr = ta.atr(atr_len)
float htma_up = htma + (atr * atr_mult)
float htma_dn = htma - (atr * atr_mult)
float swma_up = swma + (atr * atr_mult)
float swma_dn = swma - (atr * atr_mult)
float cwma_up = cwma + (atr * atr_mult)
float cwma_dn = cwma - (atr * atr_mult)
This adjustment allows for better adaptation to varying market volatility, making the signal more reliable.
Signals and Trend Calculation
The indicator generates a Trend Signal by aggregating the output from each component. Each component provides a directional signal that is combined to form a unified trend reading. The trend value is then converted into a long (1), short (-1), or neutral (0) state.
Backtesting Mode and Performance Metrics
The Backtesting Mode includes a performance metrics table that compares the Buy and Hold strategy with the TrigWave Suite strategy. Key statistics like Sharpe Ratio, Sortino Ratio, and Omega Ratio are displayed to help users assess performance. Note that due to labels and plotchar use, automatic scaling may not function ideally in backtest mode.
Alerts and Visualization
Trend Direction Alerts: Set up alerts for long and short signals
Color Bars and Gradient Option: Bars are colored based on the trend direction, with an optional gradient for smoother visual feedback.
Important Notes
Customization: Default settings are experimental and not intended for trading/investing purposes. Users are encouraged to adjust and calibrate the settings to optimize results according to their trading style.
Backtest Results Disclaimer: Please note that backtest results are not indicative of future performance, and no strategy guarantees success.

DMI Delta by 0xjcfOverview
This indicator integrates the Directional Movement Index (DMI), Average Directional Index (ADX), and volume analysis into an Oscillator designed to help traders identify divergence-based trading signals. Unlike typical volume or momentum indicators, this combination provides insight into directional momentum and volume intensity, allowing traders to make well-informed decisions based on multiple facets of market behavior.
Purpose and How Components Work Together
By combining DMI and ADX with volume analysis, this indicator helps traders detect when momentum diverges from price action—a common precursor to potential reversals or significant moves. The ADX filter enhances this by distinguishing trending from range-bound conditions, while volume analysis highlights moments of extreme sentiment, such as solid buying or selling. Together, these elements provide traders with a comprehensive view of market strength, directional bias, and volume surges, which help filter out weaker signals.
Key Features
DMI Delta and Oscillator: The DMI indicator measures directional movement by comparing DI+ and DI- values. This difference (DMI Delta) is calculated and displayed as a histogram, visualizing changes in directional bias. When combined with ADX filtering, this histogram helps traders gauge the strength of momentum and spot directional shifts early. For instance, a rising histogram in a bearish price trend might signal a potential bullish reversal.
Volume Analysis with Extremes: Volume is monitored to reveal when market participation is unusually high, using a customizable multiplier to highlight significant volume spikes. These extreme levels are color-coded directly on the histogram, providing visual cues on whether buying or selling interest is particularly strong. Volume analysis adds depth to the directional insights from DMI, allowing traders to differentiate between regular and powerful moves.
ADX Trending Filter: The ADX component filters trends by measuring the overall strength of a price move, with a default threshold of 25. When ADX is above this level, it suggests that the market is trending strongly, making the DMI Delta readings more reliable. Below this threshold, the market is likely range-bound, cautioning traders that signals might not have as much follow-through.
Using the Indicator in Divergence Strategies
This indicator excels in divergence strategies by highlighting moments when price action diverges from directional momentum. Here’s how it aids in decision-making:
Bullish Divergence: If the price is falling to new lows while the DMI Delta histogram rises, it can indicate weakening bearish momentum and signal a potential price reversal to the upside.
Bearish Divergence: Conversely, if prices are climbing but the DMI Delta histogram falls, it may point to waning bullish momentum, suggesting a bearish reversal.
Visual Cues and Customization
The color-coded output enhances usability:
Bright Green/Red: Extreme volume with strong bullish or bearish signals, often at points of high potential for trend continuation or reversal.
Green/Red Shades: These shades reflect trending conditions (bullish or bearish) based on ADX, factoring in volume. Green signals a bullish trend, and red is a bearish trend.
Blue/Orange Shades: Indicates non-trending or weaker conditions, suggesting a more cautious approach in range-bound markets.
Customizable for Diverse Trading Styles
This indicator allows users to adjust settings like the ADX threshold and volume multiplier to optimize performance for various timeframes and strategies. Whether a trader prefers swing trading or intraday scalping, these parameters enable fine-tuning to enhance signal reliability across different market contexts.
Practical Usage Tips
Entry and Exit Signals: Use this indicator in conjunction with price action. Divergences between the price and DMI Delta histogram can reinforce entry or exit decisions.
Adjust Thresholds: Based on backtesting, customize the ADX Trending Threshold and Volume Multiplier to ensure optimal performance on different timeframes or trading styles.
In summary, this indicator is tailored for traders seeking a multi-dimensional approach to market analysis. It blends momentum, trend strength, and volume insights to support divergence-based strategies, helping traders confidently make informed decisions. Remember to validate signals through backtesting and use it alongside price action for the best results.
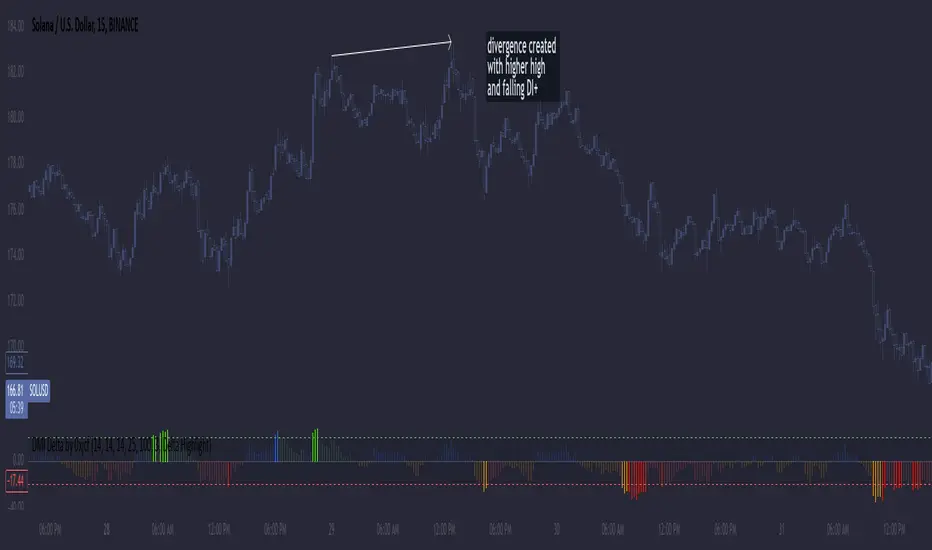
DSL Strategy [DailyPanda]
Overview
The DSL Strategy by DailyPanda is a trading strategy that synergistically combines the idea from indicators to create a more robust and reliable trading tool. By integrating these indicators, the strategy enhances signal accuracy and provides traders with a comprehensive view of market trends and momentum shifts. This combination allows for better entry and exit points, improved risk management, and adaptability to various market conditions.
Combining ideas from indicators adds value by:
Enhancing Signal Confirmation : The strategy requires alignment between trend and momentum before generating trade signals, reducing false entries.
Improving Accuracy : By integrating price action with momentum analysis, the strategy captures more reliable trading opportunities.
Providing Comprehensive Market Insight : The combination offers a better perspective on the market, considering both the direction (trend) and the strength (momentum) of price movements.
How the Components Work Together
1. Trend Identification with DSL Indicator
Dynamic Signal Lines : Calculates upper and lower DSL lines based on a moving average (SMA) and dynamic thresholds derived from recent highs and lows with a specified offset. These lines adapt to market conditions, providing real-time trend insights.
ATR-Based Bands : Adds bands around the DSL lines using the Average True Range (ATR) multiplied by a width factor. These bands account for market volatility and help identify potential stop-loss levels.
Trend Confirmation : The relationship between the price, DSL lines, and bands determines the current trend. For example, if the price consistently stays above the upper DSL line, it indicates a bullish trend.
2. Momentum Analysis
RSI Calculation : Computes the RSI over a specified period to measure the speed and change of price movements.
Zero-Lag EMA (ZLEMA) : Applies a ZLEMA to the RSI to minimize lag and produce a more responsive oscillator.
DSL Application on Oscillator : Implements the DSL concept on the oscillator by calculating dynamic upper and lower levels. This helps identify overbought or oversold conditions more accurately.
Signal Generation : Detects crossovers between the oscillator and its DSL lines. A crossover above the lower DSL line signals potential bullish momentum, while a crossover below the upper DSL line signals potential bearish momentum.
3. Integrated Signal Filtering
Confluence Requirement : A trade signal is generated only when both the DSL indicator and oscillator agree. For instance, a long entry requires both an uptrend confirmation from the DSL indicator and a bullish momentum signal from the oscillator.
Risk Management Integration : The strategy uses the DSL indicator's bands for setting stop-loss levels and calculates take-profit levels based on a user-defined risk-reward ratio. This ensures that every trade has a predefined risk management plan.
--------------------------------------------------------------------------------------------
Originality and Value Added to the Community
Unique Synergy : While both indicators are available individually, this strategy is original in how it combines them to enhance their strengths and mitigate their weaknesses, offering a novel approach not present in existing scripts.
Enhanced Reliability : By requiring confirmation from both trend and momentum indicators, the strategy reduces false signals and increases the likelihood of successful trades.
Versatility : The customizable parameters allow traders to adapt the strategy to different instruments, timeframes, and trading styles, making it a valuable tool for a wide range of trading scenarios.
Educational Contribution : The script demonstrates an effective method of combining indicators for improved trading performance, providing insights that other traders can learn from and apply to their own strategies.
--------------------------------------------------------------------------------------------
How to Use the Strategy
Adding the Strategy to Your Chart
Apply the DSL Strategy to your desired trading instrument and timeframe on TradingView.
--------------------------------------------------------------------------------------------
Configuring Parameters
DSL Indicator Settings :
Length (len) : Adjusts the sensitivity of the DSL lines (default is 34).
Offset : Determines the look-back period for threshold calculations (default is 30).
Bands Width (width) : Changes the distance of the ATR-based bands from the DSL lines (default is 1).
DSL-BELUGA Oscillator Settings :
Beluga Length (len_beluga) : Sets the period for the RSI calculation in the oscillator (default is 10).
DSL Lines Mode (dsl_mode) : Chooses between "Fast" (more responsive) and "Slow" (smoother) modes for the oscillator's DSL lines.
Risk Management :
Risk Reward (risk_reward) : Defines your desired risk-reward ratio for calculating take-profit levels (default is 1.5).
--------------------------------------------------------------------------------------------
Interpreting Signals
Long Entry Conditions :
Trend Confirmation : Price is above the upper DSL line and the upper DSL band (dsl_up1 > dsl_dn).
Price Behavior : The last three candles have both their opens and closes above the upper DSL line.
Momentum Signal : The DSL-BELUGA oscillator crosses above its lower DSL line (up_signal), indicating bullish momentum.
Short Entry Conditions :
Trend Confirmation : Price is below the lower DSL line and the lower DSL band (dsl_dn < dsl_up1).
Price Behavior : The last three candles have both their opens and closes below the lower DSL band.
Momentum Signal : The DSL-BELUGA oscillator crosses below its upper DSL line (dn_signal), indicating bearish momentum.
Exit Conditions :
Stop-Loss : Automatically set at the DSL indicator's band level (upper band for longs, lower band for shorts).
Take-Profit : Calculated based on the risk-reward ratio and the initial risk determined by the stop-loss distance.
Visual Aids
Signal Arrows : Upward green arrows for long entries and downward blue arrows for short entries appear on the chart when conditions are met.
Stop-Loss and Take-Profit Lines : Red and green lines display the calculated stop-loss and take-profit levels for active trades.
Background Highlighting : The chart background subtly changes color to indicate when a signal has been generated.
Backtesting and Optimization
Use TradingView's strategy tester to backtest the strategy over historical data.
Adjust parameters to optimize performance for different instruments or market conditions.
Regularly review backtesting results to ensure the strategy remains effective.

Multi Fibonacci Supertrend with Signals【FIbonacciFlux】Multi Fibonacci Supertrend with Signals (MFSS)
Overview
The Multi Fibonacci Supertrend with Signals (MFSS) is an advanced technical analysis tool that combines multiple Supertrend indicators using Fibonacci ratios to identify trend directions and potential trading opportunities.
Key Features
1. Fibonacci-Based Supertrend Levels
* Factor 1 (Weak) : 0.618 - The golden ratio
* Factor 2 (Medium) : 1.618 - The Fibonacci ratio
* Factor 3 (Strong) : 2.618 - The extension ratio
2. Visual Components
* Multi-layered Trend Lines
* Different line weights for easy identification
* Progressive transparency from Factor 1 to Factor 3
* Color-coded trend directions (Green for bullish, Red for bearish)
* Dynamic Fill Areas
* Gradient fills between price and trend lines
* Visual representation of trend strength
* Automatic color adjustment based on trend direction
* Signal Indicators
* Clear BUY/SELL labels on chart
* Position-adaptive signal placement
* High-visibility color scheme
3. Signal Generation Logic
The system generates signals based on two key conditions:
* Primary Condition :
* BUY : Price crossunder Supertrend2 (Factor 1.618)
* SELL : Price crossover Supertrend2 (Factor 1.618)
* Confirmation Filter :
* Signals only trigger when Supertrend3 confirms the trend direction
* Reduces false signals in volatile markets
Technical Details
Input Parameters
* ATR Period : 10 (default)
* Customizable for different market conditions
* Affects sensitivity of all Supertrend levels
* Factor Settings :
* All factors are customizable
* Default values based on Fibonacci sequence
* Minimum value: 0.01
* Step size: 0.01
Alert System
* Built-in alert conditions
* Customizable alert messages
* Real-time notification support
Use Cases
* Trend Trading
* Identify strong trend directions
* Filter out weak signals
* Confirm trend continuations
* Risk Management
* Multiple trend levels for stop-loss placement
* Clear entry and exit signals
* Trend strength visualization
* Market Analysis
* Multi-timeframe analysis capability
* Trend strength assessment
* Market structure identification
Benefits
* Reliability
* Based on proven Supertrend algorithm
* Enhanced with Fibonacci mathematics
* Multiple confirmation levels
* Clarity
* Clear visual signals
* Easy-to-interpret interface
* Reduced noise in signal generation
* Flexibility
* Customizable parameters
* Adaptable to different markets
* Suitable for various trading styles
Performance Considerations
* Optimized code structure
* Efficient calculation methods
* Minimal resource usage
Installation and Usage
Setup
* Add indicator to chart
* Adjust parameters if needed
* Enable alerts as required
Best Practices
* Use with other confirmation tools
* Adjust factors based on market volatility
* Consider timeframe appropriateness
Backtesting Results and Strategy Performance
This indicator is specifically designed for pullback trading with optimized risk-reward ratios in trend-following strategies. Below are the detailed backtesting results from our proprietary strategy implementation:
BTCUSDT Performance (Binance)
* Test Period: Approximately 7 years
* Risk-Reward Ratio: 2:1
* Take Profit: 8%
* Stop Loss: 4%
Key Metrics (BTCUSDT):
* Net Profit: +2,579%
* Total Trades: 551
* Win Rate: 44.8%
* Profit Factor: 1.278
* Maximum Drawdown: 42.86%
ETHUSD Performance (Binance)
* Risk-Reward Ratio: 4.33:1
* Take Profit: 13%
* Stop Loss: 3%
Key Metrics (ETHUSD):
* Net Profit: +8,563%
* Total Trades: 581
* Win Rate: 32%
* Profit Factor: 1.32
* Maximum Drawdown: 55%
Strategy Highlights:
* Optimized for pullback trading in strong trends
* Focus on high risk-reward ratios
* Proven effectiveness in major cryptocurrency pairs
* Consistent performance across different market conditions
* Robust profit factor despite moderate win rates
Note: These results are from our proprietary strategy implementation and should be used as reference only. Individual results may vary based on market conditions and implementation.
Important Considerations:
* The strategy demonstrates strong profitability despite lower win rates, emphasizing the importance of proper risk-reward ratios
* Higher drawdowns are compensated by significant overall returns
* The system shows adaptability across different cryptocurrencies with consistent profit factors
* Results suggest optimal performance in volatile crypto markets
Real Trading Examples
BTCUSDT 4-Hour Chart Analysis
Example of pullback strategy implementation on Bitcoin, showing clear trend definition and entry points
ETHUSDT 4-Hour Chart Analysis
Ethereum chart demonstrating effective signal generation during strong trends
BTCUSDT Detailed Signal Example (15-Minute Scalping)
Close-up view of signal generation and trend confirmation process on 15-minute timeframe, demonstrating the indicator's effectiveness for scalping operations
Chart Analysis Notes:
* Green and red zones clearly indicate trend direction
* Multiple timeframe confirmation visible through different Supertrend levels
* Clear entry signals during pullbacks in established trends
* Precise stop-loss placement opportunities below support levels
Implementation Guidelines:
* Wait for main trend confirmation from Factor 3 (2.618)
* Enter trades on pullbacks to Factor 2 (1.618)
* Use Factor 1 (0.618) for fine-tuning entry points
* Place stops below the relevant Supertrend level
Footnotes:
* Charts provided are from Binance exchange, using both 4-hour and 15-minute timeframes
* Trading view screenshots captured during actual market conditions
* Indicators shown: Multi Fibonacci Supertrend with all three factors
* Time period: Recent market activity showing various market conditions
Important Notice:
These charts are for educational purposes only. Past performance does not guarantee future results. Always conduct your own analysis and risk management.
Disclaimer
This indicator is for informational purposes only. Past performance is not indicative of future results. Always conduct proper risk management and due diligence.
License
Open source under MIT License
Author's Note
Contributions and suggestions for improvement are welcome. Please feel free to fork and enhance.

RSI Weighted Trend System I [InvestorUnknown]The RSI Weighted Trend System I is an experimental indicator designed to combine both slow-moving trend indicators for stable trend identification and fast-moving indicators to capture potential major turning points in the market. The novelty of this system lies in the dynamic weighting mechanism, where fast indicators receive weight based on the current Relative Strength Index (RSI) value, thus providing a flexible tool for traders seeking to adapt their strategies to varying market conditions.
Dynamic RSI-Based Weighting System
The core of the indicator is the dynamic weighting of fast indicators based on the value of the RSI. In essence, the higher the absolute value of the RSI (whether positive or negative), the higher the weight assigned to the fast indicators. This enables the system to capture rapid price movements around potential turning points.
Users can choose between a threshold-based or continuous weight system:
Threshold-Based Weighting: Fast indicators are activated only when the absolute RSI value exceeds a user-defined threshold. Below this threshold, fast indicators receive no weight.
Continuous Weighting: By setting the weight threshold to zero, the fast indicators always receive some weight, although this can result in more false signals in ranging markets.
// Calculate weight for Fast Indicators based on RSI (Slow Indicator weight is kept to 1 for simplicity)
f_RSI_Weight_System(series float rsi, simple float weight_thre) =>
float fast_weight = na
float slow_weight = na
if weight_thre > 0
if math.abs(rsi) <= weight_thre
fast_weight := 0
slow_weight := 1
else
fast_weight := 0 + math.sqrt(math.abs(rsi))
slow_weight := 1
else
fast_weight := 0 + math.sqrt(math.abs(rsi))
slow_weight := 1
Slow and Fast Indicators
Slow Indicators are designed to identify stable trends, remaining constant in weight. These include:
DMI (Directional Movement Index) For Loop
CCI (Commodity Channel Index) For Loop
Aroon For Loop
Fast Indicators are more responsive and designed to spot rapid trend shifts:
ZLEMA (Zero-Lag Exponential Moving Average) For Loop
IIRF (Infinite Impulse Response Filter) For Loop
Each of these indicators is calculated using a for-loop method to generate a moving average, which captures the trend of a given length range.
RSI Normalization
To facilitate the weighting system, the RSI is normalized from its usual 0-100 range to a -1 to 1 range. This allows for easy scaling when calculating weights and helps the system adjust to rapidly changing market conditions.
// Normalize RSI (1 to -1)
f_RSI(series float rsi_src, simple int rsi_len, simple string rsi_wb, simple string ma_type, simple int ma_len) =>
output = switch rsi_wb
"RAW RSI" => ta.rsi(rsi_src, rsi_len)
"RSI MA" => ma_type == "EMA" ? (ta.ema(ta.rsi(rsi_src, rsi_len), ma_len)) : (ta.sma(ta.rsi(rsi_src, rsi_len), ma_len))
Signal Calculation
The final trading signal is a weighted average of both the slow and fast indicators, depending on the calculated weights from the RSI. This ensures a balanced approach, where slow indicators maintain overall trend guidance, while fast indicators provide timely entries and exits.
// Calculate Signal (as weighted average)
sig = math.round(((DMI*slow_w) + (CCI*slow_w) + (Aroon*slow_w) + (ZLEMA*fast_w) + (IIRF*fast_w)) / (3*slow_w + 2*fast_w), 2)
Backtest Mode and Performance Metrics
This version of the RSI Weighted Trend System includes a comprehensive backtesting mode, allowing users to evaluate the performance of their selected settings against a Buy & Hold strategy. The backtesting includes:
Equity calculation based on the signals generated by the indicator.
Performance metrics table comparing Buy & Hold strategy metrics with the system’s signals, including: Mean, positive, and negative return percentages, Standard deviations (of all, positive and negative returns), Sharpe Ratio, Sortino Ratio, and Omega Ratio
f_PerformanceMetrics(series float base, int Lookback, simple float startDate, bool Annualize = true) =>
// Initialize variables for positive and negative returns
pos_sum = 0.0
neg_sum = 0.0
pos_count = 0
neg_count = 0
returns_sum = 0.0
returns_squared_sum = 0.0
pos_returns_squared_sum = 0.0
neg_returns_squared_sum = 0.0
// Loop through the past 'Lookback' bars to calculate sums and counts
if (time >= startDate)
for i = 0 to Lookback - 1
r = (base - base ) / base
returns_sum += r
returns_squared_sum += r * r
if r > 0
pos_sum += r
pos_count += 1
pos_returns_squared_sum += r * r
if r < 0
neg_sum += r
neg_count += 1
neg_returns_squared_sum += r * r
float export_array = array.new_float(12)
// Calculate means
mean_all = math.round((returns_sum / Lookback) * 100, 2)
mean_pos = math.round((pos_count != 0 ? pos_sum / pos_count : na) * 100, 2)
mean_neg = math.round((neg_count != 0 ? neg_sum / neg_count : na) * 100, 2)
// Calculate standard deviations
stddev_all = math.round((math.sqrt((returns_squared_sum - (returns_sum * returns_sum) / Lookback) / Lookback)) * 100, 2)
stddev_pos = math.round((pos_count != 0 ? math.sqrt((pos_returns_squared_sum - (pos_sum * pos_sum) / pos_count) / pos_count) : na) * 100, 2)
stddev_neg = math.round((neg_count != 0 ? math.sqrt((neg_returns_squared_sum - (neg_sum * neg_sum) / neg_count) / neg_count) : na) * 100, 2)
// Calculate probabilities
prob_pos = math.round((pos_count / Lookback) * 100, 2)
prob_neg = math.round((neg_count / Lookback) * 100, 2)
prob_neu = math.round(((Lookback - pos_count - neg_count) / Lookback) * 100, 2)
// Calculate ratios
sharpe_ratio = math.round(mean_all / stddev_all * (Annualize ? math.sqrt(Lookback) : 1), 2)
sortino_ratio = math.round(mean_all / stddev_neg * (Annualize ? math.sqrt(Lookback) : 1), 2)
omega_ratio = math.round(pos_sum / math.abs(neg_sum), 2)
// Set values in the array
array.set(export_array, 0, mean_all), array.set(export_array, 1, mean_pos), array.set(export_array, 2, mean_neg),
array.set(export_array, 3, stddev_all), array.set(export_array, 4, stddev_pos), array.set(export_array, 5, stddev_neg),
array.set(export_array, 6, prob_pos), array.set(export_array, 7, prob_neu), array.set(export_array, 8, prob_neg),
array.set(export_array, 9, sharpe_ratio), array.set(export_array, 10, sortino_ratio), array.set(export_array, 11, omega_ratio)
// Export the array
export_array
The metrics help traders assess the effectiveness of their strategy over time and can be used to optimize their settings.
Calibration Mode
A calibration mode is included to assist users in tuning the indicator to their specific needs. In this mode, traders can focus on a specific indicator (e.g., DMI, CCI, Aroon, ZLEMA, IIRF, or RSI) and fine-tune it without interference from other signals.
The calibration plot visualizes the chosen indicator's performance against a zero line, making it easy to see how changes in the indicator’s settings affect its trend detection.
Customization and Default Settings
Important Note: The default settings provided are not optimized for any particular market or asset. They serve as a starting point for experimentation. Traders are encouraged to calibrate the system to suit their own trading strategies and preferences.
The indicator allows deep customization, from selecting which indicators to use, adjusting the lengths of each indicator, smoothing parameters, and the RSI weight system.
Alerts
Traders can set alerts for both long and short signals when the indicator flips, allowing for automated monitoring of potential trading opportunities.

Candle Range Theory | Flux Charts💎 GENERAL OVERVIEW
Introducing our new Candle Range Theory Indicator! This powerful tool offers a strategy built around the Candle Range Theory, which analyzes market movements through the relative size and structure of price candles. For more information about the process, check the "HOW DOES IT WORK" section.
Features of the new Candle Range Theory Indicator :
Implementation of the Candle Range Theory
FVG & Order Block Entry Methods
2 Different TP / SL Methods
Customizable Execution Settings
Customizable Backtesting Dashboard
Alerts for Buy, Sell, TP & SL Signals
📌 HOW DOES IT WORK ?
The Candle Range Theory (CRT) indicator operates by identifying significant price movements through the relative size and structure of candlesticks. A key part of the strategy is determining large candles based on their range compared to the Average True Range (ATR) in a higher timeframe. Once identified, a breakout of either the high wick or the low wick of the large candle is required. This breakout is considered a liquidity grab. After that, the indicator waits for confirmation through Fair Value Gaps (FVGs) or Order Blocks (OBs). The confirmation structure must be the opposite direction of the breakout, for example if the high wick is broken, a bearish FVG is required for the short entry. After a confirmation signal is received, the indicator will trigger entry points based on your chosen entry method (FVG or OB), and exit points will be calculated using either a dynamic ATR-based TP/SL method or fixed percentages. Alerts for Buy, Sell, Take-Proft, and Stop-Loss are available.
🚩 UNIQUENESS
This indicator stands out because it combines two highly effective entry methods: Fair Value Gaps (FVGs) and Order Blocks (OBs). You can choose between these strategies depending on market conditions. Additionally, the dynamic TP/SL system uses the ticker's volatility to automatically calculate stop-loss and take-profit targets. The backtesting dashboard provides metrics about the performance of the indicator. You can use it to tune the settings for best use in the current tiker. The Candle Range Theory approach offers more flexibility compared to traditional indicators, allowing for better customization and control based on your risk tolerance.
⚙️ SETTINGS
1. General Configuration
Higher Timeframe: Customize the higher timeframe for analysis. Recommended combinations include M15 -> H4, H4 -> Daily, Daily -> Weekly, and Weekly -> Monthly.
HTF Candle Size: Define the size of the higher timeframe candles as Big, Normal, or Small to filter valid setups based on their range relative to ATR.
Entry Mode: Choose between FVGs and Order Blocks for your entry triggers.
Require Retracement: Enable this option if you want a retracement to the FVG or OB for entry confirmation.
Show HTF Candle Lines: Toggle to display the higher timeframe candle lines for better visual clarity.
2. Fair Value Gaps
FVG Sensitivity: You may select between Low, Normal, High or Extreme FVG detection sensitivity. This will essentially determine the size of the spotted FVGs, with lower sensitivities resulting in spotting bigger FVGs, and higher sensitivities resulting in spotting all sizes of FVGs.
3. Order Blocks
Swing Length: Swing length is used when finding order block formations. Smaller values will result in finding smaller order blocks.
4. TP / SL
TP / SL Method:
a) Dynamic: The TP / SL zones will be auto-determined by the algorithm based on the Average True Range (ATR) of the current ticker.
b) Fixed : You can adjust the exact TP / SL ratios from the settings below.
Dynamic Risk: The risk you're willing to take if "Dynamic" TP / SL Method is selected. Higher risk usually means a better winrate at the cost of losing more if the strategy fails. This setting is has a crucial effect on the performance of the indicator, as different tickers may have different volatility so the indicator may have increased performance when this setting is correctly adjusted.

MACD Enhanced Strategy MTF with Stop Loss [LTB]Test strategy for MACD
This strategy, named "MACD Enhanced Strategy MTF with Stop Loss ," is a modified Moving Average Convergence Divergence (MACD) strategy with enhancements such as multi-timeframe (MTF) analysis, custom scoring, and a dynamic stop loss mechanism. Let’s break down how to effectively use it:
Key Elements of the Strategy
MACD Indicator with Modifications:
The strategy uses MACD, a well-known momentum indicator, with customizable parameters:
fastLength, slowLength, and signalLength represent the standard MACD settings.
Instead of relying solely on MACD crossovers, it introduces scoring parameters for histogram direction (histside), indicator direction (indiside), and signal cross (crossscore). This allows for a more nuanced decision-making process when determining buy and sell signals.
Multi-Timeframe Analysis (MTF):
The strategy compares the current timeframe's MACD score with that of a higher timeframe (HTF). It dynamically selects the higher timeframe based on the current timeframe. For example, if the current chart period is 1, it will select 5 as the higher timeframe.
This MTF approach aims to align trades with broader trends, filtering out false signals that could be present when analyzing only a single timeframe.
Scoring System:
A custom scoring system (count() function) is used to evaluate buy and sell signals. This includes calculations based on the direction and momentum of MACD (indi) and the histogram. The score is used to determine the strength of signals.
Positive scores indicate bullish sentiment, while negative scores indicate bearish sentiment.
This scoring mechanism aims to reduce the influence of noise and provide more reliable entries.
Entry Conditions:
Long Condition: When the Result value (a combination of MTF and current MACD analysis) changes and becomes positive, a long entry is triggered.
Short Condition: When the Result changes and becomes negative, a short entry is initiated.
Stop Loss Mechanism:
The countstop() function calculates dynamic stop loss values for both long and short trades. It is based on the Average True Range (ATR) multiplied by a factor (Mult), providing adaptive stop loss levels depending on market volatility.
The stop loss is plotted on the chart to show potential risk levels for open trades, with the line appearing only if shotsl is enabled.
How to Use the Strategy
To properly use the strategy, follow these steps:
Parameter Optimization:
Adjust the input parameters such as fastLength, slowLength, and signalLength to tune the MACD indicator to the specific asset you’re trading. The values provided are typical defaults, but optimizing these values based on backtesting can help improve performance.
Customize the scoring parameters (crossscore, indiside, histside) to balance how much weight you want to put on the direction, histogram, and cross events of the MACD indicator.
Select Appropriate Timeframes:
This strategy employs a multi-timeframe (MTF) approach, so it's important to understand how the higher timeframe (HTF) is selected based on the current timeframe. For instance, if you are trading on a 5-minute chart, the higher timeframe will be 15 minutes, which helps filter out lower timeframe noise.
Ensure you understand the relationship between the timeframe you’re using and the HTF it automatically selects. The strategy’s effectiveness can vary depending on how these timeframes align with the asset’s overall volatility.
Run Backtests:
Always backtest the strategy over historical data to determine its reliability for the asset and timeframes you’re interested in. Note that the MTF approach may require substantial data to capture how different timeframes interact.
Use the backtest results to adjust the scoring parameters or the Stop Loss Factor (Mult) for better risk management.
Stop Loss Usage:
The stop loss is calculated dynamically using ATR, which means that it adjusts with changing volatility. This can be useful to avoid being stopped out too often during periods of increased volatility.
The shotsl parameter can be set to true to visualize the stop loss line on the chart. This helps to monitor the protection level and make better decisions regarding holding or closing a trade manually.
Entry Signals and Trade Execution:
Look for changes in the Result value to determine entry points. For a long position, the Result needs to become positive, and for a short position, it must be negative.
Note that the strategy's entries are more conservative because it waits for the Result to confirm the direction using multiple factors, which helps filter out false breakouts.
Risk Management:
The adaptive stop loss mechanism reduces the risk by basing the stop level on market volatility. However, you must still consider additional risk management practices such as position sizing and profit targets.
Given the scoring mechanism, it might not enter trades frequently, which means using this strategy may result in fewer but potentially more accurate trades. It’s important to be patient and not force trades that don’t align with the calculated results.
Real-Time Monitoring:
Make sure to monitor trades actively. Since the strategy recalculates the score on each bar, real-time changes in the Result value could provide exit opportunities even if the stop loss isn't triggered.
Summary
The "MACD Enhanced Strategy MTF with Stop Loss " is a sophisticated version of the MACD strategy, enhanced with multi-timeframe analysis and adaptive stop loss. Properly using it involves optimizing MACD and scoring parameters, selecting suitable timeframes, and actively managing entries and exits based on a combination of scoring and volatility-based stop losses. Always conduct thorough backtesting before applying it in a live environment to ensure the strategy performs well on the asset you're trading.
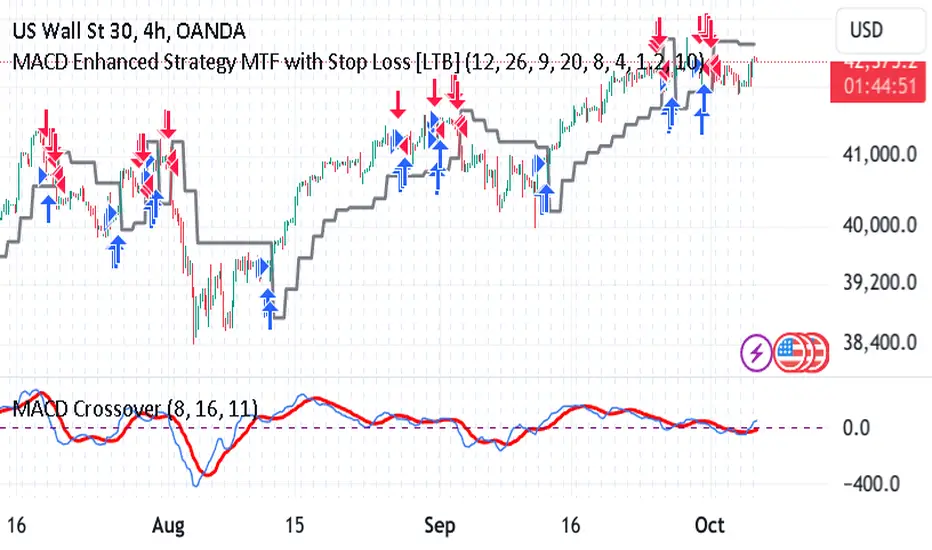
Hyperbolic Tangent Volatility Stop [InvestorUnknown]The Hyperbolic Tangent Volatility Stop (HTVS) is an advanced technical analysis tool that combines the smoothing capabilities of the Hyperbolic Tangent Moving Average (HTMA) with a volatility-based stop mechanism. This indicator is designed to identify trends and reversals while accounting for market volatility.
Hyperbolic Tangent Moving Average (HTMA):
The HTMA is at the heart of the HTVS. This custom moving average uses a hyperbolic tangent transformation to smooth out price fluctuations, focusing on significant trends while ignoring minor noise. The transformation reduces the sensitivity to sharp price movements, providing a clearer view of the underlying market direction.
The hyperbolic tangent function (tanh) is commonly used in mathematical fields like calculus, machine learning and signal processing due to its properties of “squashing” inputs into a range between -1 and 1. The function provides a non-linear transformation that can reduce the impact of extreme values while retaining a certain level of smoothness.
tanh(x) =>
e_x = math.exp(x)
e_neg_x = math.exp(-x)
(e_x - e_neg_x) / (e_x + e_neg_x)
The HTMA is calculated by applying a non-linear transformation to the difference between the source price and its simple moving average, then adjusting it using the standard deviation of the price data. The result is a moving average that better tracks the real market direction.
htma(src, len, mul) =>
tanh_src = tanh((src - ta.sma(src, len)) * mul) * ta.stdev(src, len) + ta.sma(src, len)
htma = ta.sma(tanh_src, len)
Important Note: The Hyperbolic Tangent function becomes less accurate with very high prices. For assets priced above 100,000, the results may deteriorate, and for prices exceeding 1 million, the function may stop functioning properly. Therefore, this indicator is better suited for assets with lower prices or lower price ratios.
Volatility Stop (VolStop):
HTVS employs a Volatility Stop mechanism based on the Average True Range (ATR). This stop dynamically adjusts based on market volatility, ensuring that the indicator adapts to changing conditions and avoids false signals in choppy markets.
The VolStop follows the price, with a higher ATR pushing the stop farther away to avoid premature exits during volatile periods. Conversely, when volatility is low, the stop tightens to lock in profits as the trend progresses.
The ATR Length and ATR Multiplier are customizable, allowing traders to control how tightly or loosely the stop follows the price.
pine_volStop(src, atrlen, atrfactor) =>
if not na(src)
var max = src
var min = src
var uptrend = true
var float stop = na
atrM = nz(ta.atr(atrlen) * atrfactor, ta.tr)
max := math.max(max, src)
min := math.min(min, src)
stop := nz(uptrend ? math.max(stop, max - atrM) : math.min(stop, min + atrM), src)
uptrend := src - stop >= 0.0
if uptrend != nz(uptrend , true)
max := src
min := src
stop := uptrend ? max - atrM : min + atrM
Backtest Mode:
HTVS includes a built-in backtest mode, allowing traders to evaluate the indicator's performance on historical data. In backtest mode, it calculates the cumulative equity curve and compares it to a simple buy and hold strategy.
Backtesting features can be adjusted to focus on specific signal types, such as Long Only, Short Only, or Long & Short.
An optional Buy and Hold Equity plot provides insight into how the indicator performs relative to simply holding the asset over time.
The indicator includes a Hints Table, which provides useful recommendations on how to best display the indicator for different use cases. For example, when using the overlay mode, it suggests displaying the indicator in the same pane as price action, while backtest mode is recommended to be used in a separate pane for better clarity.
The Hyperbolic Tangent Volatility Stop offers traders a balanced approach to trend-following, using the robustness of the HTMA for smoothing and the adaptability of the Volatility Stop to avoid whipsaw trades during volatile periods. With its backtesting features and alert system, this indicator provides a comprehensive toolkit for active traders.
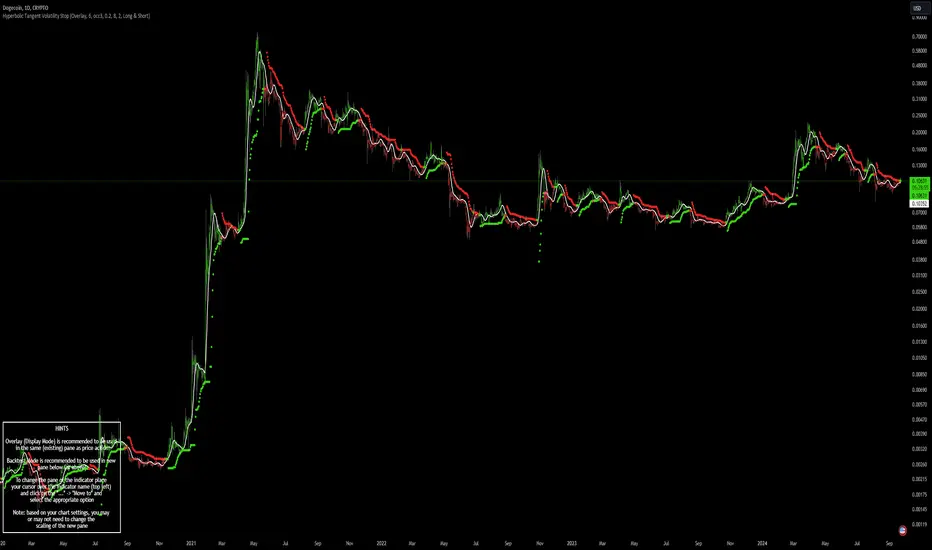
Ichimoku Crosses_RSI_AITIchimoku Crosser_RSI_AIT
Overview
The "Ichimoku Cloud Crosses_AIT" strategy is a technical trading strategy that combines the Ichimoku Cloud components with the Relative Strength Index (RSI) to generate trade signals. This strategy leverages the crossovers of the Tenkan-sen and Kijun-sen lines of the Ichimoku Cloud, along with RSI levels, to identify potential entry and exit points for long and short trades. This guide explains the strategy components, conditions, and how to use it effectively in your trading.
1. Strategy Parameters
User Inputs
Tenkan-sen Period (tenkanLength): Default value is 21. This is the period used to calculate the Tenkan-sen line (conversion line) of the Ichimoku Cloud.
Kijun-sen Period (kijunLength): Default value is 120. This is the period used to calculate the Kijun-sen line (base line) of the Ichimoku Cloud.
Senkou Span B Period (senkouBLength): Default value is 52. This is the period used to calculate the Senkou Span B line (leading span B) of the Ichimoku Cloud.
RSI Period (rsiLength): Default value is 14. This period is used to calculate the Relative Strength Index (RSI).
RSI Long Entry Level (rsiLongLevel): Default value is 60. This level indicates the minimum RSI value for a long entry signal.
RSI Short Entry Level (rsiShortLevel): Default value is 40. This level indicates the maximum RSI value for a short entry signal.
2. Strategy Components
Ichimoku Cloud
Tenkan-sen: A short-term trend indicator calculated as the simple moving average (SMA) of the highest high and the lowest low over the Tenkan-sen period.
Kijun-sen: A medium-term trend indicator calculated as the SMA of the highest high and the lowest low over the Kijun-sen period.
Senkou Span A: Calculated as the average of the Tenkan-sen and Kijun-sen, plotted 26 periods ahead.
Senkou Span B: Calculated as the SMA of the highest high and lowest low over the Senkou Span B period, plotted 26 periods ahead.
Chikou Span: The closing price plotted 26 periods behind.
Relative Strength Index (RSI)
RSI: A momentum oscillator that measures the speed and change of price movements. It ranges from 0 to 100 and is used to identify overbought or oversold conditions.
3. Entry and Exit Conditions
Entry Conditions
Long Entry:
The Tenkan-sen crosses above the Kijun-sen (bullish crossover).
The RSI value is greater than or equal to the rsiLongLevel.
Short Entry:
The Tenkan-sen crosses below the Kijun-sen (bearish crossover).
The RSI value is less than or equal to the rsiShortLevel.
Exit Conditions
Exit Long Position: The Tenkan-sen crosses below the Kijun-sen.
Exit Short Position: The Tenkan-sen crosses above the Kijun-sen.
4. Visual Representation
Tenkan-sen Line: Plotted on the chart. The color changes based on its relation to the Kijun-sen (green if above, red if below) and is displayed with a line width of 2.
Kijun-sen Line: Plotted as a white line with a line width of 1.
Entry Arrows:
Long Entry: Displayed as a yellow triangle below the bar.
Short Entry: Displayed as a fuchsia triangle above the bar.
5. How to Use
Apply the Strategy: Apply the "Ichimoku Cloud Crosses_AIT" strategy to your chart in TradingView.
Configure Parameters: Adjust the strategy parameters (Tenkan-sen, Kijun-sen, Senkou Span B, and RSI settings) according to your trading preferences.
Interpret the Signals:
Long Entry: A yellow triangle appears below the bar when a long entry signal is generated.
Short Entry: A fuchsia triangle appears above the bar when a short entry signal is generated.
Monitor Open Positions: The strategy automatically exits positions based on the defined conditions.
Backtesting and Live Trading: Use the strategy for backtesting and live trading. Adjust risk management settings in the strategy properties as needed.
Conclusion
The "Ichimoku Cloud Crosses_AIT" strategy uses Ichimoku Cloud crossovers and RSI to generate trading signals. This strategy aims to capture market trends and potential reversals, providing a structured way to enter and exit trades. Make sure to backtest and optimize the strategy parameters to suit your trading style and market conditions before using it in a live trading environment.
