Multi-Timeframe SFP + SMTImportant: Please Read First
This indicator is not a "one size fits all" solution. It is a professional and complex tool that requires you to learn how to use it, in addition to backtesting different settings to discover what works best for your specific trading style and the assets you trade. The default settings provided are my personal preferences for trading higher-timeframe setups, but you are encouraged to experiment and find your own optimal configuration.
Please note that while this initial version is solid, it may still contain small errors or bugs. I will be actively working on improving the indicator over time. Also, be aware that the script is not written for maximum efficiency and may be resource-intensive, but this should not pose a problem for most users.
The source code for this indicator is open. If you truly want to understand precisely how all the logic works, you can copy and paste the code into an AI assistant like Gemini or ChatGPT and ask it to explain any part of the script to you.
Author's Preferred Settings (Guideline)
As a starting point, here are the settings I personally use for my trading:
SFP Timeframe: 4-Hour (Strength: 5-5)
Max Lookback: 35 Bars
Raid Expiration: 1 Bar
SFP Lines Limit: 1
SMT Timeframe 1: 30-Minute (Strength: 2-2) with 3-Minute LTF Detection.
SMT Timeframe 2: 15-Minute (Strength: 3-3) with 3-Minute LTF Detection.
SMT Timeframe 3: 1-Hour (Strength: 1-1) with 3-Minute LTF Detection.
SMT Timeframe 4: 15-Minute (Strength: 1-1) with 3-Minute LTF Detection.
Multi-Timeframe SMT: An Overview
This indicator is a powerful tool designed to identify high-probability trading setups by combining two key institutional concepts: Swing Failure Patterns (SFP) on a higher timeframe and Smart Money Technique (SMT) divergences on a lower timeframe. A key feature is the ability to configure and run up to four independent SMT analyses simultaneously, allowing you to monitor for divergences across multiple timeframes (e.g., 15m, 1H, 4H) from a single indicator.
Its primary purpose is to generate automated signals through TradingView's alert system. By setting up alerts, the script runs server-side, monitoring the market for you. When a setup presents itself, it will send a push notification to your device, allowing you to personally evaluate the trade without being tied to your screen.
The Strategy: HTF Liquidity Sweeps into LTF SMT
The core strategy is built on a classic institutional trading model:
Wait for a liquidity sweep on a significant high timeframe (e.g., 4-hour, Daily).
Once liquidity is taken, look for a confirmation of a shift in market structure on a lower timeframe.
This indicator uses an SMT divergence as that confirmation signal, indicating that smart money may be stepping in to reverse the price.
How It Works: The Two-Step Process
The indicator's logic follows a precise two-step process to generate a signal:
Step 1: The Swing Failure Pattern (SFP)
First, the indicator identifies a high-timeframe liquidity sweep. This is configured in the "Swing Failure Pattern (SFP) Timeframe" settings.
It looks for a candle that wicks above a previous high (or below a previous low) but then closes back within the range of that pivot. This action is known as a "raid" or a "swing failure," suggesting the move failed to find genuine momentum.
Step 2: The SMT Divergence
The moment a valid SFP is confirmed, the indicator's multiple SMT engines activate.
Each engine begins monitoring the specific SMT timeframe you have configured (e.g., "SMT Timeframe 1," "SMT Timeframe 2," etc.) for a Smart Money Technique (SMT) divergence.
An SMT divergence occurs when two closely correlated assets fail to move in sync. For example, after a raid on a high, Asset A makes a new high, but Asset B fails to do so. This disagreement suggests weakness and a potential reversal.
When the script finds this divergence, it plots the SMT line and triggers an alert.
The Power of Alerts
The true strength of this indicator lies in its alert capabilities. You can create alerts for both unconfirmed and confirmed SMTs.
Enable Alerts LTF Detection: These alerts trigger when an unconfirmed, potential SMT is spotted on the lower "LTF Detection" timeframe. While not yet confirmed, these early alerts can notify you of a potential move before it fully happens, allowing you to be ahead of the curve and find the best possible trade entries.
Enable Alerts Confirmed SMT: These alerts trigger only when a permanent, confirmed SMT line is plotted on your chosen SMT timeframe. These signals are more reliable but occur later than the early detection alerts.
Key Concepts Explained
What is Pivot Strength?
Pivot Strength determines how significant a high or low needs to be to qualify as a valid structural point. A setting of 5-5, for example, means that for a candle's high to be considered a valid pivot high, its high must be higher than the highs of the 5 candles to its left and the 5 candles to its right.
Higher Strength (e.g., 5-5, 8-8): Creates fewer, but more significant, pivots. This is ideal for identifying major structural highs and lows on higher timeframes.
Lower Strength (e.g., 2-2, 3-3): Creates more pivots, making it suitable for identifying the smaller shifts in momentum on lower timeframes.
Raid Expiration & Validity
An SFP signal is not valid forever. The "Raid Expiration" setting determines how many SFP timeframe bars can pass after a raid before that signal is considered "stale" and can no longer be used to validate an SMT. This ensures your SMT divergences are always in response to recent liquidity sweeps.
Why You Must Be on the Right Chart Timeframe to See SMT Lines
Pine Script™ has a fundamental rule: an indicator running on a chart can only "see" the bars of that chart's timeframe or higher.
When the SMT logic is set to the 15-minute timeframe, it calculates its pivots based on 15-minute data. To accurately plot lines connecting these pivots, you must be on a 15-minute chart or lower (e.g., 5-minute, 1-minute).
If you are on a higher timeframe chart, like the 1-hour, the 15-minute bars do not exist on that chart, so the indicator has no bars to draw the lines on.
This is precisely why the alert system is so powerful. You can set your alert to run on the 15-minute timeframe, and TradingView's servers will monitor that timeframe for you, sending a notification regardless of what chart you are currently viewing.
在腳本中搜尋"backtesting"

Trading Hours Filterfor those of us with certain trading hours and schedules and wait for certain setups, this is great for backtesting or live testing trade setups in your timeframe. Adjust times in pine editor as needed.

DeltaTrace ForecastDeltaTrace Forecast is a forward-looking projection tool that visualizes the probable directional path of price using a multi-timeframe momentum model rooted in volatility-adjusted nonlinear dynamics. Rather than relying on traditional indicators that react to price after the fact, DeltaTrace estimates future price motion by tracing the progression of momentum changes across expanding timeframes—then scaling those deltas using adaptive volatility to forecast a plausible path forward.
At its core, DeltaTrace constructs a momentum vector from a series of smoothed z-scores derived from increasing multiples of the current chart's timeframe. These z-scores are normalized using a hyperbolic tangent function (tanh), which compresses extreme values and emphasizes meaningful deviations without being overly sensitive to outliers. This nonlinear normalization ensures that explosive moves are weighted with less distortion, while still preserving the shape and direction of the underlying trend.
Once the z-scores are calculated for a range of 12 timeframes (from 1× the current timeframe up to 12×), the indicator computes the first difference between each adjacent pair. These differences—or deltas—represent the change in momentum from one timeframe to the next. In this structure, a strong positive delta implies momentum is strengthening as we look into higher timeframes, while a negative delta reflects waning or reversing strength.
However, not all deltas are treated equally. To make the projection adaptive to market volatility and temporally meaningful, each delta is scaled by the square root of its corresponding timeframe multiple, weighted by the ATR (Average True Range) of the base timeframe. This square-root volatility scaling mirrors the behavior of Brownian motion and reflects the natural geometric diffusion of price over time. By applying this scaling, the model tempers its forecast according to recent volatility while maintaining proportional distance over longer time horizons.
The result is a chain of projected price steps—11 in total—starting from the current closing price. These steps are cumulative, meaning each one builds upon the previous, forming a continuously adjusted polyline that represents the most recent forecast path of price. Each point in the forecast line is directional: if the next projected point is above the last, the segment is colored green (upward momentum); if below, it is colored red (downward momentum). This color coding gives immediate visual feedback on the nature of the projected path and allows for intuitive at-a-glance interpretation.
What makes DeltaTrace unique is its combination of ideas from signal processing, time-series momentum analysis, and volatility theory. Instead of relying on static support/resistance levels or lagging moving averages, it dynamically adapts to both momentum curvature and volatility structure. This allows it to be used not just for trend confirmation, but also for top-down bias fading, reversal anticipation, and path-following strategies.
Traders can use DeltaTrace in a variety of ways depending on their style:
For trend traders, a consistent upward or downward curve in the forecast suggests directional continuation and can be used for position sizing or confirmation of bias.
For mean-reversion traders, exaggerated divergence between the current price and the first few forecast points may indicate temporary exhaustion or overextension.
For scalpers or intraday traders, the short-term bend or flattening of the initial segments can reveal early signs of weakening momentum or build-up before breakout.
For swing traders, the full shape of the polyline gives an evolving map of market rhythm across time compression, allowing for context-aware decision-making.
It’s important to understand that this is a path projection tool, not a precise price target predictor. The forecast does not attempt to predict exact price levels at exact bars, but rather illustrates how the market might evolve if the current multi-timeframe momentum structure persists. Like all models, it should be interpreted probabilistically and used in conjunction with other confirmation signals, risk management tools, or strategy frameworks.
Inputs allow customization of the z-score calculation length and ATR window to tune the sensitivity of the model. The color scheme for up/down forecast segments can also be adjusted for personal preference. Additionally, users can toggle the polyline forecast on or off, which may be useful for pairing this indicator with others in a crowded chart layout.
Because the forecast path is calculated only on the last bar, it does not repaint or shift once the candle closes—preserving historical accuracy for visual inspection and backtesting reference. However, it is also sensitive to changes in volatility and momentum structure, meaning it updates each bar as conditions evolve, making it most effective in real-time decision support.
DeltaTrace Forecast is particularly well-suited for traders who want a deeper understanding of hidden momentum shifts across timeframes without relying on traditional trend-following tools. It reveals the shape of future possibility based on present dynamics, offering a compact yet powerful visualization of directional bias, transition risk, and path strength.
To maximize its utility, consider pairing DeltaTrace with volume profiles, order flow tools, higher timeframe zones, or market structure indicators. Used in context, it becomes a powerful companion to both systematic and discretionary trading styles—especially for those who appreciate a blend of mathematics and intuition in their market analysis.
This indicator is not based on magic or black-box logic; every component—from the z-score standardization to the volatility-adjusted deltas—is fully transparent and grounded in simple, interpretable mechanics. If you're looking for a reliable way to visualize multi-timeframe bias and momentum diffusion, DeltaTrace provides a unique lens through which to interpret future potential in an ever-shifting market landscape.

MSTY-WNTR Rebalancing SignalMSTY-WNTR Rebalancing Signal
## Overview
The **MSTY-WNTR Rebalancing Signal** is a custom TradingView indicator designed to help investors dynamically allocate between two YieldMax ETFs: **MSTY** (YieldMax MSTR Option Income Strategy ETF) and **WNTR** (YieldMax Short MSTR Option Income Strategy ETF). These ETFs are tied to MicroStrategy (MSTR) stock, which is heavily influenced by Bitcoin's price due to MSTR's significant Bitcoin holdings.
MSTY benefits from upward movements in MSTR (and thus Bitcoin) through a covered call strategy that generates income but caps upside potential. WNTR, on the other hand, provides inverse exposure, profiting from MSTR declines but losing in rallies. This indicator uses Bitcoin's momentum and MSTR's relative strength to signal when to hold MSTY (bullish phases), WNTR (bearish phases), or stay neutral, aiming to optimize returns by switching allocations at key turning points.
Inspired by strategies discussed in crypto communities (e.g., X posts analyzing MSTR-linked ETFs), this indicator promotes an active rebalancing approach over a "set and forget" buy-and-hold strategy. In simulated backtests over the past 12 months (as of August 4, 2025), the optimized version has shown potential to outperform holding 100% MSTY or 100% WNTR alone, with an illustrative APY of ~125% vs. ~6% for MSTY and ~-15% for WNTR in one scenario.
**Important Disclaimer**: This is not financial advice. Past performance does not guarantee future results. Always consult a financial advisor. Trading involves risk, and you could lose money. The indicator is for educational and informational purposes only.
## Key Features
- **Momentum-Based Signals**: Uses a Simple Moving Average (SMA) on Bitcoin's price to detect bullish (price > SMA) or bearish (price < SMA) trends.
- **RSI Confirmation**: Incorporates MSTR's Relative Strength Index (RSI) to filter signals, avoiding overbought conditions for MSTY and oversold for WNTR.
- **Visual Cues**:
- Green upward triangle for "Hold MSTY".
- Red downward triangle for "Hold WNTR".
- Yellow cross for "Switch" signals.
- Background color: Green for MSTY, red for WNTR.
- **Information Panel**: A table in the top-right corner displays real-time data: BTC Price, SMA value, MSTR RSI, and current Allocation (MSTY, WNTR, or Neutral).
- **Alerts**: Configurable alerts for holding MSTY, holding WNTR, or switching.
- **Optimized Parameters**: Defaults are tuned (SMA: 10 days, RSI: 15 periods, Overbought: 80, Oversold: 20) based on simulations to reduce whipsaws and capture trends effectively.
## How It Works
The indicator's logic is straightforward yet effective for volatile assets like Bitcoin and MSTR:
1. **Primary Trigger (Bitcoin Momentum)**:
- Calculate the SMA of Bitcoin's closing price (default: 10-day).
- Bullish: Current BTC price > SMA → Potential MSTY hold.
- Bearish: Current BTC price < SMA → Potential WNTR hold.
2. **Secondary Filter (MSTR RSI Confirmation)**:
- Compute RSI on MSTR stock (default: 15-period).
- For bullish signals: If RSI > Overbought (80), signal Neutral (avoid overextended rallies).
- For bearish signals: If RSI < Oversold (20), signal Neutral (avoid capitulation bottoms).
3. **Allocation Rules**:
- Hold 100% MSTY if bullish and not overbought.
- Hold 100% WNTR if bearish and not oversold.
- Neutral otherwise (e.g., during choppy or extreme markets) – consider holding cash or avoiding trades.
4. **Rebalancing**:
- Switch signals trigger when the hold changes (e.g., from MSTY to WNTR).
- Recommended frequency: Weekly reviews or on 5% BTC moves to minimize trading costs (aim for 4-6 trades/year).
This approach leverages Bitcoin's influence on MSTR while mitigating the risks of MSTY's covered call drag during downtrends and WNTR's losses in uptrends.
## Setup and Usage
1. **Chart Requirements**:
- Apply this indicator to a Bitcoin chart (e.g., BTCUSD on Binance or Coinbase, daily timeframe recommended).
- Ensure MSTR stock data is accessible (TradingView supports it natively).
2. **Adding to TradingView**:
- Open the Pine Editor.
- Paste the script code.
- Save and add to your chart.
- Customize inputs if needed (e.g., adjust SMA/RSI lengths for different timeframes).
3. **Interpretation**:
- **Green Background/Triangle**: Allocate 100% to MSTY – Bitcoin is in an uptrend, MSTR not overbought.
- **Red Background/Triangle**: Allocate 100% to WNTR – Bitcoin in downtrend, MSTR not oversold.
- **Yellow Switch Cross**: Rebalance your portfolio immediately.
- **Neutral (No Signal)**: Panel shows "Neutral" – Hold cash or previous position; reassess weekly.
- Monitor the panel for key metrics to validate signals manually.
4. **Backtesting and Strategy Integration**:
- Convert to a strategy script by changing `indicator()` to `strategy()` and adding entry/exit logic for automated testing.
- In simulations (e.g., using Python or TradingView's backtester), it has outperformed buy-and-hold in volatile markets by ~100-200% relative APY, but results vary.
- Factor in fees: ETF expense ratios (~0.99%), trading commissions (~$0.40/trade), and slippage.
5. **Risk Management**:
- Use with a diversified portfolio; never allocate more than you can afford to lose.
- Add stop-losses (e.g., 10% trailing) to protect against extreme moves.
- Rebalance sparingly to avoid over-trading in sideways markets.
- Dividends: Reinvest MSTY/WNTR payouts into the current hold for compounding.
## Performance Insights (Simulated as of August 4, 2025)
Based on synthetic backtests modeling the last 12 months:
- **Optimized Strategy APY**: ~125% (by timing switches effectively).
- **Hold 100% MSTY APY**: ~6% (gains from BTC rallies offset by downtrends).
- **Hold 100% WNTR APY**: ~-15% (losses in bull phases outweigh bear gains).
In one scenario with stronger volatility, the strategy achieved ~4533% APY vs. 10% for MSTY and -34% for WNTR, highlighting its potential in dynamic markets. However, these are illustrative; real results depend on actual BTC/MSTR movements. Test thoroughly on historical data.
## Limitations and Considerations
- **Data Dependency**: Relies on accurate BTC and MSTR data; delays or gaps can affect signals.
- **Market Risks**: Bitcoin's volatility can lead to false signals (whipsaws); the RSI filter helps but isn't perfect.
- **No Guarantees**: This indicator doesn't predict the future. MSTR's correlation to BTC may change (e.g., due to regulatory events).
- **Not for All Users**: Best for intermediate/advanced traders familiar with ETFs and crypto. Beginners should paper trade first.
- **Updates**: As of August 4, 2025, this is version 1.0. Future updates may include volume filters or EMA options.
If you find this indicator useful, consider leaving a like or comment on TradingView. Feedback welcome for improvements!

ALPHA 999This indicator is designed to provide traders with clear and reliable signals by combining essential technical tools into one simplified framework. Whether you’re trading crypto, stocks, or forex, this tool helps identify potential entry and exit points using . It is well-suited for both intraday and swing traders, offering customizable inputs, multi-timeframe compatibility, and real-time alerts. The indicator displays intuitive visual cues directly on the chart, making it easy to interpret market conditions and respond quickly. Ideal for traders who prefer clean charts with actionable signals, this tool enhances decision-making without overwhelming complexity. While powerful on its own, it can be paired with other indicators for greater confirmation and accuracy. Please note: this indicator is for educational purposes only and should be used with proper risk management and backtesting before applying to live trades.
MA Crossover Detector
The Moving Average Crossover Detector is a custom indicator that visually shows buy and sell signals clearly on the chart. based on the crossing of two moving averages — a popular and beginner-friendly tool in technical analysis.
It plots two moving averages — One fast (short period) and one slow (long period) — and highlights crossover points:
✅ Buy Signal (Golden Cross) – When the fast MA crosses above the slow MA.
❌ Sell Signal (Death Cross) – When the fast MA crosses below the slow MA.
✅ Features
Visual: Clearly shows crossovers on the chart.
Customizable: Choose periods, types, styles, etc.
Alert-ready: You can set alerts for crossovers.
The Moving Average (MA) Crossover Strategy is one of the simplest and most widely used strategies in technical analysis for trading stocks, forex, crypto, and other markets. It relies on the interaction between two moving averages to generate buy and sell signals.
Core Components
Short-Term Moving Average (Fast MA) : Reacts quickly to price changes (e.g., 9-period or 20-period).
Long-Term Moving Average (Slow MA) : Reacts more slowly to price changes (e.g., 21-period or 200-period).
How the Strategy Works
Bullish Crossover (Golden Cross):
Occurs when the fast MA crosses above the slow MA. Interpreted as a buy signal, indicating a potential uptrend.
Bearish Crossover (Death Cross):
Occurs when the fast MA crosses below the slow MA. Interpreted as a sell signal, indicating a potential downtrend.
Common Variants
Short-term trading
9 EMA
21 EMA
Swing trading
20 SMA
50 SMA
Long-term investing
50 SMA
200 SMA
Pros
Easy to understand and implement
Works well in trending markets
Can be automated for backtesting and execution
Cons
Lagging indicator: MAs are based on past prices, so signals come after the move has started.
Choppy markets = whipsaws: Generates false signals in sideways/range-bound conditions.
May underperform in volatile or mean-reverting environments
Tips for Improvement
Use confirmation tools : e.g., RSI, MACD, volume analysis, price action
Add filters : Trend filter (ADX), volatility filter (ATR), or time filter (session-based)
Combine with price structure : Support/resistance, breakouts, pullbacks

Canonical Momenta Indicator [T1][T69]📌 Overview
The Canonical Momenta Indicator models trend pressure using a Lagrangian-based momentum engine combined with reflexivity theory to detect bursts in price movement influenced by herd behavior and volume acceleration.
🧠 Features
Lagrangian-based kinetic model combining velocity and acceleration
Reflexivity burst detection with directional scoring
Adaptive momentum-weighted output (adaptiveCMI)
Buy 🐋 / Sell 🐻 labels when reflexivity confirms direction
Fully parameterized for customization
⚙️ How to Use
This indicator helps traders:
Detect reflexive bursts in market activity driven by sharp price movement + volume spikes
Capture herd-driven directional moves early.
Gauge market pressure using a kinetic-potential energy model.
Suggested signals:
🐋 Reflexive Up: Strong bullish momentum spike confirmed by volume and positive lagrangian pressure
🐻 Reflexive Down: Strong bearish dump confirmed by volume and negative lagrangian burst
🔧 Configuration
MA Lookback Length - Smoothing for baseline price & energy calculation
Reflexivity Momentum Threshold - Price momentum trigger for burst detection
Reflexivity Lookback - Period over which bursts are counted
Reflexivity Window - Minimum burst sum to trigger signal label
Volume Spike Threshold - % above average volume to qualify as burst
📊 Behavior Description
The indicator computes a Lagrangian energy:
Kinetic Energy = (velocity² + 0.5 * acceleration²)
Potential Energy = deviation from moving average (distance²)
Lagrangian = Potential − Kinetic (higher = overextension)
Then, reflexive bursts are triggered when:
Price is rising or falling over short window (burstMvmnt)
Volume is above average by a user-defined multiple
Each bar gets a burst score:
+1 for up-burst
−1 for down-burst
0 otherwise
⚠️ Risk Profile Based on Lookback Settings
Risk Level | Description | Recommended Lookback
🟥 High | Extremely sensitive to bursts, prone to false signals | 7–10
🟨 Moderate | Balanced reflexivity with trend confirmation | 11–20
🟩 Low | Filters out most noise, slower to react | 21+
🧪 Advanced Tips
Combine with moving average slope for trend filtering
Use divergence between adaptiveCMI and price to detect exhaustion
Works well in crypto, commodities, and volatile assets
⚠️ Limitations
Sensitive to high volatility noise if volMult is too low
Designed for higher timeframes (1H, 4H, Daily) for reliability
Doesn’t confirm direction in sideways markets — pair with other filters
📝 Disclaimer
This tool is provided for educational and informational purposes. Always do your own backtesting and use proper risk management.

BarUtils: Get Bar Index from DateLibrary "BarUtils"
getBarIndexFromDate(targetTimestamp)
Parameters:
targetTimestamp (int)
**Description**:
This utility provides a reliable way to calculate the `bar_index` of a specific calendar date, regardless of chart resolution. It's especially useful for anchoring scripts to historical events, labeling macroeconomic moments, or marking custom time-based signals that must remain consistent across timeframes.
Unlike hardcoded `bar_index - N` approaches, this function dynamically estimates the number of bars between a given `timestamp()` and the current bar using the actual time-per-bar (`time - time `). It works correctly on intraday, daily, weekly, and monthly charts.
### 💡 **Function Provided**:
import TradeTitan120/BarUtils/1
* `getBarIndexFromDate(int targetTimestamp)`
→ Returns the estimated `bar_index` that aligns with a given timestamp
### ✅ **Use Cases**:
* Marking past events like FOMC meetings, market crashes, or personal signals
* Backtesting entry/exit conditions from specific calendar dates
* Anchoring visual elements (shapes, lines, labels) across resolutions
This tool is simple, fast, and built for accuracy. Use it to enhance multi-timeframe compatibility in any script.
Combo 2/20 EMA & Bandpass Filter by TamarokDescription:
This strategy combines a 2/20 exponential moving average (EMA) crossover with a custom bandpass filter to generate buy and sell signals.
Use the Fast EMA and Slow EMA inputs to adjust trend sensitivity, and the Bandpass Filter Length, Delta, and Zones to fine-tune momentum turns.
Signals occur when both EMA and BPF agree in direction, with optional reversal and time filters.
How to use:
1. Add the script to your chart in TradingView.
2. Adjust the EMA and BP Filter parameters to match your asset’s volatility.
3. Enable ‘Reverse Signals’ to trade counter-trend, or use the time filter to limit sessions.
4. Set alerts on Long Alert and Short Alert for automated notifications.
Inspiration:
Based on HPotter’s original combo strategy (Stocks & Commodities Mar 2010).
Updated to Pine Script v6 with streamlined code and alerts.
WARNING:
For purpose educate only

2% Averaging Buy-Sell Strategy📘 Strategy Description: 2% Averaging Buy-Sell Strategy
This strategy is designed to simulate an averaging-down and scaling-out approach based on percentage-based price movements.
Entry Logic (Buy):
Initial buy of 1 lot is triggered at the start of the strategy.
Every time the price drops by 2% from the last executed buy level, the strategy adds 2 more lots.
Exit Logic (Sell):
When the price rises 2% from the last buy level, the strategy sells 2 lots.
Selling continues in batches of 2 lots as long as the upward movement continues and lots are available.
Core Idea:
This is a dynamic averaging system that increases exposure during drawdowns and reduces it during rallies, aiming to capture mean reversion or trend reversals.
Customizable Inputs:
Initial lot size
Additional lot size
Percentage threshold (default 2%)
⚠️ Note: This strategy is for simulation/backtesting purposes. It does not account for slippage, fees, or real-world order execution conditions.
Opening-Range BreakoutNote: Default trading date range looks mediocre. Set date range to "Entire History" to see full effect of the strategy. 50.91% profitable trades, 1.178 profit factor, steady profits and limited drawdown. Total P&L: $154,141.18, Max Drawdown: $18,624.36. High R^2
█ Overview
The Opening-Range Breakout strategy is a mechanical, session‑based day‑trading system designed to capture the initial burst of directional momentum immediately following the market open. It defines a user‑configurable “opening range” window, measures its high and low boundaries, then places breakout stop orders at those levels once the range closes. Built‑in filters on minimum range width, reward‑to‑risk ratios, and optional reversal logic help refine entries and manage risk dynamically.
█ How It Works
Opening‑Range Formation
Between 9:30–10:15 AM ET (configurable), the script tracks the highest high and lowest low to form the day’s opening range box.
On the first bar after the range window closes, the range high (OR_high) and low (OR_low) are “locked in.”
Range‑Width Filter
To avoid false breakouts in low‑volatility mornings, the range must be at least X% of the current price (default 0.35%).
If the measured opening-range width < minimum threshold, no orders are placed that day.
Entry & Order Placement
Long: a stop‑buy order at the opening‑range high.
Short: a stop‑sell order at the opening‑range low.
Only one side can trigger (or both if reverse logic is enabled after a losing trade).
Risk Management
Once triggered, each trade uses an ATR‑style stop-loss defined as a percentage retracement of the range (default 50% of range width).
Profit target is set at a configurable Reward/Risk Ratio (default 1.1×).
Optional: Reverse on Stop‑Loss – if the initial breakout loses, immediately reverse into the opposite side on the same day.
Session Exit
Any open positions are closed at the end of the regular trading day (default 3:45 PM ET window end, with hard flat at session close).
Visual cues are provided via green (range high) and red (range low) step‑line plots directly on the chart, allowing you to see the range box and breakout triggers in real time.
█ Why It Works
Early Momentum Capture: The first 15 – 60 minutes of trading encapsulate overnight news digestion and institutional order flow, creating a well‑defined volatility “range.”
Mechanical Discipline: Clear, rule‑based entries and exits remove emotional guesswork, ensuring consistency.
Volatility Filtering: By requiring a minimum range width, the system avoids choppy, low‑range days where false breakouts are common.
Dynamic Sizing: Stops and targets scale with the opening range, adapting automatically to each day’s volatility environment.
█ How to Use
Set Your Instruments & Timeframe
-Apply to any futures contract on a 1‑ to 5‑minute chart.
-Ensure chart timezone is set to America/New_York.
Configure Inputs
-Opening‑Range Window: e.g. “0930-1015” for a 45‑minute range.
-Min. OR Width (%): e.g. 0.35 for 0.35% of current price.
-Reward/Risk Ratio: e.g. 1.1 for a modest profit target above your stop.
-Max OR Retracement %: e.g. 50 to set stop at 50% of range width.
-One Trade Per Day: toggle to limit to a single breakout.
-Reverse on Stop Loss: toggle to flip direction after a losing breakout.
Monitor the Chart
-Watch the green and red range boundaries form during the session open.
-Orders will automatically submit on the first bar after the range window closes, conditioned on your filters.
Review & Adjust
-Backtest across multiple months to validate performance on your preferred contract.
-Tweak range duration, minimum width, and R/R multiple to fit your risk tolerance and desired win‑rate vs. expectancy balance.
█ Settings Reference
Input Defaults
Opening‑Range Window - Time window to form OR (HHMM-HHMM) - 0930–1015
Regular Trading Day - Full session for EOD flat (HHMM-HHMM) - 0930–1545
Min. OR Width (%) - Minimum OR size as % of close to trigger orders - 0.35
Reward/Risk Ratio - Profit target multiple of stop‑loss distance - 1.1
Max OR Retracement (%) - % of OR width to use as stop‑loss distance - 50
One Trade Per Day - Limit to a single breakout order per day - false
Reverse on Stop Loss - Reverse direction immediately after a losing trade - true
Disclaimer
This strategy description and any accompanying code are provided for educational purposes only and do not constitute financial advice or a solicitation to trade. Futures trading involves substantial risk, including possible loss of capital. Past performance is not indicative of future results. Traders should assess their own risk tolerance and conduct thorough backtesting and forward-testing before committing real capital.

逆勢布林+RSI策略 for SOL可以直接套用到 SOLUSDT, SOLPERP, 或其他 SOL 合約。
在策略回測介面中選擇 5min 或 15min 看策略表現。
若要調整停利%或 RSI 數值,改變 rsi < 25 與 (shortEntryPrice - close) / shortEntryPrice >= 0.035 即可。
This can be directly applied to SOLUSDT, SOLPERP, or other SOL futures.
In the strategy backtesting interface, select 5-minute or 15-minute periods to view strategy performance.
To adjust the take-profit percentage or RSI value, set RSI < 25 and (shortEntryPrice - close) / shortEntryPrice >= 0.035.

Gold 3min Trading Pro [XAU/USD]# Gold 3min Trading Pro - User Guide
## Overview
This is a professional scalping indicator specifically designed for Gold (XAU/USD) trading on 3-minute timeframes. It combines multiple technical analysis methods to provide high-probability entry signals for short-term trading.
## Key Features
### 1. Multi-Timeframe Trend Analysis
- **Major Trend**: Analyzes 15min, 1H, and 4H timeframes using moving averages
- **Short-term Trend**: Focuses on 3-minute price action and moving average alignment
- **Trend Strength**: Rated from 1-3 based on timeframe agreement
### 2. Core Indicators
- **RSI (9-period)**: Momentum oscillator for overbought/oversold conditions
- **Stochastic (9-period)**: %K and %D lines for entry timing
- **MACD**: Additional trend confirmation
- **Volume Analysis**: Detects volume spikes for signal validation
- **ATR-based Volatility Filter**: Ensures adequate market movement
### 3. Signal Types
- **Primary Signals**: Green triangles (LONG) and Red triangles (SHORT)
- **Enhanced Signals**: Stronger signals with multiple confirmations
- **Confirmation Signals**: Small circles for stochastic crossovers
## How to Use
### 1. Setup
- **Timeframe**: Use on 3-minute charts for Gold (XAU/USD)
- **Settings**: Default settings are optimized for Gold scalping
- **Session Filter**: Enable for London/New York sessions (recommended)
### 2. Entry Conditions
#### LONG Entry:
- Major trend is bullish (green background)
- Short-term trend is up or neutral
- RSI shows bullish momentum
- Stochastic indicates oversold recovery
- Volume spike confirmation
- Strong price action (bullish candle)
#### SHORT Entry:
- Major trend is bearish (red background)
- Short-term trend is down or neutral
- RSI shows bearish momentum
- Stochastic indicates overbought reversal
- Volume spike confirmation
- Strong price action (bearish candle)
### 3. Trade Management
- **Quick Target**: 50% of ATR-based calculation
- **Main Target**: Full ATR-based target
- **Stop Loss**: 60% of ATR below/above entry
- **Time Limit**: Exit if no progress within 20 bars (60 minutes)
### 4. Risk Management
- **Position Size**: Risk 1-2% of account per trade
- **Maximum Trades**: 3-5 trades per session
- **Avoid**: Low volatility periods and major news events
## Visual Elements
### Background Colors
- **Light Green**: Bullish major trend
- **Light Red**: Bearish major trend
- **Yellow**: Volume spike detected
- **Intense Colors**: Very strong trend alignment
### Chart Indicators
- **RSI Line (Blue)**: Main momentum indicator
- **Stochastic %K (Orange)**: Fast stochastic line
- **Stochastic %D (Yellow)**: Slow stochastic line
- **Horizontal Lines**: 70 (overbought), 30 (oversold), 50 (midline)
### Information Table (Top Right)
- Total signal count and performance statistics
- Current market conditions and trend strength
- RSI levels and volatility status
- Trading session information
- Last signal timing
## Alert System
### Standard Alerts
- **Scalp Long Signal**: Basic long entry signal
- **Scalp Short Signal**: Basic short entry signal
- **Premium Signals**: High-quality signals with strong confirmation
- **Trend Reversal**: Major trend change notifications
### Alert Setup
1. Right-click on chart → "Add Alert"
2. Select desired alert condition
3. Configure notification method (popup, email, webhook)
4. Set alert frequency to "Once Per Bar Close"
## Best Practices
### 1. Trading Sessions
- **Optimal**: London-NY overlap (3:00-5:00 PM EST)
- **Good**: London session (2:00-11:00 AM EST)
- **Avoid**: Asian session and major news releases
### 2. Market Conditions
- **Best**: Trending markets with normal to high volatility
- **Moderate**: Ranging markets during active sessions
- **Avoid**: Extremely low volatility or choppy conditions
### 3. Confirmation Rules
- Wait for signal triangle to appear
- Check that major trend aligns with signal direction
- Verify volume spike (yellow background)
- Ensure volatility is adequate (check info table)
### 4. Entry Timing
- Enter immediately after signal confirmation
- Use market orders for scalping speed
- Set stop loss and take profit levels immediately
## Settings Customization
### Essential Settings
- **MA Type**: EMA (recommended) or SMA
- **RSI Length**: 9 (default, can adjust 5-14)
- **Volume Threshold**: 1.8 (higher = fewer but stronger signals)
- **Volatility Filter**: Keep enabled for better signal quality
### Display Options
- **Show Scalping Signals**: Main entry signals
- **Show Performance Stats**: Information table
- **Show Trend Filter**: Background trend colors
- **Use Time Filter**: Session-based filtering
## Performance Optimization
### 1. Backtesting Tips
- Test on different market conditions
- Analyze win rate and average profit/loss
- Adjust settings based on historical performance
### 2. Signal Quality
- Higher trend strength (2-3) = better signals
- Volume confirmation improves success rate
- Enhanced signals have higher probability
### 3. Risk Control
- Never risk more than 2% per trade
- Use proper position sizing
- Stop trading after 3 consecutive losses
## Troubleshooting
### Common Issues
1. **No Signals**: Check volatility filter and session timing
2. **Too Many Signals**: Increase volume threshold or enable filters
3. **Poor Performance**: Verify timeframe (must be 3-minute) and symbol (XAU/USD)
### Support
- Ensure TradingView Pro+ subscription for multi-timeframe data
- Verify Gold symbol matches your broker's format
- Update to latest TradingView version
This indicator is designed for experienced traders familiar with scalping techniques and risk management. Always practice on demo accounts before live trading.

Vertical Time Marker Configurable (VTMC)# Vertical Time Marker Configurable (VTMC)
## Overview
The Vertical Time Marker Configurable (VTMC) is a powerful PineScript v6 indicator designed to help traders quickly identify key market times across their entire chart history. Instead of hovering over candles to check timestamps, VTMC draws clear vertical lines with customizable labels at your specified times, making it easy to spot important market sessions, news events, or personal trading windows at a glance.
## Key Features
### ⏰ Flexible Time Selection
- Set any time using an intuitive time picker (defaults to 8:30 AM Central Time)
- Automatically draws lines at your specified time across all historical data
- Perfect for marking market opens, closes, news releases, or personal trading times
### 🎨 Full Visual Customization
- **Line Color**: Choose any color (defaults to white for maximum visibility)
- **Line Style**: Solid, dashed, or dotted options
- **Line Width**: Adjustable from 1-10 pixels
- **Opacity Control**: Precise opacity slider (0-100%) for both line and text
### 🏷️ Smart Text Labels
- **Preset Options**: New York Open, New York Close, London Open, London Close, Asia Open, Asia Close
- **Custom Labels**: Enter any text for personalized marking (news events, trading windows, etc.)
- **Configurable Text**: Adjustable size (8-20px), color, and opacity
- **Smart Positioning**: Text appears just above the price action for clear visibility
### 📊 Professional Display
- Lines extend fully from top to bottom of chart
- Clean, non-intrusive design that doesn't clutter your analysis
- Works on any timeframe and market
- Historical lines persist across all chart data
## Perfect For
### Market Session Traders
- Mark key session opens and closes
- Identify overlap periods between major markets
- Track session-specific price behavior patterns
### News Traders
- Mark important economic releases (FOMC, NFP, etc.)
- Create visual reminders for scheduled events
- Track market reaction patterns around news times
### Institutional Flow Traders
- Identify key institutional activity times
- Mark order block formation periods
- Track smart money movement windows
### Personal Trading Systems
- Mark your optimal trading hours
- Create visual discipline for trading windows
- Track performance during specific time periods
## Why VTMC?
Unlike hardcoded session indicators that only work for specific markets, VTMC gives you complete flexibility to mark ANY time that matters to your trading strategy. Whether you're tracking "MY Trading Window" from 9:30-10:30 AM or marking custom news events, VTMC adapts to your specific needs.
The indicator eliminates the constant need to hover over candles to check times, instead providing instant visual reference points across your entire chart. This makes pattern recognition, backtesting, and trade timing significantly more efficient.
## Usage Tips
- Use multiple instances for different time zones or events
- Combine with other indicators for comprehensive market timing
- Customize colors to match your chart theme
- Use custom labels for personalized trading reminders
*Built with precision in PineScript v6 for reliable performance and modern TradingView compatibility.*
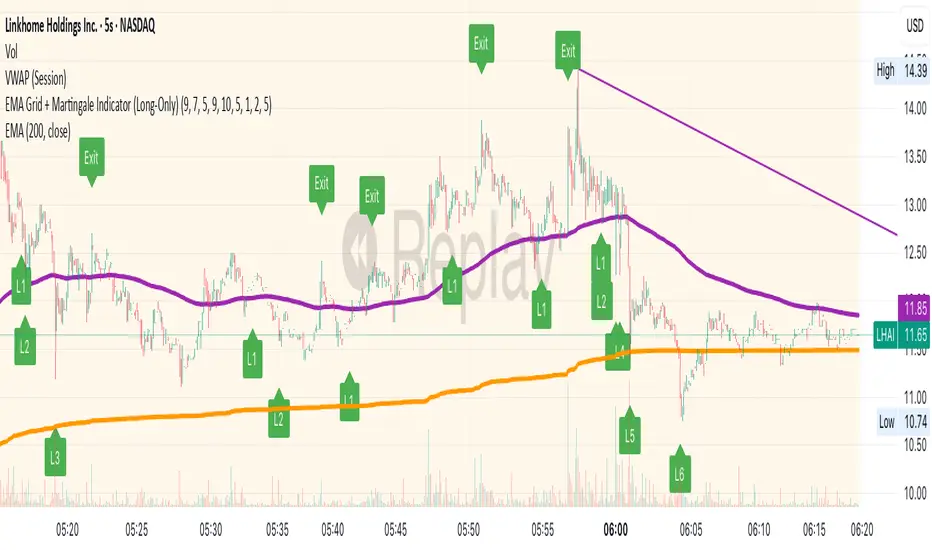
EMA Grid + Martingale Strategy (Long-Only) with CooldownTitle:
EMA Grid + Martingale Strategy (Long-Only) with Cooldown
Short Summary:
A long-only strategy combining EMA trend filters, grid-based entries, optional martingale sizing, and a cooldown feature to manage position timing and exits.
Full Description:
This strategy uses a 4-EMA trend confirmation system to detect bullish momentum, then deploys a grid-style entry method with optional martingale position sizing. It includes a cooldown mechanism to prevent reentry too soon after a completed trade cycle.
How It Works
1. Trend Confirmation: Two EMA groups (fast/slow) determine whether market conditions are bullish.
2. Initial Entry: A new position is entered when both EMA groups confirm an uptrend and no position is currently active.
3. Grid Entries: Additional long entries are placed when price drops by a defined pip distance from the last entry, respecting the maximum number of entries.
4. Martingale Sizing (Optional): Grid orders can increase in size with each level using a customizable multiplier.
5. Weighted-Average Exit: All positions close once price reaches or exceeds the average entry price plus a buffer.
6. Cooldown Timer: After closing a position set, the strategy waits a defined number of bars before opening a new grid.
Key Features
• 4 customizable EMAs for trend confirmation.
• Dynamic grid-style long entries based on pip intervals.
• Optional martingale-style position sizing.
• Weighted-average price exit logic with buffer control.
• Cooldown bar period to limit overtrading.
• Suitable for optimization and backtesting with full control over inputs.
Use Cases
• Designed for trending markets where pullbacks present entry opportunities.
• Helps manage staged entries while avoiding premature reentry.
• Ideal for testing martingale and grid-based strategies with exit precision.
Note: This strategy is for testing and educational purposes only. It does not guarantee profits and is not financial advice.

Setup: Smooth Gaussian + Adaptive Supertrend (Manual Vol)Overview
This strategy combines two powerful trend-based tools originally developed by Algo Alpha: the Smooth Gaussian Trend (simulated) and the Adaptive Supertrend. The objective is to capture sustained bullish movements in periods of controlled volatility by filtering for high-probability entries.
Entry Logic
Long Entry Conditions:
The closing price is above the Smooth Gaussian Trend line (with length = 75), and
The volatility setting from the Adaptive Supertrend is manually defined as either 2 or 3
Exit Condition:
The closing price falls below the Smooth Gaussian Trend line
This script uses a simulated version of the Gaussian Trend line via double-smoothed SMA, as the original Algo Alpha indicator is protected and cannot be accessed directly in code.
Features
Plots entry and exit signals directly on the chart
Manual toggle to enable or disable the volatility filter
Lightweight design to allow flexible backtesting even without access to proprietary indicators
Important Note
This strategy does not connect to the actual Adaptive Supertrend from Algo Alpha. Users must manually input the volatility level based on what they observe on the chart when the original indicator is also applied. The Smooth Gaussian Trend is approximated and may differ slightly from the original.
Suggested Use
Recommended timeframes: 1H, 4H, or Daily
Best used alongside the original indicators displayed on the chart
Consider incorporating additional structure, momentum, or volume filters to enhance performance
If you have suggestions or would like to contribute improvements, feel free to reach out or fork the script.

EMA Grid + Martingale Indicator (Long-Only)Title:
EMA Grid + Martingale Indicator (Long-Only)
Short Summary:
A 4-EMA trend filter combined with a grid-based entry system and optional martingale sizing to visualize staged long entries and exits in bullish markets.
Full Description:
This indicator combines a 4-EMA trend filter with a grid-based entry system and optional martingale-style position sizing to help traders visualize staged long entries and exits in trending markets.
How It Works
1. Trend Detection: Uses two sets of EMAs (fast/slow pairs) to confirm bullish momentum. A long signal is generated when both EMA groups align in an uptrend.
2. Grid Entries: After the initial long entry, additional grid levels are triggered every time price drops by the specified grid step (in pips).
3. Martingale Sizing (Optional): Each subsequent entry can increase in size based on the defined martingale factor.
4. Weighted-Average Exit: Calculates the weighted average of all grid entries and signals an exit when the price reaches or surpasses this level plus an optional buffer.
Key Features
• 4 EMA Trend Filter with fully customizable lengths.
• Dynamic grid entries with visual labels (L1, L2, etc.).
• Optional martingale position sizing.
• Weighted-average exit with adjustable buffer.
• Customizable parameters for EMAs, grid steps, max entries, and buffer pips.
• Clear chart visualization of EMAs and entry/exit levels.
Use Cases
• For traders using cost-averaging or grid strategies in bullish markets.
• Visualizes multiple entry levels and profit targets.
• Useful for backtesting and strategy planning.
Note: This indicator is for visualization and planning purposes only. It does not execute trades automatically. It does not guarantee profits and is not financial advice.
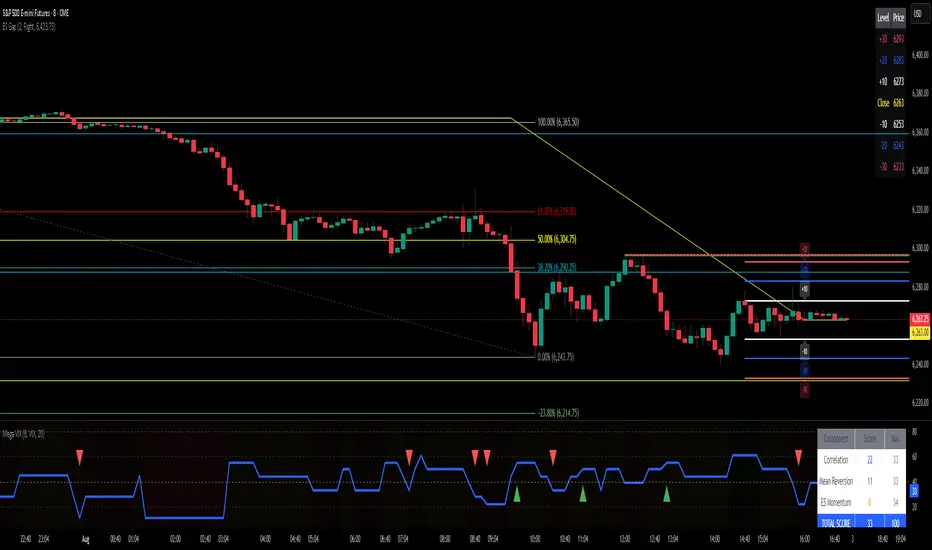
ES Gap Trading Levels# ES Gap Trading Levels
## Overview
A professional gap trading indicator designed specifically for ES Futures traders. This indicator automatically captures the closing price at 3:59 PM ET (NYSE close) and immediately displays key gap levels for the evening trading session starting at 6:00 PM ET.
## Key Features
### ✅ **Automatic Gap Level Detection**
- Captures ES Futures closing price at 3:59-4:00 PM ET
- Instantly displays gap levels for immediate session planning
- Resets daily for fresh gap analysis
### ✅ **Six Critical Gap Levels**
- **±10 Points** (White lines) - Short-term gap targets
- **±20 Points** (Light Blue lines) - Medium gap targets
- **±30 Points** (Red lines) - Extended gap targets
### ✅ **Professional Display**
- Clean horizontal lines with customizable colors
- Clear labels showing point values (+30, +20, +10, -10, -20, -30)
- Gap levels table showing exact price targets
- Optional closing price reference line
### ✅ **Customizable Settings**
- Adjustable line colors, width, and extension
- Toggle labels and reference table on/off
- Manual closing price override for testing
- Debug mode for troubleshooting
### ✅ **Smart Management**
- Automatic cleanup of previous day's levels
- Lines appear immediately after market close
- Optimized for ES1!, MES1!, and other ES futures contracts
## How It Works
1. **Market Close Capture**: At 3:59 PM ET, the indicator captures the ES closing price
2. **Instant Display**: Gap levels immediately appear on your chart
3. **Evening Session Ready**: Lines are positioned for 6:00 PM ET session start
4. **Daily Reset**: Old levels are automatically cleared each new trading day
## Perfect For:
- Gap trading strategies
- Overnight futures trading
- ES futures scalping
- Session transition analysis
- Risk management levels
## Usage Tips:
- Best used on 1-15 minute ES futures charts
- Ensure chart timezone shows ET times
- Use manual mode for backtesting specific dates
- Combine with volume and momentum indicators
## Settings Guide:
- **Display Settings**: Control lines, labels, and table visibility
- **Colors**: Customize each gap level color scheme
- **Manual Settings**: Override closing price for testing
- **Debug**: View time detection and diagnostic information
*Designed by traders, for traders. Clean, professional, and reliable gap level detection for serious ES futures trading.*
EMA 8/21/50 + VWAP Crossover Alert IndicatorOverview of the Indicator
This is a custom Pine Script v5 indicator for TradingView titled "EMA 8/21/50 + VWAP Crossover Alert Indicator" (short title: "EMA+VWAP Cross Alert"). It's designed as an overlay indicator, meaning it plots directly on your price chart rather than in a separate pane. The primary purpose is to detect and alert on crossovers between the 8-period Exponential Moving Average (EMA) and the 21-period EMA, which can signal potential bullish or bearish momentum shifts. These are classic short-term trend reversal or continuation signals often used in trading strategies like momentum or swing trading.
To enhance analysis, it also includes:
A 50-period EMA for medium-term trend context (e.g., to confirm if the overall trend aligns with the crossover).
A Volume Weighted Average Price (VWAP) line, which provides a benchmark for the average price weighted by volume, useful for identifying intraday value areas or fair price levels.
The indicator works across all timeframes (e.g., Daily, 4H, 1H, 15M, 5M, 3M) because the calculations are based on the chart's current bars and adapt to volatility and data resolution. It's not a trading strategy (no entry/exit logic or backtesting), but an alert tool—signals are visual and can trigger notifications in TradingView. Always combine it with risk management, as crossovers can produce false signals in ranging or choppy markets.

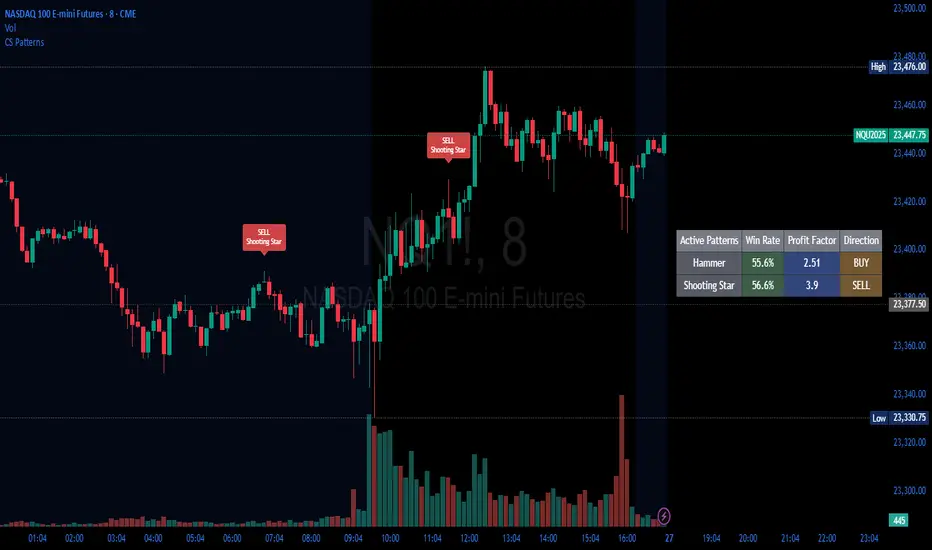
Candlestick Patterns Backtester [Optimized]Candlestick Patterns Backtester
What this is: This indicator is based on a really cool candlestick pattern backtester that I found (I'll update this later when I remember where I got it from or find the actual author). The original had this massive table showing win/loss ratios for a bunch of candlestick patterns, and according to the built-in backtester, it was actually profitable - which was pretty impressive.
The Problem: I played around with the original for a while but honestly wasn't really able to get it to work well at all for actual trading. It was still pretty cool to look at though! The main issues were:
It was just a big static table - hard to do anything useful with it
Couldn't send signals out to other strategies
The code was a monster - like 2,000+ lines of repetitive mess
What I Did: I completely refactored this thing and got it down from 2,000+ lines to just a few hundred lines. Much cleaner now! Here's what it does:
45+ Candlestick Patterns - All the classics are in there
Dynamic Filtering - Set your own requirements (minimum win rate, profit factor, total trades, etc.)
Flexible Logic - Choose AND/OR logic for your filters
Signal Generation - Creates actual buy/sell signals you can use with other strategies
Visual Badges - Shows pattern badges on chart when they meet your criteria
Active Patterns Table - Only shows patterns that are currently profitable based on your settings
Settings You Can Adjust:
Minimum win rate threshold
Minimum profit factor
Minimum number of trades required
Whether to use AND or OR logic for filtering
Colors, badge display, debug options
Reality Check: Trading these patterns really wasn't for me, but it was still a great learning experience. The backtesting results look good on paper, but as always, past performance doesn't guarantee future results. Use this as a research tool and educational resource more than anything else.
Credit: This is based on someone else's original work that I heavily modified and optimized. I'll update this description once I track down the original author to give proper credit where it's due.
This introduction captures your casual, honest tone while explaining the technical improvements you made and setting realistic expectations about the indicator's practical use.
Synthetic VX3! & VX4! continuous /VX futuresTradingView is missing continuous 3rd and 4th month VIX (/VX) futures, so I decided to try to make a synthetic one that emulates what continuous maturity futures would look like. This is useful for backtesting/historical purposes as it enables traders to see how their further out VX contracts would've performed vs the front month contract.
The indicator pulls actual realtime data (if you subscribe to the CBOE data package) or 15 minute delayed data for the VIX spot (the actual non-tradeable VIX index), the continuous front month (VX1!), and the continuous second month (VX2!) continually rolled contracts. Then the indicator's script applies a formula to fairly closely estimate how 3rd and 4th month continuous contracts would've moved.
It uses an exponential mean‑reversion to a long‑run level formula using:
σ(T) = θ+(σ0−θ)e−kT
You can expect it to be off by ~5% or so (in times of backwardation it might be less accurate).

SPY, QQQ, VIX - Multi TF Trend Table***CURRENTLY IN BACKTESTING PHASE***
This TradingView script creates a real-time multi-timeframe trend status table for SPY, QQQ, and VIX using the Ripster-style EMA cloud logic.
🔍 What It Shows:
Current Price (1 Min): Live snapshot of each symbol.
10min Trend (5/12 EMA): Short-term momentum.
10min Trend (34/50 EMA): Intermediate-term direction.
1 Hour Trend: Higher timeframe trend.
Daily Trend: Long-term trend using 5/12 and 34/55 EMA alignment.
Each cell is color-coded:
✅ Green = Bullish
❌ Red = Bearish
Yellow can be used for neutral if customized.
⚙️ How It Works:
Uses request.security() to pull multi-timeframe EMA values for each symbol.
Compares fast/slow EMAs to determine bullish or bearish alignment.
The table is refreshed live and placed in a corner of your choice.
✅ Ideal For:
Trend traders using Ripster EMA clouds
SPY/QQQ/VIX correlation watchers
Traders seeking real-time trend clarity across multiple timeframes

% / ATR Buy, Target, Stop + Overlay & P/L% / ATR Buy, Target, Stop + Overlay & P/L
This tool combines volatility‑based and fixed‑percentage trade planning into a single, on‑chart overlay—with built‑in profit‑and‑loss estimates. Toggle between ATR or percentage modes, plot your Buy, Target and Stop levels, and see the dollar gain or loss for a specified position size—all in one interactive table and chart display.
NOTE: To activate plotted lines, price labels, P/L rows and table values, enter a Buy Price greater than zero.
What It Does
Mode Toggle: Choose between “ATR” (volatility‑based) or “%” (fixed‑percentage) calculations.
Buy Price Input: Manually enter your entry price.
ATR Mode:
Target = Buy + (ATR × Target Multiplier)
Stop = Buy − (ATR × Stop Multiplier)
Percentage Mode:
Target = Buy × (1 + Target % / 100)
Stop = Buy × (1 – Stop % / 100)
P/L Estimates: Specify a dollar amount to “invest” at your Buy price, and the script calculates:
Gain ($): Profit if Target is hit
Loss ($): Cost if Stop is hit
Visual Overlay: Draws horizontal lines for Buy, Target and Stop, with optional price labels on the chart scale.
Interactive Table: Displays Buy, Target, Stop, ATR/timeframe info (in ATR mode), percentages (in % mode), and P/L rows.
Customization Options
Line Settings:
Choose color, style (solid/dashed/dotted), and width for Buy, Target, Stop lines.
Extend lines rightward only or in both directions.
Table Settings:
Position the table (top/bottom × left/right).
Toggle individual rows: Buy Price; Target (multiplier or %); Stop (multiplier or %); Target ATR %; Stop ATR %; ATR Time Frame; ATR Value; Gain ($); Loss ($).
Customize text colors for each row and background transparency.
General Inputs:
ATR length and optional ATR timeframe override (e.g. use daily ATR on an intraday chart).
Target/Stop multipliers or percentages.
Dollar Amount for P/L calculations.
How to Use It for Trading
Plan Your Entry: Enter your intended Buy Price and position size (dollar amount).
Select Mode: Toggle between ATR or % mode depending on whether you prefer volatility‑based or fixed offsets.
Assess R:R and P/L: Instantly see your Target, Stop levels, and potential profit or loss in dollars.
Visual Reference: Lines and price labels update in real time as you tweak inputs—ideal for live trading, backtesting or trade journaling.
Ideal For
Traders who want both volatility‑based and percentage‑based exit options in one tool
Those who need on‑chart P/L estimates based on position size
Swing and intraday traders focused on objective, rule‑based trade management
Anyone who uses ATR for adaptive stops/targets or fixed percentages for simpler exits