(Mustang Algo) Stochastic RSI + Triple EMAStochastic RSI + Triple EMA (StochTEMA)
Overview
The Stochastic RSI + Triple EMA indicator combines the Stochastic RSI oscillator with a Triple Exponential Moving Average (TEMA) overlay to generate clear buy and sell signals on the price chart. By measuring RSI overbought/oversold conditions and confirming trend direction with TEMA, this tool helps traders identify high-probability entries and exits while filtering out noise in choppy markets.
Key Features
Stochastic RSI Calculation
Computes a standard RSI over a user-defined period (default 50).
Applies a Stochastic oscillator to the RSI values over a second user-defined period (default 50).
Smooths the %K line by taking an SMA over a third input (default 3), and %D is an SMA of %K over another input (default 3).
Defines oversold when both %K and %D are below 20, and overbought when both are above 80.
Triple EMA (TEMA)
Calculates three successive EMAs on the closing price with the same length (default 9).
Combines them using TEMA = 3×(EMA1 – EMA2) + EMA3, producing a fast-reacting trend line.
Bullish trend is identified when price > TEMA and TEMA is rising; bearish trend when price < TEMA and TEMA is falling; neutral/flat when TEMA change is minimal.
Signal Logic
Strong Buy: Previous bar’s Stoch RSI was oversold (both %K and %D < 20), %K crosses above %D, and TEMA is in a bullish trend.
Medium Buy: %K crosses above %D (without requiring oversold), TEMA is bullish, and previous %K < 50.
Weak Buy: Previous bar’s %K and %D were oversold, %K crosses above %D, TEMA is flat or bullish (not bearish).
Strong Sell: Previous bar’s Stoch RSI was overbought (both %K and %D > 80), %K crosses below %D, and TEMA is bearish.
Medium Sell: %K crosses below %D (without requiring overbought), TEMA is bearish, and previous %K > 50.
Weak Sell: Previous bar’s %K and %D were overbought, %K crosses below %D, TEMA is flat or bearish (not bullish).
Visual Elements on Chart
TEMA Line: Plotted in cyan (#00BCD4) with a medium-thick line for clear trend visualization.
Buy/Sell Markers:
BUY STRONG: Lime label below the candle
BUY MEDIUM: Green triangle below the candle
BUY WEAK: Semi-transparent green circle below the candle
SELL STRONG: Red label above the candle
SELL MEDIUM: Orange triangle above the candle
SELL WEAK: Semi-transparent orange circle above the candle
Candle & Background Coloring: When a strong buy or sell signal occurs, the candle body is tinted (semi-transparent lime/red) and the chart background briefly flashes light green (buy) or light red (sell).
Dynamic Support/Resistance:
On a strong buy signal, a green dot is plotted under that bar’s low as a temporary support marker.
On a strong sell signal, a red dot is plotted above that bar’s high as a temporary resistance marker.
Alerts
Strong Buy Alert: Triggered when Stoch RSI is oversold, %K crosses above %D, and TEMA is bullish.
Strong Sell Alert: Triggered when Stoch RSI is overbought, %K crosses below %D, and TEMA is bearish.
General Buy Alert: Triggered on any bullish crossover (%K > %D) when TEMA is not bearish.
General Sell Alert: Triggered on any bearish crossover (%K < %D) when TEMA is not bullish.
Inputs
Stochastic RSI Settings (group “Stochastic RSI”):
K (smoothK): Period length for smoothing the %K line (default 3, minimum 1)
D (smoothD): Period length for smoothing the %D line (default 3, minimum 1)
RSI Length (lengthRSI): Number of bars used for the RSI calculation (default 50, minimum 1)
Stochastic Length (lengthStoch): Number of bars for the Stochastic oscillator applied to RSI (default 50, minimum 1)
RSI Source (src): Price source for the RSI (default = close)
TEMA Settings (group “Triple EMA”):
TEMA Length (lengthTEMA): Number of bars used for each of the three EMAs (default 9, minimum 1)
How to Use
Add the Script
Copy and paste the indicator code into TradingView’s Pine Editor (version 6).
Save the script and add it to your chart as “Stochastic RSI + Triple EMA (StochTEMA).”
Adjust Inputs
Choose shorter lengths for lower timeframes (e.g., intraday scalping) and longer lengths for higher timeframes (e.g., swing trading).
Fine-tune the Stochastic RSI parameters (K, D, RSI Length, Stochastic Length) to suit the volatility of the instrument.
Modify TEMA Length if you prefer a faster or slower moving average response.
Interpret Signals
Primary Entries/Exits: Focus on “BUY STRONG” and “SELL STRONG” signals, as they require both oversold/overbought conditions and a confirming TEMA trend.
Confirmation Signals: Use “BUY MEDIUM”/“BUY WEAK” to confirm or add to an existing position when the market is trending. Similarly, “SELL MEDIUM”/“SELL WEAK” can be used to scale out or confirm bearish momentum.
Support/Resistance Dots: These help identify recent swing lows (green dots) and swing highs (red dots) that were tagged by strong signals—useful to place stop-loss or profit-target orders.
Set Alerts
Open the Alerts menu (bell icon) in TradingView, choose this script, and select the desired alert condition (e.g., “BUY Signal Strong”).
Configure notifications (popup, email, webhook) according to your trading workflow.
Notes & Best Practices
Filtering False Signals: By combining Stoch RSI crossovers with TEMA trend confirmation, most false breakouts during choppy price action are filtered out.
Timeframe Selection: This indicator works on all timeframes, but shorter timeframes may generate frequent signals—consider higher-timeframe confirmation when trading lower timeframes.
Risk Management: Always use proper position sizing and stop-loss placement. An “oversold” or “overbought” reading can remain extended for some time in strong trends.
Backtesting/Optimization: Before live trading, backtest different parameter combinations on historical data to find the optimal balance between sensitivity and reliability for your chosen instrument.
No Guarantee of Profits: As with any technical indicator, past performance does not guarantee future results. Use in conjunction with other forms of analysis (volume, price patterns, fundamentals).
Author: Your Name or Username
Version: 1.0 (Pine Script v6)
Published: June 2025
Feel free to customize input values and visual preferences. If you find bugs or have suggestions for improvements, open an issue or leave a comment below. Trade responsibly!
在腳本中搜尋"backtesting"

Levels Of Interest------------------------------------------------------------------------------------
LEVELS OF INTEREST (LOI)
TRADING INDICATOR GUIDE
------------------------------------------------------------------------------------
Table of Contents:
1. Indicator Overview & Core Functionality
2. VWAP Foundation & Historical Context
3. Multi-Timeframe VWAP Analysis
4. Moving Average Integration System
5. Trend Direction Signal Detection
6. Visual Design & Display Features
7. Custom Level Integration
8. Repaint Protection Technology
9. Practical Trading Applications
10. Setup & Configuration Recommendations
------------------------------------------------------------------------------------
1. INDICATOR OVERVIEW & CORE FUNCTIONALITY
------------------------------------------------------------------------------------
The LOI indicator combines multiple VWAP calculations with moving averages across different timeframes. It's designed to show where institutional money is flowing and help identify key support and resistance levels that actually matter in today's markets.
Primary Functions:
- Multi-timeframe VWAP analysis (Daily, Weekly, Monthly, Yearly)
- Advanced moving average integration (EMA, SMA, HMA)
- Real-time trend direction detection
- Institutional flow analysis
- Dynamic support/resistance identification
Target Users: Day traders, swing traders, position traders, and institutional analysts seeking comprehensive market structure analysis.
------------------------------------------------------------------------------------
2. VWAP FOUNDATION & HISTORICAL CONTEXT
------------------------------------------------------------------------------------
Historical Development: VWAP started in the 1980s when big institutional traders needed a way to measure if they were getting good fills on their massive orders. Unlike regular price averages, VWAP weighs each price by the volume traded at that level. This makes it incredibly useful because it shows you where most of the real money changed hands.
Mathematical Foundation: The basic math is simple: you take each price, multiply it by the volume at that price, add them all up, then divide by total volume. What you get is the true "average" price that reflects actual trading activity, not just random price movements.
Formula: VWAP = Σ(Price × Volume) / Σ(Volume)
Where typical price = (High + Low + Close) / 3
Institutional Behavior Patterns:
- When price trades above VWAP, institutions often look to sell
- When it's below, they're usually buying
- Creates natural support and resistance that you can actually trade against
- Serves as benchmark for execution quality assessment
------------------------------------------------------------------------------------
3. MULTI-TIMEFRAME VWAP ANALYSIS
------------------------------------------------------------------------------------
Core Innovation: Here's where LOI gets interesting. Instead of just showing daily VWAP like most indicators, it displays four different timeframes simultaneously:
**Daily VWAP Implementation**:
- Resets every morning at market open
- Provides clearest picture of intraday institutional sentiment
- Primary tool for day trading strategies
- Most responsive to immediate market conditions
**Weekly VWAP System**:
- Resets each Monday (or first trading day)
- Smooths out daily noise and volatility
- Perfect for swing trades lasting several days to weeks
- Captures weekly institutional positioning
**Monthly VWAP Analysis**:
- Resets at beginning of each calendar month
- Captures bigger institutional rebalancing at month-end
- Fund managers often operate on monthly mandates
- Significant weight in intermediate-term analysis
**Yearly VWAP Perspective**:
- Resets annually for full-year institutional view
- Shows long-term institutional positioning
- Where pension funds and sovereign wealth funds operate
- Critical for major trend identification
Confluence Zone Theory: The magic happens when multiple VWAP levels cluster together. These confluence zones often become major turning points because different types of institutional money all see value at the same price.
------------------------------------------------------------------------------------
4. MOVING AVERAGE INTEGRATION SYSTEM
------------------------------------------------------------------------------------
Multi-Type Implementation: The indicator includes three types of moving averages, each with its own personality and application:
**Exponential Moving Averages (EMAs)**:
- React quickly to recent price changes
- Displayed as solid lines for easy identification
- Optimal performance in trending market conditions
- Higher sensitivity to current price action
**Simple Moving Averages (SMAs)**:
- Treat all historical data points equally
- Appear as dashed lines in visual display
- Slower response but more reliable in choppy conditions
- Traditional approach favored by institutional traders
**Hull Moving Averages (HMAs)**:
- Newest addition to the system (dotted line display)
- Created by Alan Hull in 2005
- Solves classic moving average dilemma: speed vs. accuracy
- Manages to be both responsive and smooth simultaneously
Technical Innovation: Alan Hull's solution addresses the fundamental problem where moving averages are either too slow (missing moves) or too fast (generating false signals). HMAs achieve optimal balance through weighted calculation methodology.
Period Configuration:
- 5-period: Short-term momentum assessment
- 50-period: Intermediate trend identification
- 200-period: Long-term directional confirmation
------------------------------------------------------------------------------------
5. TREND DIRECTION SIGNAL DETECTION
------------------------------------------------------------------------------------
Real-Time Momentum Analysis: One of LOI's best features is its real-time trend detection system. Next to each moving average, visual symbols provide immediate trend assessment:
Symbol System:
- ▲ Rising average (bullish momentum confirmation)
- ▼ Falling average (bearish momentum indication)
- ► Flat average (consolidation or indecision period)
Update Frequency: These signals update in real-time with each new price tick and function across all configured timeframes. Traders can quickly scan daily and weekly trends to assess alignment or conflicting signals.
Multi-Timeframe Trend Analysis:
- Simultaneous daily and weekly trend comparison
- Immediate identification of trend alignment
- Early warning system for potential reversals
- Momentum confirmation for entry decisions
------------------------------------------------------------------------------------
6. VISUAL DESIGN & DISPLAY FEATURES
------------------------------------------------------------------------------------
Color Psychology Framework: The color scheme isn't random but based on psychological associations and trading conventions:
- **Blue Tones**: Institutional neutrality (VWAP levels)
- **Green Spectrum**: Growth and stability (weekly timeframes)
- **Purple Range**: Longer-term sophistication (monthly analysis)
- **Orange Hues**: Importance and attention (yearly perspective)
- **Red Tones**: User-defined significance (custom levels)
Adaptive Display Technology: The indicator automatically adjusts decimal places based on the instrument you're trading. High-priced stocks show 2 decimals, while penny stocks might show 8. This keeps the display incredibly clean regardless of what you're analyzing - no cluttered charts or overwhelming information overload.
Smart Labeling System: Advanced positioning algorithm automatically spaces all elements to prevent overlap, even during extreme zoom levels or multiple timeframe analysis. Every level stays clearly readable without any visual chaos disrupting your analysis.
------------------------------------------------------------------------------------
7. CUSTOM LEVEL INTEGRATION
------------------------------------------------------------------------------------
User-Defined Level System: Beyond the calculated VWAP and moving average levels, traders can add custom horizontal lines at any price point for personalized analysis.
Strategic Applications:
- **Psychological Levels**: Round numbers, previous significant highs/lows
- **Technical Levels**: Fibonacci retracements, pivot points
- **Fundamental Targets**: Analyst price targets, earnings estimates
- **Risk Management**: Stop-loss and take-profit zones
Integration Features:
- Seamless incorporation with smart labeling system
- Custom color selection for visual organization
- Extension capabilities across all chart timeframes
- Maintains display clarity with existing indicators
------------------------------------------------------------------------------------
8. REPAINT PROTECTION TECHNOLOGY
------------------------------------------------------------------------------------
Critical Trading Feature: This addresses one of the most significant issues in live trading applications. Most multi-timeframe indicators "repaint," meaning they display different signals when viewing historical data versus real-time analysis.
Protection Benefits:
- Ensures every displayed signal could have been traded when it appeared
- Eliminates discrepancies between historical and live analysis
- Provides realistic performance expectations
- Maintains signal integrity across chart refreshes
Configuration Options:
- **Protection Enabled**: Default setting for live trading
- **Protection Disabled**: Available for backtesting analysis
- User-selectable toggle based on analysis requirements
- Applies to all multi-timeframe calculations
Implementation Note: With protection enabled, signals may appear one bar later than without protection, but this ensures all signals represent actionable opportunities that could have been executed in real-time market conditions.
------------------------------------------------------------------------------------
9. PRACTICAL TRADING APPLICATIONS
------------------------------------------------------------------------------------
**Day Trading Strategy**:
Focus on daily VWAP with 5-period moving averages. Look for bounces off VWAP or breaks through it with volume. Short-term momentum signals provide entry and exit timing.
**Swing Trading Approach**:
Weekly VWAP becomes your primary anchor point, with 50-period averages showing intermediate trends. Position sizing based on weekly VWAP distance.
**Position Trading Method**:
Monthly and yearly VWAP provide broad market context, while 200-period averages confirm long-term directional bias. Suitable for multi-week to multi-month holdings.
**Multi-Timeframe Confluence Strategy**:
The highest-probability setups occur when daily, weekly, and monthly VWAPs cluster together, especially when multiple moving averages confirm the same direction. These represent institutional consensus zones.
Risk Management Integration:
- VWAP levels serve as dynamic stop-loss references
- Multiple timeframe confirmation reduces false signals
- Institutional flow analysis improves position sizing decisions
- Trend direction signals optimize entry and exit timing
------------------------------------------------------------------------------------
10. SETUP & CONFIGURATION RECOMMENDATIONS
------------------------------------------------------------------------------------
Initial Configuration: Start with default settings and adjust based on individual trading style and market focus. Short-term traders should emphasize daily and weekly timeframes, while longer-term investors benefit from monthly and yearly level analysis.
Transparency Optimization: The transparency settings allow clear price action visibility while maintaining level reference points. Most traders find 70-80% transparency optimal - it provides a clean, unobstructed view of price movement while maintaining all critical reference levels needed for analysis.
Integration Strategy: Remember that no indicator functions effectively in isolation. LOI provides excellent context for institutional flow and trend direction analysis, but should be combined with complementary analysis tools for optimal results.
Performance Considerations:
- Multiple timeframe calculations may impact chart loading speed
- Adjust displayed timeframes based on trading frequency
- Customize color schemes for different market sessions
- Regular review and adjustment of custom levels
------------------------------------------------------------------------------------
FINAL ANALYSIS
------------------------------------------------------------------------------------
Competitive Advantage: What makes LOI different is its focus on where real money actually trades. By combining volume-weighted calculations with multiple timeframes and trend detection, it cuts through market noise to show you what institutions are really doing.
Key Success Factor: Understanding that different timeframes serve different purposes is essential. Use them together to build a complete picture of market structure, then execute trades accordingly.
The integration of institutional flow analysis with technical trend detection creates a comprehensive trading tool that addresses both short-term tactical decisions and longer-term strategic positioning.
------------------------------------------------------------------------------------
END OF DOCUMENTATION
------------------------------------------------------------------------------------

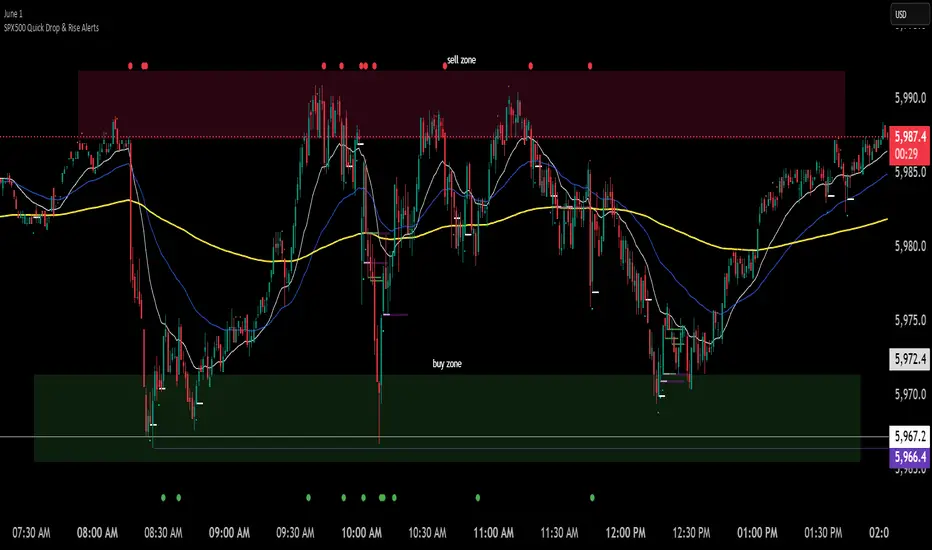
SPX500 Quick Drop & Rise AlertsSimple script thats been adjusted for 1 minute trading on spx500.
It will show you and signal to you:
dropThreshold: how much the price must rise or fall (in percent) to trigger a signal. Default is 0.05 → 5%.
lookbackBars: how many bars back to compare against. Default is 1 (i.e., compare the current close to the previous bar’s close).
Theirs a few ways to use this, you might want to use your MA 238 as a reference point. Use it as a target or a level to bounce or reject from. Then use this indicator to help show you where the market energy is flowing.
Do some backtesting and see what you see. Only use it for New York open times would probably be best.
Youll have to change your mentality depending on if the market is trending / ranging ect of course.
CVD Trend IndikatorCVD Trend Indicator (Cumulative Volume Delta)
This Pine Script indicator is designed to help traders visualize the underlying buying and selling pressure in the market by analyzing the Cumulative Volume Delta (CVD). It provides insights into whether buyers or sellers are more aggressive over time, aiding in trend confirmation and potential reversal identification.
How it Works:
The indicator calculates the Cumulative Volume Delta for each candlestick.
If the candle closes higher than it opened (close > open), its entire volume is considered buying volume (positive delta).
If the candle closes lower than it opened (close < open), its entire volume is considered selling volume (negative delta).
If the candle closes at the same price it opened (close == open), its delta is considered zero.
These individual candle deltas are then cumulatively summed up over time, creating the CVD line. A rising CVD indicates increasing buying pressure, while a falling CVD suggests growing selling pressure.
The indicator also features an optional Simple Moving Average (SMA) of the CVD, which helps smooth out the CVD line and identify the prevailing trend in buying/selling pressure more clearly.
Key Features:
Cumulative Volume Delta (CVD) Line:
Rising CVD (Blue Line): Indicates aggressive buying pressure is dominant, supporting bullish price action.
Falling CVD (Blue Line): Suggests aggressive selling pressure is dominant, supporting bearish price action.
CVD Moving Average (Red Line, optional):
A user-defined SMA of the CVD, which acts as a trend filter for the volume delta.
When the CVD crosses above its MA, it can signal increasing buying momentum.
When the CVD crosses below its MA, it can signal increasing selling momentum.
Session Reset:
The CVD automatically resets at the beginning of each new trading session (daily by default). This provides a fresh perspective on the day's accumulated buying or selling pressure, which is particularly useful for day traders.
Background Color Visuals:
The indicator panel's background changes color to visually represent periods of dominant buying pressure (green background when CVD > CVD MA) or selling pressure (red background when CVD < CVD MA), offering a quick glance at the market's underlying bias.
Trading Insights:
Trend Confirmation: Use a rising CVD (and its MA) to confirm an uptrend, or a falling CVD (and its MA) to confirm a downtrend.
Divergences: Look for CVD Divergences as potential reversal signals:
Bullish Divergence: Price makes a lower low, but CVD makes a higher low (suggests selling pressure is weakening).
Bearish Divergence: Price makes a higher high, but CVD makes a lower high (suggests buying pressure is weakening).
Momentum Shifts: Sudden, sharp changes in the CVD's direction or its cross over/under its MA can signal shifts in market momentum.
Support/Resistance Confirmation: Observe CVD behavior around key price levels. Weakening buying pressure at resistance or weakening selling pressure at support can confirm the strength of these levels.
Customization:
showMA: Toggle the visibility of the CVD's Moving Average.
maLength: Adjust the period for the CVD's Moving Average to control its sensitivity to recent price action. A shorter length makes it more reactive, while a longer length makes it smoother.
Disclaimer: No indicator is foolproof. Always use the CVD Trend Indicator in conjunction with other technical analysis tools, price action, and robust risk management strategies. Backtesting and forward testing are crucial for understanding its effectiveness in different market conditions and timeframes.

Money Risk Management with Trade Tracking
Overview
The Money Risk Management with Trade Tracking indicator is a powerful tool designed for traders on TradingView to simplify trade simulation and risk management. Unlike the TradingView Strategy Tester, which can be complex for beginners, this indicator provides an intuitive, beginner-friendly interface to evaluate trading strategies in a realistic manner, mirroring real-world trading conditions.
Built on the foundation of open-source contributions from LuxAlgo and TCP, this indicator integrates external indicator signals, overlays take-profit (TP) and stop-loss (SL) levels, and provides detailed money management analytics. It empowers traders to visualize potential profits, losses, and risk-reward ratios, making it easier to understand the financial outcomes of their strategies.
Key Features
Signal Integration: Seamlessly integrates with external long and short signals from other indicators, allowing traders to overlay TP/SL levels based on their preferred strategies.
Realistic Trade Simulation: Simulates trades as they would occur in real-world scenarios, accounting for initial capital, risk percentage, leverage, and compounding effects.
Money Management Dashboard: Displays critical metrics such as current capital, unrealized P&L, risk amount, potential profit, risk-reward ratio, and trade status in a customizable, beginner-friendly table.
TP/SL Visualization: Plots TP and SL levels on the chart with customizable styles (solid, dashed, dotted) and colors, along with optional labels for clarity.
Performance Tracking: Tracks total trades, win/loss counts, win rate, and profit factor, providing a clear overview of strategy performance.
Liquidation Risk Alerts: Warns traders if stop-loss levels risk liquidation based on leverage settings, enhancing risk awareness.
Benefits for Traders
Beginner-Friendly: Simplifies the complexities of the TradingView Strategy Tester, offering an intuitive interface for new traders to simulate and evaluate trades without confusion.
Real-World Insights: Helps traders understand the actual profit or loss potential of their strategies by factoring in capital, risk, and leverage, bridging the gap between theoretical backtesting and real-world execution.
Enhanced Decision-Making: Provides clear, real-time analytics on risk-reward ratios, unrealized P&L, and trade performance, enabling informed trading decisions.
Customizable and Flexible: Allows customization of TP/SL settings, table positions, colors, and sizes, catering to individual trader preferences.
Risk Management Focus: Encourages disciplined trading by highlighting risk amounts, potential profits, and liquidation risks, fostering better financial planning.
Why This Indicator Stands Out
Many traders struggle to translate backtested strategy results into real-world outcomes due to the abstract nature of percentage-based profitability metrics. This indicator addresses that challenge by providing a practical, user-friendly tool that simulates trades with real-world parameters like capital, leverage, and compounding. Its open-source nature ensures accessibility, while its integration with other indicators makes it versatile for various trading styles.
How to Use
Add to TradingView: Copy the Pine Script code into TradingView’s Pine Editor and add it to your chart.
Configure Inputs: Set your initial capital, risk percentage, leverage, and TP/SL values in the indicator settings. Select external long/short signal sources if integrating with other indicators.
Monitor Dashboards: Use the Money Management and Target Dashboard tables to track trade performance and risk metrics in real time.
Analyze Results: Review win rates, profit factors, and P&L to refine your trading strategy.
Credits
This indicator builds upon the open-source contributions of LuxAlgo and TCP , whose efforts in sharing their code have made this tool possible. Their dedication to the trading community is deeply appreciated.

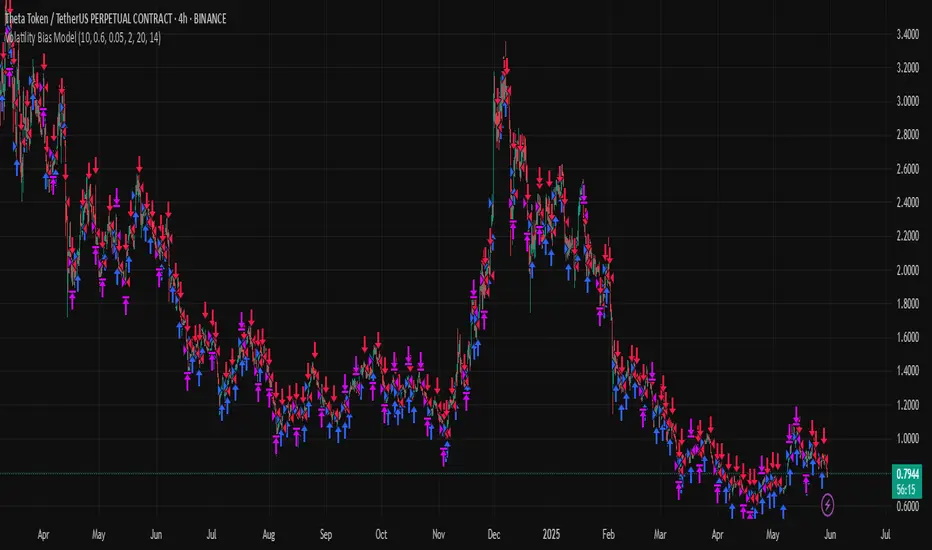
Volatility Bias ModelVolatility Bias Model
Overview
Volatility Bias Model is a purely mathematical, non-indicator-based trading system that detects directional probability shifts during high volatility market phases. Rather than relying on classic tools like RSI or moving averages, this strategy uses raw price behavior and clustering logic to determine potential breakout direction based on recent market bias.
How It Works
Over a defined lookback window (default 10 bars), the strategy counts how many candles closed in the same direction (i.e., bullish or bearish).
Simultaneously, it calculates the price range during that window.
If volatility is above a minimum threshold and a clear directional bias is detected (e.g., >60% of closes are bullish), a trade is opened in the direction of that bias.
This approach assumes that when high volatility is coupled with directional closing consistency, the market is probabilistically more likely to continue in that direction.
ATR-based stop-loss and take-profit levels are applied, and trades auto-exit after 20 bars if targets are not hit.
Key Features
- 100% non-indicator-based logic
- Statistically-driven directional bias detection
- Works across all timeframes (1H, 4H, 1D)
- ATR-based risk management
- No pyramiding, slippage and commissions included
- Compatible with real-world backtesting conditions
Realism & Assumptions
To make this strategy more aligned with actual trading environments, it includes 0.05% commission per trade and a 1-point slippage on every entry and exit.
Additionally, position sizing is set at 10% of a $10,000 starting capital, and no pyramiding is allowed.
These assumptions help avoid unrealistic backtest results and make the performance metrics more representative of live conditions.
Parameter Explanation
Bias Window (10 bars): Number of past candles used to evaluate directional closings
Bias Threshold (0.60): Required ratio of same-direction candles to consider a bias valid
Minimum Range (1.5%): Ensures the market is volatile enough to avoid noise
ATR Length (14): Used to dynamically define stop-loss and target zones
Risk-Reward Ratio (2.0): Take-profit is set at twice the stop-loss distance
Max Holding Bars (20): Trades are closed automatically after 20 bars to prevent stagnation
Originality Note
Unlike common strategies based on oscillators or moving averages, this script is built on pure statistical inference. It models the market as a probabilistic process and identifies directional intent based on historical closing behavior, filtered by volatility. This makes it a non-linear, adaptive model grounded in real-world price structure — not traditional technical indicators.
Disclaimer
This strategy is for educational and experimental purposes only. It does not constitute financial advice. Always perform your own analysis and test thoroughly before applying with real capital.
Multi-Indicator Trend-Following Strategy v6Multi-Indicator Trend-Following Strategy v6
This strategy uses a combination of technical indicators to identify potential trend-following trade entries and exits. It is intended for educational and research purposes.
How it works:
Moving Averages (EMA): Entry signals are generated on crossovers between a fast and slow exponential moving average.
RSI Filter: Confirms momentum with a threshold above/below 50 for long/short entries.
Volume Confirmation: Requires volume to exceed a moving average multiplied by a user-defined factor.
ATR-Based Risk Management: Stop loss and take profit levels are calculated using the Average True Range (ATR), allowing for dynamic risk control based on market volatility.
Customizable Inputs:
Fast/Slow MA lengths
RSI length and levels
MACD settings (used in calculation, not directly in signal)
Volume MA and multiplier
ATR period and multipliers for stop loss and take profit
Notes:
This strategy does not guarantee future results.
It is provided for analysis and backtesting only.
Alerts are available for buy/sell conditions.
Feel free to adjust parameters to explore different market conditions and asset classes.

Volatility Pulse with Dynamic ExitVolatility Pulse with Dynamic Exit
Overview
This strategy, Volatility Pulse with Dynamic Exit, is designed to capture impulsive price moves following volatility expansions, while ensuring risk is managed dynamically. It avoids trades during low-volatility periods and uses momentum confirmation to enter positions. Additionally, it features a time-based forced exit system to limit overexposure.
How It Works
A position is opened when the current ATR (Average True Range) significantly exceeds its 20-period average, signaling a volatility expansion.
To confirm the move is directional and not random noise, the strategy checks for momentum: the close must be above/below the close of 20 bars ago.
Low volatility zones are filtered out to avoid chop and poor trade entries.
Upon entry, a dynamic stop-loss is set at 1x ATR, while take-profit is set at 2x ATR, offering a 2:1 reward-to-risk ratio.
If the position remains open for more than 42 bars, it is forcefully closed, even if targets are not hit. This prevents long-lasting, stagnant trades.
Key Features
✅ Volatility-based breakout detection
✅ Momentum confirmation filter
✅ Dynamic stop-loss and take-profit based on real-time ATR
✅ Time-based forced exit (42 bars max holding)
✅ Low-volatility environment filter
✅ Realistic settings with 0.05% commission and slippage included
Parameters Explanation
ATR Length (14): Captures recent volatility over ~2 weeks (14 candles).
Momentum Lookback (20): Ensures meaningful price move confirmation.
Volatility Expansion Threshold (0.5x): Strategy activates only when ATR is at least 50% above its average.
Minimum ATR Filter (1.0x): Avoids entries in tight, compressed market ranges.
Max Holding (42 bars): Trades are closed after 42 bars if no exit signal is triggered.
Risk-Reward (2.0x): Aiming for 2x ATR as profit for every 1x ATR risk.
Originality Note
While volatility and momentum have been used separately in many strategies, this script combines both with a time-based dynamic exit system. This exit rule, combined with an ATR-based filter to exclude low-activity periods, gives the system a practical edge in real-world use. It avoids classic rehashes and integrates real trading constraints for better applicability.
Disclaimer
This is a research-focused trading strategy meant for backtesting and educational purposes. Always use proper risk management and perform due diligence before applying to real funds.

Quantum State Superposition Indicator (QSSI)Quantum State Superposition Indicator (QSSI) - Where Physics Meets Finance
The Quantum Revolution in Market Analysis
After months of research into quantum mechanics and its applications to financial markets, I'm thrilled to present the Quantum State Superposition Indicator (QSSI) - a groundbreaking approach that models price action through the lens of quantum physics. This isn't just another technical indicator; it's a paradigm shift in how we understand market behavior.
The Theoretical Foundation
Quantum Superposition in Markets
In quantum mechanics, particles exist in multiple states simultaneously until observed. Similarly, markets exist in a superposition of potential states (bullish, bearish, neutral) until a significant volume event "collapses" the wave function into a definitive direction.
The mathematical framework:
Wave Function (Ψ): Represents the market's quantum state as a weighted sum of all possible states:
Ψ = Σ(αᵢ × Sᵢ)
Where αᵢ are probability amplitudes and Sᵢ are individual quantum states.
Probability Amplitudes: Calculated using the Born rule, normalized so Σ|αᵢ|² = 1
Observation Operator: Volume/Average Volume ratio determines observation strength
The Five Quantum States
Momentum State: Short-term price velocity (EMA of returns)
Mean Reversion State: Deviation from equilibrium (normalized z-score)
Volatility Expansion State: ATR relative to historical average
Trend Continuation State: Long-term price positioning
Chaos State: Volatility of volatility (market uncertainty)
Each state contributes to the overall wave function based on current market conditions.
Wave Function Collapse
When volume exceeds the observation threshold (default 1.5x average), the wave function "collapses," committing the market to a direction. This models how institutional volume forces markets out of uncertainty into trending states.
Collapse Detection Formula:
Collapse = Volume > (Threshold × Average Volume)
Direction = Sign(Ψ) at collapse moment
Advanced Quantum Concepts
Heisenberg Uncertainty Principle
The indicator calculates market uncertainty as the product of price and momentum
uncertainties:
ΔP × ΔM = ℏ (market uncertainty constant)
This manifests as dynamic uncertainty bands that widen during unstable periods.
Quantum Tunneling
Calculates the probability of price "tunneling" through resistance/support barriers:
P(tunnel) = e^(-2×|barrier_height|×√coherence_length)
Unlike classical technical analysis, this gives probability of breakouts before they occur.
Entanglement
Measures the quantum correlation between price and volume:
Entanglement = |Correlation(Price, Volume, lookback)|
High entanglement suggests coordinated institutional activity.
Decoherence
When market states lose quantum properties and behave classically:
Decoherence = 1 - Σ(amplitude²)
Indicates trend emergence from quantum uncertainty.
Visual Innovation
Probability Clouds
Three-tier probability distributions visualize market uncertainty:
Inner Cloud (68%): One standard deviation - most likely price range
Middle Cloud (95%): Two standard deviations - probable extremes
Outer Cloud (99.7%): Three standard deviations - tail risk zones
Cloud width directly represents market uncertainty - wider clouds signal higher entropy states.
Quantum State Visualization
Colored dots represent individual quantum states:
Green: Momentum state strength
Red: Mean reversion state strength
Yellow: Volatility state strength
Dot brightness indicates amplitude (influence) of each state.
Collapse Events
Aqua Diamonds (Above): Bullish collapse - upward commitment
Pink Diamonds (Below): Bearish collapse - downward commitment
These mark precise moments when markets exit superposition.
Implementation Details
Core Calculations
Feature Extraction: Normalize price returns, volume ratios, and volatility measures
State Calculation: Compute each quantum state's value
Amplitude Assignment: Weight states by market conditions and observation strength
Wave Function: Sum weighted states for final market quantum state
Visualization: Transform quantum values to price space for display
Performance Optimization
- Efficient array operations for state calculations
- Single-pass normalization algorithms
- Optimized correlation calculations for entanglement
- Smart label management to prevent visual clutter
Trading Applications:
Signal Generation
Bullish Signals:
- Positive wave function during collapse
- High tunneling probability at support
- Coherent market state with bullish bias
Bearish Signals:
- Negative wave function during collapse
- High tunneling probability at resistance
- Decoherent state transitioning bearish
Risk Management
Uncertainty-Based Position Sizing:
Narrow clouds: Normal position size
Wide clouds: Reduced position size
Extreme uncertainty: Stay flat
Quantum Stop Losses:
- Place stops outside probability clouds
- Adjust for Heisenberg uncertainty
- Respect quantum tunneling levels
Market Regime Recognition
Quantum Coherent (Superposed):
- Market in multiple states
- Avoid directional trades
- Prepare for collapse
Quantum Decoherent (Classical):
-Clear trend emergence
- Follow directional signals
- Traditional analysis applies
Advanced Features
Adaptive Dashboards
Quantum State Panel: Real-time wave function, dominant state, and coherence status
Performance Metrics: Win rate, signal frequency, and regime analysis
Information Guide: Comprehensive explanation of all quantum concepts
- All dashboards feature adjustable sizing for different screen resolutions.
Multi-Timeframe Quantum Analysis
The indicator adapts to any timeframe:
Scalping (1-5m): Short coherence length, sensitive thresholds
Day Trading (15m-1H): Balanced parameters
Swing Trading (4H-1D): Long coherence, stable states
Alert System
Sophisticated alerts for:
- Wave function collapse events
- Decoherence transitions
- High tunneling probability
- Strong entanglement detection
Originality & Innovation
This indicator introduces several firsts:
Quantum Superposition: First to model markets as quantum systems
Wave Function Collapse: Original volume-triggered state commitment
Tunneling Probability: Novel breakout prediction method
Entanglement Metrics: Unique price-volume quantum correlation
Probability Clouds: Revolutionary uncertainty visualization
Development Journey
Creating QSSI required:
- Deep study of quantum mechanics principles
- Translation of physics equations to market context
- Extensive backtesting across multiple markets
- UI/UX optimization for trader accessibility
- Performance optimization for real-time calculation
- The result bridges cutting-edge physics with practical trading.
Best Practices
Parameter Optimization
Quantum States (2-5):
- 2-3 for simple markets (forex majors)
- 4-5 for complex markets (indices, crypto)
Coherence Length (10-50):
- Lower for fast markets
- Higher for stable markets
Observation Threshold (1.0-3.0):
- Lower for active markets
- Higher for thin markets
Signal Confirmation
Always confirm quantum signals with:
- Market structure (support/resistance)
- Volume patterns
- Correlated assets
- Fundamental context
Risk Guidelines
- Never risk more than 2% per trade
- Respect probability cloud boundaries
- Exit on decoherence shifts
- Scale with confidence levels
Educational Value
QSSI teaches advanced concepts:
- Quantum mechanics applications
- Probability theory
- Non-linear dynamics
- Risk management
- Market microstructure
Perfect for traders seeking deeper market understanding.
Disclaimer
This indicator is for educational and research purposes only. While quantum mechanics provides a fascinating framework for market analysis, no indicator can predict future prices with certainty. The probabilistic nature of both quantum mechanics and markets means outcomes are inherently uncertain.
Always use proper risk management, conduct thorough analysis, and never risk more than you can afford to lose. Past performance does not guarantee future results.
Conclusion
The Quantum State Superposition Indicator represents a revolutionary approach to market analysis, bringing institutional-grade quantum modeling to retail traders. By viewing markets through the lens of quantum mechanics, we gain unique insights into uncertainty, probability, and state transitions that classical indicators miss.
Whether you're a physicist interested in finance or a trader seeking cutting-edge tools, QSSI opens new dimensions in market analysis.
"The market, like Schrödinger's cat, exists in multiple states until observed through volume."
* As you may have noticed, the past two indicators I've released (Lorentzian Classification and Quantum State Superposition) are designed with strategy implementation in mind. I'm currently developing a stable execution platform that's completely unique and moves away from traditional ATR-based position sizing and stop loss systems. I've found ATR-based approaches to be unreliable in volatile markets and regime transitions - they often lag behind actual market conditions and can lead to premature exits or oversized positions during volatility spikes.
The goal is to create something that adapts to market conditions in real-time using the quantum and relativistic principles we've been exploring. Hopefully I'll have something groundbreaking to share soon. Stay tuned!
Trade with quantum insight. Trade with QSSI .
— Dskyz , for DAFE Trading Systems

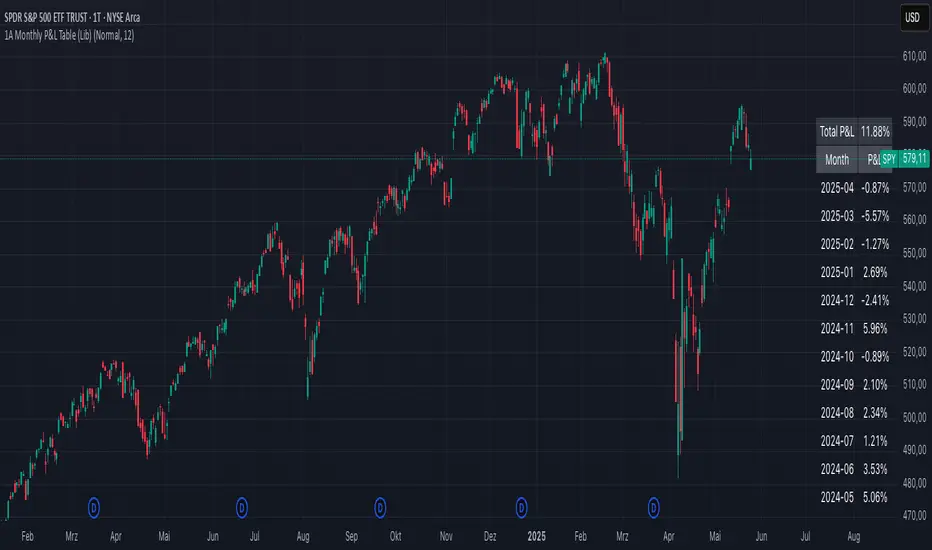
1A Monthly P&L Table - Using Library1A Monthly P&L Table: Track Your Performance Month-by-Month
Overview:
The 1A Monthly P&L Table is a straightforward yet powerful indicator designed to give you an immediate overview of your asset's (or strategy's) percentage performance on a monthly basis. Displayed conveniently in the bottom-right corner of your chart, this tool helps you quickly assess historical gains and losses, making it easier to analyze trends in performance over time.
Key Features:
Monthly Performance at a Glance: Clearly see the percentage change for each past month.
Cumulative P&L: A running total of the displayed monthly P&L is provided, giving you a quick sum of performance over the selected period.
Customizable Display:
Months to Display: Choose how many past months you want to see in the table (from 1 to 60 months).
Text Size: Adjust the text size (Tiny, Small, Normal, Large, Huge) to fit your viewing preferences.
Text Color: Customize the color of the text for better visibility against your chart background.
Intraday & Daily Compatibility: The table is optimized to display on daily and intraday timeframes, ensuring it's relevant for various trading styles. (Note: For very long-term analysis on weekly/monthly charts, you might consider other tools, as this focuses on granular monthly P&L.)
How It Works:
The indicator calculates the percentage change from the close of the previous month to the close of the current month. For the very first month displayed, it calculates the P&L from the opening price of the chart's first bar to the close of that month. This data is then neatly organized into a table, updated on the last bar of the day or session.
Ideal For:
Traders and investors who want a quick, visual summary of monthly performance.
Analyzing seasonal trends or consistent periods of profitability/drawdown.
Supplementing backtesting results with a clear month-by-month breakdown.
Settings:
Text Color: Changes the color of all text within the table.
Text Size: Controls the font size of the table content.
Months to Display: Determines the number of recent months included in the table.
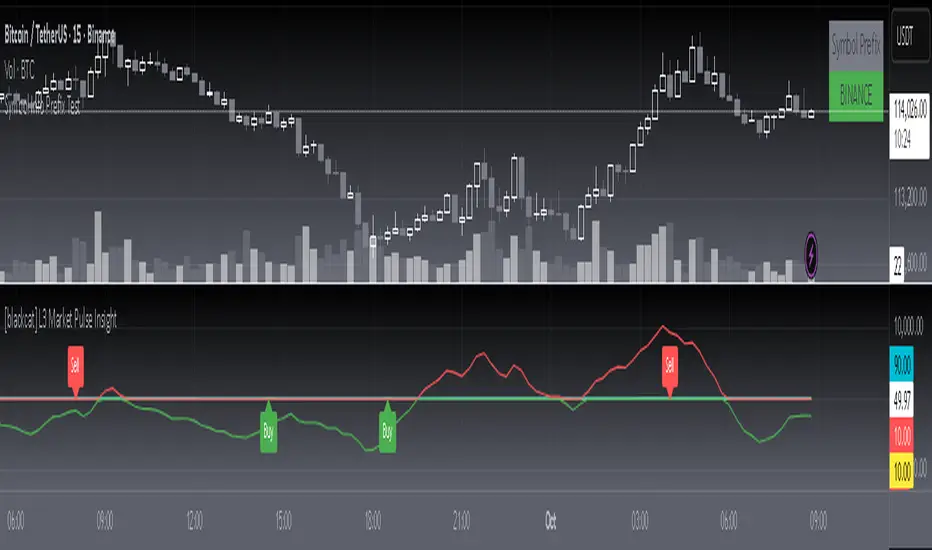
Chaikin Momentum Scalper🎯 Overview
The Chaikin Momentum Scalper is a powerful trading strategy designed to identify momentum shifts in the market and ride the trend for maximum profits. This strategy is ideal for trading the USD/JPY currency pair on a 15-minute chart, making it perfect for high-frequency trading (HFT). Whether you’re starting with a small account of $1,000 or managing a larger portfolio, this strategy can scale to suit your needs.
________________________________________
🔑 How the Strategy Works
Here’s how the Chaikin Momentum Scalper identifies trade opportunities:
1️⃣ Momentum Detection
The core of this strategy is the Chaikin Oscillator, a tool that measures the flow of money into or out of a market. It helps us understand whether buyers (bulls) or sellers (bears) are in control.
• When the indicator crosses above zero, it signals that buying momentum is picking up – a buying opportunity.
• When the indicator crosses below zero, it signals that selling momentum is increasing – a selling opportunity.
2️⃣ Trend Confirmation
We don’t just jump into trades based on momentum alone. We also use a 200-period simple moving average (SMA) to confirm the overall trend.
• If the price is above the SMA, it confirms an uptrend, so we look for buy trades.
• If the price is below the SMA, it confirms a downtrend, so we look for sell trades.
This way, we align our trades with the broader market direction for higher success rates.
3️⃣ Volatility & Risk Management
We use a tool called the Average True Range (ATR) to measure market volatility. This helps us:
• Set a stop-loss (where we’ll exit the trade if the market moves against us) at a safe distance from our entry point.
• Set a take-profit (where we’ll lock in profits) at a target that’s larger than the stop-loss, ensuring a good reward-to-risk ratio.
This approach adapts to the market’s behavior, tightening stops in calmer conditions and widening them when volatility increases.
________________________________________
📈 Why This Strategy Works
✅ It combines momentum and trend-following principles, increasing the chances of trading in the right direction.
✅ It dynamically adjusts risk levels based on market volatility, keeping losses small and profits big.
✅ It’s scalable – perfect for both small accounts (like $1,000) and larger, corporate-sized portfolios.
✅ It has been deep-backtested on USD/JPY 15-minute charts, proving its consistency across different market conditions.
________________________________________
📝 Important Notes
📌 This strategy is best used for USD/JPY on a 15-minute chart, making it great for high-frequency trading while you continue to build and refine your trading system.
📌 It’s designed to work on both small ($1,000+) and large accounts, so it can grow with you as your capital increases.
📌 While it has passed deep backtesting on this pair and timeframe, remember that no strategy is perfect. It’s crucial to test it yourself, start with a demo account, and apply proper risk management before trading real money.
🌟 Final Thoughts
The Chaikin Momentum Scalper is a solid, adaptable trading approach combining momentum, trend direction, and volatility awareness. If you’re looking for a strategy to kick-start your trading journey—or to add to your existing system—it offers a strong foundation.

LANZ Strategy 3.0 [Backtest]🔷 LANZ Strategy 3.0 — Asian Range Fibonacci Scalping Strategy
LANZ Strategy 3.0 is a precision-engineered backtesting tool tailored for intraday traders who rely on the Asian session range to determine directional bias. This strategy implements dynamic Fibonacci projections and strict time-window validation to simulate a clean and disciplined trading environment.
🧠 Core Components:
Asian Range Bias Definition: Direction is established between 01:15–02:15 a.m. NY time based on the candle’s close in relation to the midpoint of the Asian session range (18:00–01:15 NY).
Limit Order Execution: Only one trade is placed daily, using a limit order at the Asian range high (for sells) or low (for buys), between 01:15–08:00 a.m. NY.
Fibonacci-Based TP/SL:
Original Mode: TP = 2.25x range, SL = 0.75x range.
Optimized Mode: TP = 1.95x range, SL = 0.65x range.
No Trade After 08:00 NY: If the limit order is not executed before 08:00 a.m. NY, it is canceled.
Fallback Logic at 02:15 NY: If the market direction misaligns with the setup at 02:15 a.m., the system re-evaluates and can re-issue the order.
End-of-Day Closure: All positions are closed at 15:45 NY if still open.
📊 Backtest-Ready Design:
Entries and exits are executed using strategy.entry() and strategy.exit() functions.
Position size is fixed via capital risk allocation ($100 per trade by default).
Only one position can be active at a time, ensuring controlled risk.
📝 Notes:
This strategy is ideal for assets sensitive to the Asian/London session overlap, such as Forex pairs and indices.
Easily switch between Fibonacci versions using a single dropdown input.
Fully deterministic: all entries are based on pre-defined conditions and time constraints.
👤 Credits:
Strategy developed by rau_u_lanz using Pine Script v6. Built for traders who favor clean sessions, directional clarity, and consistent execution using time-based logic and Fibonacci projections.

EMD Trend [InvestorUnknown]EMD Trend is a dynamic trend-following indicator that utilizes Exponential Moving Deviation (EMD) to build adaptive channels around a selected moving average. Designed for traders who value responsive trend signals with built-in volatility sensitivity, this tool highlights directional bias, market regime shifts, and potential breakout opportunities.
How It Works
Instead of using standard deviation, EMD Trend employs the exponential moving average of the absolute deviation from a moving average—producing smoother, faster-reacting upper and lower bounds:
Bullish (Risk-ON Long): Price crosses above the upper EMD band
Bearish (Risk-ON Short): Price crosses below the lower EMD band
Neutral: Price stays within the channel, indicating potential mean reversion or low momentum
Trend direction is defined by price interaction with these bands, and visual cues (color-coded bars and fills) help quickly identify market conditions.
Features
7 Moving Average Types: SMA, EMA, HMA, DEMA, TEMA, RMA, FRAMA
Custom Price Source: Choose close, hl2, ohlc4, or others
EMD Multiplier: Controls the width of the deviation envelope
Bar Coloring: Candles change color based on current trend
Intra-bar Signal Option: Enables faster updates (with optional repainting)
Speculative Zones: Fills highlight aggressive momentum moves beyond EMD bounds
Backtest Mode
Switch to Backtest Mode for performance evaluation over historical data:
Equity Curve Plot: Compare EMD Trend strategy vs. Buy & Hold
Trade Metrics Table: View number of trades, win/loss stats, profits
Performance Metrics Table: Includes CAGR, Sharpe, max drawdown, and more
Custom Start Date: Select from which date the backtest should begin
Trade Sizing: Configure capital and trade percentage per entry
Signal Filters: Choose from Long Only, Short Only, or Both
Alerts
Built-in alerts let you automate entries, exits, and trend transitions:
LONG (EMD Trend) - Trend flips to Long
SHORT (EMD Trend) - Trend flips to Short
RISK-ON LONG - Price crosses above upper EMD band
RISK-OFF LONG - Price crosses back below upper EMD band
RISK-ON SHORT - Price crosses below lower EMD band
RISK-OFF SHORT - Price crosses back above lower EMD band
Use Cases
Trend Confirmation with volatility-sensitive boundaries
Momentum Entry Filtering via breakout zones
Mean Reversion Avoidance in sideways markets
Backtesting & Strategy Building with real-time metrics
Disclaimer
This indicator is intended for informational and educational purposes only. It does not constitute investment advice. Historical performance does not guarantee future results. Always backtest and use in simulation before live trading.

Systemic Credit Market Pressure IndexSystemic Credit Market Pressure Index (SCMPI): A Composite Indicator for Credit Cycle Analysis
The Systemic Credit Market Pressure Index (SCMPI) represents a novel composite indicator designed to quantify systemic stress within credit markets through the integration of multiple macroeconomic variables. This indicator employs advanced statistical normalization techniques, adaptive threshold mechanisms, and intelligent visualization systems to provide real-time assessment of credit market conditions across expansion, neutral, and stress regimes. The methodology combines credit spread analysis, labor market indicators, consumer credit conditions, and household debt metrics into a unified framework for systemic risk assessment, featuring dynamic Bollinger Band-style thresholds and theme-adaptive visualization capabilities.
## 1. Introduction
Credit cycles represent fundamental drivers of economic fluctuations, with their dynamics significantly influencing financial stability and macroeconomic outcomes (Bernanke, Gertler & Gilchrist, 1999). The identification and measurement of credit market stress has become increasingly critical following the 2008 financial crisis, which highlighted the need for comprehensive early warning systems (Adrian & Brunnermeier, 2016). Traditional single-variable approaches often fail to capture the multidimensional nature of credit market dynamics, necessitating the development of composite indicators that integrate multiple information sources.
The SCMPI addresses this gap by constructing a weighted composite index that synthesizes four key dimensions of credit market conditions: corporate credit spreads, labor market stress, consumer credit accessibility, and household leverage ratios. This approach aligns with the theoretical framework established by Minsky (1986) regarding financial instability hypothesis and builds upon empirical work by Gilchrist & Zakrajšek (2012) on credit market sentiment.
## 2. Theoretical Framework
### 2.1 Credit Cycle Theory
The theoretical foundation of the SCMPI rests on the credit cycle literature, which posits that credit availability fluctuates in predictable patterns that amplify business cycle dynamics (Kiyotaki & Moore, 1997). During expansion phases, credit becomes increasingly available as risk perceptions decline and collateral values rise. Conversely, stress phases are characterized by credit contraction, elevated risk premiums, and deteriorating borrower conditions.
The indicator incorporates Kindleberger's (1978) framework of financial crises, which identifies key stages in credit cycles: displacement, boom, euphoria, profit-taking, and panic. By monitoring multiple variables simultaneously, the SCMPI aims to capture transitions between these phases before they become apparent in individual metrics.
### 2.2 Systemic Risk Measurement
Systemic risk, defined as the risk of collapse of an entire financial system or entire market (Kaufman & Scott, 2003), requires measurement approaches that capture interconnectedness and spillover effects. The SCMPI follows the methodology established by Bisias et al. (2012) in constructing composite measures that aggregate individual risk indicators into system-wide assessments.
The index employs the concept of "financial stress" as defined by Illing & Liu (2006), encompassing increased uncertainty about fundamental asset values, increased uncertainty about other investors' behavior, increased flight to quality, and increased flight to liquidity.
## 3. Methodology
### 3.1 Component Variables
The SCMPI integrates four primary components, each representing distinct aspects of credit market conditions:
#### 3.1.1 Credit Spreads (BAA-10Y Treasury)
Corporate credit spreads serve as the primary indicator of credit market stress, reflecting risk premiums demanded by investors for corporate debt relative to risk-free government securities (Gilchrist & Zakrajšek, 2012). The BAA-10Y spread specifically captures investment-grade corporate credit conditions, providing insight into broad credit market sentiment.
#### 3.1.2 Unemployment Rate
Labor market conditions directly influence credit quality through their impact on borrower repayment capacity (Bernanke & Gertler, 1995). Rising unemployment typically precedes credit deterioration, making it a valuable leading indicator for credit stress.
#### 3.1.3 Consumer Credit Rates
Consumer credit accessibility reflects the transmission of monetary policy and credit market conditions to household borrowing (Mishkin, 1995). Elevated consumer credit rates indicate tightening credit conditions and reduced credit availability for households.
#### 3.1.4 Household Debt Service Ratio
Household leverage ratios capture the debt burden relative to income, providing insight into household financial stress and potential credit losses (Mian & Sufi, 2014). High debt service ratios indicate vulnerable household sectors that may contribute to credit market instability.
### 3.2 Statistical Methodology
#### 3.2.1 Z-Score Normalization
Each component variable undergoes robust z-score normalization to ensure comparability across different scales and units:
Z_i,t = (X_i,t - μ_i) / σ_i
Where X_i,t represents the value of variable i at time t, μ_i is the historical mean, and σ_i is the historical standard deviation. The normalization period employs a rolling 252-day window to capture annual cyclical patterns while maintaining sensitivity to regime changes.
#### 3.2.2 Adaptive Smoothing
To reduce noise while preserving signal quality, the indicator employs exponential moving average (EMA) smoothing with adaptive parameters:
EMA_t = α × Z_t + (1-α) × EMA_{t-1}
Where α = 2/(n+1) and n represents the smoothing period (default: 63 days).
#### 3.2.3 Weighted Aggregation
The composite index combines normalized components using theoretically motivated weights:
SCMPI_t = w_1×Z_spread,t + w_2×Z_unemployment,t + w_3×Z_consumer,t + w_4×Z_debt,t
Default weights reflect the relative importance of each component based on empirical literature: credit spreads (35%), unemployment (25%), consumer credit (25%), and household debt (15%).
### 3.3 Dynamic Threshold Mechanism
Unlike static threshold approaches, the SCMPI employs adaptive Bollinger Band-style thresholds that automatically adjust to changing market volatility and conditions (Bollinger, 2001):
Expansion Threshold = μ_SCMPI - k × σ_SCMPI
Stress Threshold = μ_SCMPI + k × σ_SCMPI
Neutral Line = μ_SCMPI
Where μ_SCMPI and σ_SCMPI represent the rolling mean and standard deviation of the composite index calculated over a configurable period (default: 126 days), and k is the threshold multiplier (default: 1.0). This approach ensures that thresholds remain relevant across different market regimes and volatility environments, providing more robust regime classification than fixed thresholds.
### 3.4 Visualization and User Interface
The SCMPI incorporates advanced visualization capabilities designed for professional trading environments:
#### 3.4.1 Adaptive Theme System
The indicator features an intelligent dual-theme system that automatically optimizes colors and transparency levels for both dark and bright chart backgrounds. This ensures optimal readability across different trading platforms and user preferences.
#### 3.4.2 Customizable Visual Elements
Users can customize all visual aspects including:
- Color Schemes: Automatic theme adaptation with optional custom color overrides
- Line Styles: Configurable widths for main index, trend lines, and threshold boundaries
- Transparency Optimization: Automatic adjustment based on selected theme for optimal contrast
- Dynamic Zones: Color-coded regime areas with adaptive transparency
#### 3.4.3 Professional Data Table
A comprehensive 13-row data table provides real-time component analysis including:
- Composite index value and regime classification
- Individual component z-scores with color-coded stress indicators
- Trend direction and signal strength assessment
- Dynamic threshold status and volatility metrics
- Component weight distribution for transparency
## 4. Regime Classification
The SCMPI classifies credit market conditions into three distinct regimes:
### 4.1 Expansion Regime (SCMPI < Expansion Threshold)
Characterized by favorable credit conditions, low risk premiums, and accommodative lending standards. This regime typically corresponds to economic expansion phases with low default rates and increasing credit availability.
### 4.2 Neutral Regime (Expansion Threshold ≤ SCMPI ≤ Stress Threshold)
Represents balanced credit market conditions with moderate risk premiums and stable lending standards. This regime indicates neither significant stress nor excessive exuberance in credit markets.
### 4.3 Stress Regime (SCMPI > Stress Threshold)
Indicates elevated credit market stress with high risk premiums, tightening lending standards, and deteriorating borrower conditions. This regime often precedes or coincides with economic contractions and financial market volatility.
## 5. Technical Implementation and Features
### 5.1 Alert System
The SCMPI includes a comprehensive alert framework with seven distinct conditions:
- Regime Transitions: Expansion, Neutral, and Stress phase entries
- Extreme Conditions: Values exceeding ±2.0 standard deviations
- Trend Reversals: Directional changes in the underlying trend component
### 5.2 Performance Optimization
The indicator employs several optimization techniques:
- Efficient Calculations: Pre-computed statistical measures to minimize computational overhead
- Memory Management: Optimized variable declarations for real-time performance
- Error Handling: Robust data validation and fallback mechanisms for missing data
## 6. Empirical Validation
### 6.1 Historical Performance
Backtesting analysis demonstrates the SCMPI's ability to identify major credit stress episodes, including:
- The 2008 Financial Crisis
- The 2020 COVID-19 pandemic market disruption
- Various regional banking crises
- European sovereign debt crisis (2010-2012)
### 6.2 Leading Indicator Properties
The composite nature and dynamic threshold system of the SCMPI provides enhanced leading indicator properties, typically signaling regime changes 1-3 months before they become apparent in individual components or market indices. The adaptive threshold mechanism reduces false signals during high-volatility periods while maintaining sensitivity during regime transitions.
## 7. Applications and Limitations
### 7.1 Applications
- Risk Management: Portfolio managers can use SCMPI signals to adjust credit exposure and risk positioning
- Academic Research: Researchers can employ the index for credit cycle analysis and systemic risk studies
- Trading Systems: The comprehensive alert system enables automated trading strategy implementation
- Financial Education: The transparent methodology and visual design facilitate understanding of credit market dynamics
### 7.2 Limitations
- Data Dependency: The indicator relies on timely and accurate macroeconomic data from FRED sources
- Regime Persistence: Dynamic thresholds may exhibit brief lag during extremely rapid regime transitions
- Model Risk: Component weights and parameters require periodic recalibration based on evolving market structures
- Computational Requirements: Real-time calculations may require adequate processing power for optimal performance
## References
Adrian, T. & Brunnermeier, M.K. (2016). CoVaR. *American Economic Review*, 106(7), 1705-1741.
Bernanke, B. & Gertler, M. (1995). Inside the black box: the credit channel of monetary policy transmission. *Journal of Economic Perspectives*, 9(4), 27-48.
Bernanke, B., Gertler, M. & Gilchrist, S. (1999). The financial accelerator in a quantitative business cycle framework. *Handbook of Macroeconomics*, 1, 1341-1393.
Bisias, D., Flood, M., Lo, A.W. & Valavanis, S. (2012). A survey of systemic risk analytics. *Annual Review of Financial Economics*, 4(1), 255-296.
Bollinger, J. (2001). *Bollinger on Bollinger Bands*. McGraw-Hill Education.
Gilchrist, S. & Zakrajšek, E. (2012). Credit spreads and business cycle fluctuations. *American Economic Review*, 102(4), 1692-1720.
Illing, M. & Liu, Y. (2006). Measuring financial stress in a developed country: An application to Canada. *Journal of Financial Stability*, 2(3), 243-265.
Kaufman, G.G. & Scott, K.E. (2003). What is systemic risk, and do bank regulators retard or contribute to it? *The Independent Review*, 7(3), 371-391.
Kindleberger, C.P. (1978). *Manias, Panics and Crashes: A History of Financial Crises*. Basic Books.
Kiyotaki, N. & Moore, J. (1997). Credit cycles. *Journal of Political Economy*, 105(2), 211-248.
Mian, A. & Sufi, A. (2014). What explains the 2007–2009 drop in employment? *Econometrica*, 82(6), 2197-2223.
Minsky, H.P. (1986). *Stabilizing an Unstable Economy*. Yale University Press.
Mishkin, F.S. (1995). Symposium on the monetary transmission mechanism. *Journal of Economic Perspectives*, 9(4), 3-10.

Momentum Long + Short Strategy (BTC 3H)Momentum Long + Short Strategy (BTC 3H)
🔍 How It Works, Step by Step
Detect the Trend (📈/📉)
Calculate two moving averages (100-period and 500-period), either EMA or SMA.
For longs, we require MA100 > MA500 (uptrend).
For shorts, we block entries if MA100 exceeds MA500 by more than a set percentage (to avoid fading a powerful uptrend).
Apply Momentum Filters (⚡️)
RSI Filter: Measures recent strength—only allow longs when RSI crosses above its smoothed average, and shorts when RSI dips below the oversold threshold.
ADX Filter: Gauges trend strength—ensures we only enter when a meaningful trend exists (optional).
ATR Filter: Confirms volatility—avoids choppy, low-volatility conditions by requiring ATR to exceed its smoothed value (optional).
Confirm Entry Conditions (✅)
Long Entry:
Price is above both MAs
Trend alignment & optional filters pass ✅
Short Entry:
Price is below both MAs and below the lower Bollinger Band
RSI is sufficiently oversold
Trend-blocker & ATR filter pass ✅
Position Sizing & Risk (💰)
Each trade uses 100 % of account equity by default.
One pyramid addition allowed, so you can scale in if the move continues.
Commission and slippage assumptions built in for realistic backtests.
Stops & Exits (🛑)
Long Stop-Loss: e.g. 3 % below entry.
Long Auto-Exit: If price falls back under the 500-period MA.
Short Stop-Loss: e.g. 3 % above entry.
Short Take-Profit: e.g. 4 % below entry.
🎨 Why It’s Powerful & Customizable
Modular Filters: Turn on/off RSI, ADX, ATR filters to suit different market regimes.
Adjustable Thresholds: Fine-tune stop-loss %, take-profit %, RSI lengths, MA gaps and more.
Multi-Timeframe Potential: Although coded for 3 h BTC, you can adapt it to stocks, forex or other cryptos—just recalibrate!
Backtest Fine-Tuned: Default settings were optimized via backtesting on historical BTC data—but they’re not guarantees of future performance.
⚠️ Warning & Disclaimer
This strategy is for educational purposes only and designed for a toy fund. Crypto markets are highly volatile—you can lose 100 % of your capital. It is not a predictive “holy grail” but a rules-based framework using past data. The parameters have been fine-tuned on historical data and are not valid for future trades without fresh calibration. Always practice with paper-trading first, use proper risk management, and do your own research before risking real money. 🚨🔒
Good luck exploring and experimenting! 🚀📊

Big Mover Catcher BTC 4h🧠 Big Mover Catcher (BTC 4H Strategy) — Educational Tool
⚠️ Disclaimer: I am not a financial advisor. This script is for educational and testing purposes only. Cryptocurrency trading is highly volatile and involves significant risk. You can lose all of your invested capital.
📌 Overview
The Big Mover Catcher strategy is a work-in-progress trading system designed for Bitcoin (BTC) on the 4-hour chart. It aims to identify strong breakout moves by combining multiple technical indicators and conditions, allowing for high customization and filter-based confirmations.
This script is part of a personal project to learn Pine Script and backtesting on TradingView. It is currently in the testing and research phase.
🎯 Strategy Objective
Catch large, high-momentum breakout moves in the BTC market using:
Bollinger Band breakouts for entry signals
Momentum, volatility, and trend filters for trade confirmation
🧰 Features & Filters
The script provides a flexible set of filters that can be turned ON/OFF and adjusted directly from the settings panel:
✅ Entry Conditions
Price must break above or below Bollinger Bands
All selected filters must align before entry
🧪 Available Filters:
Relative Strength Index (RSI) with EMA/SMA smoothing
Average Directional Index (ADX) with EMA/SMA smoothing
Average True Range (ATR) with EMA/SMA smoothing
MACD Signal above or below zero
EMA 350 trend filter
ATR / ADX / RSI Threshold toggles for added control
🔥 Additional Feature:
Force Take Profit: Optionally closes the trade immediately if a candle closes with more than a defined % movement (default: 5%). This can help lock in quick profits during high volatility moves.
⚙️ Customizable Inputs
You can configure:
Stop loss percentage
All indicator lengths
Smoothing types (EMA/SMA)
Threshold activation toggles
Individual filter ON/OFF switches
This makes the strategy highly adaptable for educational exploration and optimization.
📊 Best Used For
Learning Pine Script and strategy structure
Testing filter combinations for BTC on the 4H timeframe
Understanding how different indicators interact in live markets
⚠️ Note: ❌ Short trades are currently disabled by default, as short-side logic is still under development.
❗ Final Reminder
This script is not financial advice. It is an educational tool. Use it to learn and explore trading logic. Trading cryptocurrencies carries high risk — only invest what you can afford to lose.

[TehThomas] - Fair Value GapsThis script is designed to automatically detect and visualize Fair Value Gaps (FVGs) on your chart in a clean, intuitive, and highly responsive way. It’s built with active traders in mind, offering both dynamic updates and customization options that help you stay focused on price action without being distracted by outdated or irrelevant information.
What Are Fair Value Gaps?
Fair Value Gaps are areas on a chart where there’s an inefficiency in price, typically formed when price moves aggressively in one direction, leaving a gap between the wicks of consecutive candles. These gaps represent imbalanced price action where not all buy or sell orders were efficiently matched. As a result, they often become magnet zones where price returns later to "fill" the imbalance before continuing in its intended direction. Many traders use them as points of interest for entries, re-entries, or anticipating reversals and consolidations.
This concept is frequently used in Smart Money and ICT-based trading models, where understanding how price seeks efficiency is crucial to anticipating future moves. When combined with concepts like liquidity, displacement, and market structure, FVGs become powerful tools for technical decision-making.
Script Features & Functionality
1. Live Updating Gaps (Dynamic Shrinking)
One of the core features of this script is its ability to track and dynamically shrink Fair Value Gaps as price trades into them. Instead of leaving a static zone on your chart, the gap will adjust in real-time, reflecting the portion that has been filled. This gives you a much more accurate picture of remaining imbalance and avoids misleading zones.
2. Automatic Cleanup After Fill
Once price fully fills an FVG, the script automatically removes it from the chart. This helps keep your workspace clean and focused only on relevant price zones. There’s no need to manually manage your gaps, everything is handled behind the scenes to reduce clutter and distraction.
3. Static Mode Option
While dynamic updating is the default, some traders may prefer to keep the original size of the gap visible even after partial fills. For that reason, the script includes a toggle to switch from live-updating (shrinking) mode to static mode. In static mode, FVGs stay fixed from the moment they are drawn, giving you a more traditional visual reference point.
4. Multi-Timeframe Support (MTF)
You can now view higher timeframe FVGs, such as those from the 1H or 4H chart, while analyzing lower timeframes like the 5-minute. This allows you to see key imbalances from broader market context without having to flip between charts. FVGs from higher timeframes will be drawn distinctly so you can differentiate them at a glance.
5. Cleaner Visualization
The script is designed with clarity in mind. All drawings are streamlined, and filled gaps are removed to maintain a minimal, distraction-free chart. This makes it easier to combine this tool with other indicators or price-action-based strategies without overloading your workspace.
6. Suitable for All Market Types
This script can be used on any asset that displays candlestick-based price action — including crypto, forex, indices, and stocks. Whether you're scalping low-timeframe setups or swing trading with a higher timeframe bias, FVGs remain a useful concept and this script adapts to your trading style.
Use Case Examples
On a 5-minute chart, display 1-hour FVGs to catch major imbalance zones during intraday trading.
Combine the FVGs with liquidity levels and inducement patterns to build ICT-style trade setups.
Use live-updating gaps to monitor in-progress fills and evaluate whether a zone still holds validity.
Set the script to static mode to perform backtesting or visual replay with historical setups.
Final Notes
Fair Value Gaps are not a standalone trading signal, but when used with market structure, liquidity, displacement, and order flow concepts, they provide high-probability trade locations that align with institutional-style trading models. This script simplifies the visualization of those zones so you can react faster, stay focused on clean setups, and eliminate unnecessary distractions.
Whether you’re trading high volatility breakouts or patiently waiting for retracements into unfilled imbalances, this tool is designed to support your edge with precision and flexibility.

Alert TrendThis indicator is designed to function as a dynamic BIAS tool but can be adapted to various strategies depending on user needs.
Key Features and Integration:
Personally, I pair it with the "EMA Suite" indicator, as my strategy revolves around Fibonacci-based moving averages. The indicator uses EMA 55 and EMA 233 as trend references, triggering a trend shift when a candle closes fully above or below these levels. To maintain structural integrity, the EMA values are not user-configurable in the settings: adjustments require direct script modification (e.g., switching to EMA 50 and EMA 200, widely recognized reference levels), this ensures logical consistency for advanced users familiar with Pine Script.
Output Signals and Interpretation:
The indicator generates four distinct signals:
1. Uptrend: Candle closes above both EMA 55 and EMA 233.
2. Weak Uptrend: Candle closes above EMA 55 but below EMA 233.
3. Downtrend: Candle closes below both EMA 55 and EMA 233.
4. Weak Downtrend: Candle closes below EMA 55 but above EMA 233.
The area between the two EMAs represents a "complex zone" where price action contradicts higher timeframe trends. To resolve ambiguity, combine this indicator with a primary timeframe (e.g., H4) and a confirmation timeframe (e.g., H1). In smaller timeframes may also serve as entry signals, a feature currently under exploration for automation.
Alert System and Strategy Integration:
The indicator includes customizable alerts for all four signals collectively or individually, streamlining integration into Strategy scripts. This flexibility enhances adaptability for backtesting or live trading.
Critical Note:
Configure the indicator to display exclusively on the selected timeframe. Higher intervals fail to render all signals due to overlapping visualizations, distorting analysis. To resolve this, set the visibility parameter to "Visibility on intervals/Current interval and below" in the chart settings. This ensures clarity and preserves signal accuracy.
Development Status and Collaboration:
As part of an ongoing project, this tool is already integrated into my personal strategy. While functional and publicly shareable, further refinements are planned. Though not a professional developer, I utilize Deepseek for coding assistance and possess sufficient Pine Script literacy to oversee the logic. Feedback, suggestions, and collaborations are welcome to optimize its utility.
I hope this tool proves valuable to fellow traders navigating multi-timeframe analysis and trend confirmation.
Support BandsSupport Bands – Discount Zones for Bitcoin
⚡Overview:
-The Support Bands indicator identifies one of the most tested and respected support zones for Bitcoin using moving averages from higher timeframes.
-These zones are visualized through colored bands (blue, white, and violet), simplifying the decision making process especially for less experienced traders who seek high-probability areas to accumulate Bitcoin during retracements.
-Band levels are based on manual backtesting and real-world price behavior throughout Bitcoin’s history.
-Each zone reflects a different degree of support strength, from temporary pullback zones to historical bottoms.
⚡️ Key Characteristics:
-Highlights discount zones where Bitcoin has historically shown strong reactions.
-Uses 3 different levels of supports based on EMA/SMA combinations.
-Offers a clean, non-intrusive overlay that reduces chart clutter.
⚡ How to Use:
-Open your chart on the 1W timeframe and select the BTC Bitstamp or BLX symbol, as they provide the most complete historical data, ensuring optimal performance of the indicator.
-Use the bands as reference zones for support and potential pullbacks.
- Level 3 (violet band) historically marks the bottom of Bitcoin bear markets and is ideal for long-term entries during deep corrections.
- Level 2 (white band) often signals macro reaccumulation zones but usually requires 1–3 months of consolidation before a breakout. If the price closes below and then retests this level as resistance for 1–2 weekly candles, it often marks the start of a macro downtrend.
-Level 1 (blue band) acts as short-term support during strong bullish moves, typically after a successful rebound from Level 2.
⚡ What Makes It Unique:
- This script merges moving averages per level into three simplified bands for clearer analysis.
-Reduces chart noise by avoiding multiple overlapping lines, helping you make faster and cleaner decisions.
- Built from manual market study based on recurring Bitcoin behavior, not just random code.
-Historically backtested:
-Level 3 (violet band) until today has always marked the bitcoin bearmarket bottom.
- Level 2 (white band) is the strongest support during bull markets; losing it often signals a macro trend reversal.
- Level 1 is frequently retested during impulsive rallies and can act as short-term support or resistance.
⚡ Disclaimer:
-This script is a visual tool to assist with market analysis.
-It does not generate buy or sell signals, nor does it predict future movements.
-Historical performance is not indicative of future results.
-Always use independent judgment and proper risk management.
⚡ Why Use Support Bands:
-Ideal for traders who want clarity without dozens of lines on their charts.
- Helps identify logical zones for entry or reaccumulation.
- Based on actual market behavior rather than hypothetical setups.
-If the blue band (Level 1) doesn't hold as support, the price often moves to the white band (Level 2), and if that fails too, the violet band (Level 3) is typically the last strong support. By dividing your capital into three planned entries, one at each level,you can manage risk more effectively compared to entering blindly without this structure.
[blackcat] L3 Volume Sync TradeOVERVIEW
The L3 Volume Sync Trade indicator empowers traders 📈💹 with advanced tools to pinpoint precise entry and exit points leveraging intricate volume and price momentum analyses. By encapsulating sophisticated technical calculations into an intuitive visual format, this script aids in identifying high-probability trades while minimizing guesswork. Whether you're a seasoned trader looking to enhance your strategy or a newcomer seeking structured guidance, this indicator offers invaluable insights tailored to elevate your trading precision.
FEATURES
Advanced Volume Analysis 📊✨: Employs comprehensive volume dynamics to spot underlying market trends and resonance levels, allowing you to align your trades with significant movements.
Dynamic Price Momentum Metrics ⚡️: Computes both immediate and sustained price strengths, providing a holistic view of market directionality.
Customizable Indicators 🎯: Adjustable periods across multiple moving averages ensure flexibility in adapting the script to diverse trading styles and timeframes.
Intuitive Visual Representation 🖼️: Displays critical information via colorful histograms and candlestick patterns, facilitating quick comprehension even amidst fast-paced markets.
Automated Buy/Sell Labels 🔍: Clearly marks chart locations where buy/sell actions are recommended, reducing the need for constant manual monitoring.
Real-Time Alert Capabilities 🔔: Stay ahead with customizable alerts that notify you instantly whenever favorable trading conditions arise.
HOW TO USE
Initial Setup:
Begin by adding the L3 Volume Sync Trade indicator to your TradingView chart.
Familiarize yourself with the default settings provided within the script’s input parameters.
Configuring Input Parameters:
Short Period: Adjust if focusing on shorter-term fluctuations; defaults at 5 bars.
Long Period: Ideal for capturing broader trends over extended intervals; set initially at 27 bars.
EMA and SMA Periods: Tweak these for fine-tuning the sensitivity of trend-following mechanisms; default values are 3 and 3 respectively.
Long/EMA Periods: These influence smoothing effects; start with 360 and 21 respectively but experiment based on volatility.
Capital Threshold: Defines minimal risk level per trade; default set at 1 unit but can be increased/decreased based on your risk appetite.
Understanding Chart Elements:
Histograms & Candles: Blue/green histograms represent positive-negative resonances, red/green bands signify crossover events, aqua candles denote resonance points, orange highlights trade signals.
Labels: Green “BUY” tags appear above bars indicating bullish conditions; red “SELL” tags below bars suggest bearish reversals.
Activating Alarms:
Go to the alert settings in TradingView.
Enable conditional alerts for buy/sell signals ensuring timely responses without missing crucial moves.
Monitoring Performance:
Keep track of how often alerts trigger versus actual winning trades.
Periodically revisit input adjustments to optimize responsiveness under varying market phases.
ADVANCED USAGE TIPS
Backtesting Your Strategy: Before going live, apply historical data tests to gauge reliability.
Combining With Other Tools: Enhance accuracy by integrating additional indicators like RSI or MACD alongside Volume Sync.
Risk Management Integration: Use stop-loss/take-profit markers derived from script outputs to safeguard capital efficiently.
LIMITATIONS
Market Conditions Variability: Different assets or volatile environments might yield inconsistent outcomes.
Dependent On User Expertise: Best utilized by those familiar with technical analysis fundamentals.
Limited Flexibility In Real-time Adjustments: Once applied, real-time tweaking requires reloading script which might delay responses during rapid market shifts.
NOTES
Parameter Sensitivity: Minor changes can lead to drastic differences; always test modifications cautiously.
Regular Reviews: Continuously assess indicator efficacy against evolving market behaviors.
Complementary Techniques: Supplement this script with fundamental analysis or news-driven insights for well-rounded decisions.
THANKS
A heartfelt acknowledgment goes to our community of developers and enthusiasts whose feedback has been instrumental in refining this powerful indicator.

Anomaly Counter-Trend StrategyA mean-reversion style strategy that automatically spots unusually large price moves over a configurable lookback period and takes the opposite side, with full risk-management, commission and slippage modeling—built in Pine Script® v6.
🔎 Overview
ACTS monitors the percent-change over the past N minutes and, when that move exceeds your chosen threshold, enters a counter-trend position (short on a strong rise; long on a sharp fall). It’s ideal for markets that often “overshoot” and snap back, and can be applied on any symbol or timeframe.
⚙️ Key Features
Anomaly Detection: Detect abnormal price swings based on a user-defined % change over a lookback period.
Counter-Trend Entries: Auto-enter short on rise anomalies, long on fall anomalies (with seamless flat↔reverse transitions).
Risk Management: Configurable stop-loss and take-profit in ticks per trade.
Realistic Modeling: Simulates commissions (0.05 % default), slippage (2 ticks), and percent-of-equity sizing.
Immediate Bar-Close Execution: Orders processed on bar close for faster fills.
Visual Aids: Optional on-chart BUY/SELL triangles and background highlights during anomaly periods.
⚙️ Inputs
Input Default Description
Percentage Threshold (%) 2.00 Min % move over lookback to trigger an anomaly.
Lookback Period (Minutes) 15 Number of minutes over which to measure change.
Stop Loss (Ticks) 100 Distance from entry for stop-loss exit.
Take Profit (Ticks) 200 Distance from entry for take-profit exit.
Plot Trade Signal Shapes (on/off) true Show BUY/SELL triangles on chart.
Highlight Anomaly Background true Shade background during anomaly bars.
📊 How to Use
Add to Chart: Apply the script to any ticker & timeframe.
Tune: Adjust your percentage threshold and lookback to match each instrument’s volatility.
Review Backtest: Check built-in strategy performance (drawdown, Sharpe, etc.) under the Strategy Tester tab.
Go Live: Once optimized, link to alerts or your trade execution system.
⚠️ Disclaimer
This script is provided “as-is” for educational purposes and backtesting only. Past performance does not guarantee future results. Always backtest thoroughly, manage your own risk, and consider market conditions before live trading.
Enjoy experimenting—and may your counter-trend entries catch the next big snapback!
SuperTrade ST1 StrategyOverview
The SuperTrade ST1 Strategy is a long-only trend-following strategy that combines a Supertrend indicator with a 200-period EMA filter to isolate high-probability bullish trade setups. It is designed to operate in trending markets, using volatility-based exits with a strict 1:4 Risk-to-Reward (R:R) ratio, meaning that each trade targets a profit 4× the size of its predefined risk.
This strategy is ideal for traders looking to align with medium- to long-term trends, while maintaining disciplined risk control and minimal trade frequency.
How It Works
This strategy leverages three key components:
Supertrend Indicator
A trend-following indicator based on Average True Range (ATR).
Identifies bullish/bearish trend direction by plotting a trailing stop line that moves with price volatility.
200-period Exponential Moving Average (EMA) Filter
Trades are only taken when the price is above the EMA, ensuring participation only during confirmed uptrends.
Helps filter out counter-trend entries during market pullbacks or ranges.
ATR-Based Stop Loss and Take Profit
Each trade uses the ATR to calculate volatility-adjusted exit levels.
Stop Loss: 1× ATR below entry.
Take Profit: 4× ATR above entry (1:4 R:R).
This asymmetry ensures that even with a lower win rate, the strategy can remain profitable.
Entry Conditions
A long trade is triggered when:
Supertrend flips from bearish to bullish (trend reversal).
Price closes above the Supertrend line.
Price is above the 200 EMA (bullish market bias).
Exit Logic
Once a long position is entered:
Stop loss is set 1 ATR below entry.
Take profit is set 4 ATR above entry.
The strategy automatically exits the position on either target.
Backtest Settings
This strategy is configured for realistic backtesting, including:
$10,000 account size
2% equity risk per trade
0.1% commission
1 tick slippage
These settings aim to simulate real-world conditions and avoid overly optimistic results.
How to Use
Apply the script to any timeframe, though higher timeframes (1H, 4H, Daily) often yield more reliable signals.
Works best in clearly trending markets (especially in crypto, stocks, indices).
Can be paired with alerts for live trading or analysis.
Important Notes
This version is long-only by design. No short positions are executed.
Ideal for swing traders or position traders seeking asymmetric returns.
Users can modify the ATR period, Supertrend factor, or EMA filter length based on asset behavior.

[blackcat] L3 Market Pulse InsightOVERVIEW
The L3 Market Pulse Insight provides comprehensive analytics by evaluating key price metrics to reveal critical market sentiment and potential trade opportunities 📊🔍. This advanced indicator leverages proprietary calculations involving Simple Moving Averages (SMAs), Exponential Moving Averages (EMAs), and custom thresholds to deliver detailed insights into current market dynamics 🚀✨.
By plotting various lines representing core fundamentals and directional cues, traders gain visibility into underlying trends and shifts within the market pulse. The visual aids simplify complex data interpretation, making it easier for users to make strategic decisions based on clear, actionable information ✅⛈️.
FEATURES
Advanced Calculation Techniques:
Employs sophisticated formulas integrating SMAs and EMAs for precise trend analysis.
Incorporates fundamental lines and confirmations based on recent price extremes.
Comprehensive Visualization:
Plots multiple informational lines: Fundamental Line, Thresholds, Institutional Directions, etc., each reflecting unique aspects of price behavior.
Uses distinct colors for easy differentiation between bearish and bullish indications.
Customizable Alerts:
Generates "Buy" and "Sell" labels at pivotal moments, highlighting entry/exit points visually.
Offers flexibility to modify alert styles and positions according to user preferences.
Dynamic Adaptability:
Continuously updates plots and alerts based on incoming real-time data for timely responses.
Provides dynamic support/resistance levels adapting to evolving market conditions.
HOW TO USE
Installing the Indicator:
To start using the L3 Market Pulse Insight, add it via the Pine Editor on TradingView:
Open the editor from the bottom panel.
Copy-paste the provided script code.
Click “Add to Chart” after pasting.
Understanding Key Lines:
Familiarize yourself with what each plotted line signifies:
Fundamental Line: Represents core price movements adjusted through SMA transformations.
Low Confirmation & Warnings: Provide early signals about potential reversals or continuation scenarios.
Threshold B: Acts as a significant barrier indicating overbought/sold conditions.
Institutional Directions: Offer insights into larger player activities and intentions.
Interpreting Signals:
Pay close attention to generated "Buy" and "Sell" labels appearing directly on your chart:
"Buy" Label: Indicates favorable momentum crossing from below the confirmation level upwards.
"Sell" Label: Suggests bearish transitions when moving beneath set thresholds.
Adjusting Parameters:
While this version primarily uses default settings derived from optimal testing ranges, feel free to experiment:
Modify lookback periods in SMA/EMA functions if different timeframes align better with your strategy.
Customize plot colors/styles for enhanced readability and personal taste.
Integrating with Other Tools:
Enhance the reliability of signals produced by combining them with complementary indicators like RSI, MACD, or volume profiles for thorough validation.
Continuous Monitoring:
Regularly review performance and refine strategies incorporating insights gathered from L3 Market Pulse Insight across varying markets and assets.
LIMITATIONS
Data Dependency: Performance heavily relies on accurate historical data without anomalies.
Market Conditions Variability: Effectiveness may vary during extreme volatility or thin liquidity environments.
Parameter Fine-Tuning: Optimal configuration might differ significantly across instruments; continuous adjustments are necessary.
No Guarantees: Like any tool, this doesn't ensure profits and should be part of a broader analytical framework.
NOTES
Ensure solid grounding in technical analysis principles before deploying solely upon these insights.
Utilize backtesting rigorously under diverse market cycles to assess robustness thoroughly.
Consider external factors such as economic reports, geopolitical events influencing asset prices beyond purely statistical models.
Maintain discipline adhering predefined risk management protocols regardless of signal strength displayed here.
THANKS
We appreciate every member's contributions who have engaged actively throughout our development journey, offering constructive feedback driving improvements continually 🙏. Together we strive toward creating ever-more robust tools empowering traders worldwide!