Inside/Outside Bar Sequence Detector# Inside/Outside Bar Sequence Detector
## English Description
**Inside/Outside Bar Sequence Detector**
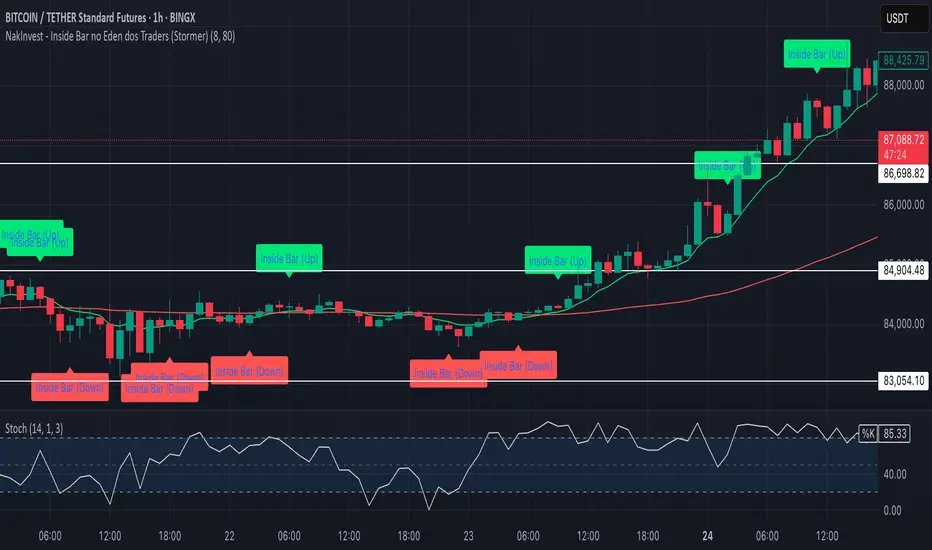
This indicator identifies and visualizes sequences of Inside and Outside bars on any chart. It highlights important price action patterns that can signal potential market reversals or continuation moves.
**Key Features:**
- Automatically detects consecutive Inside bars (where price action is contained within the previous bar's range) and Outside bars (where price action exceeds the previous bar's range)
- Displays sequences with customizable labels showing the pattern type
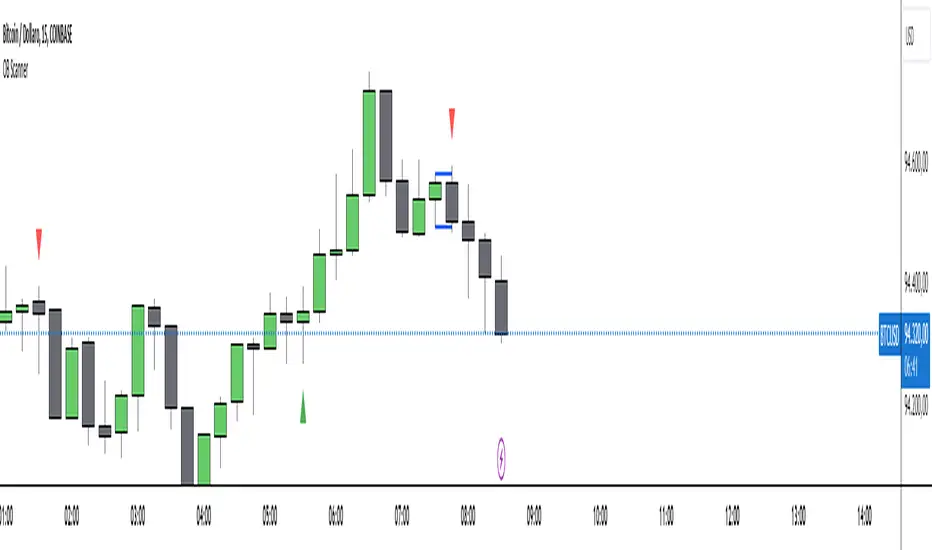
- Highlights the price range of each sequence with a transparent box
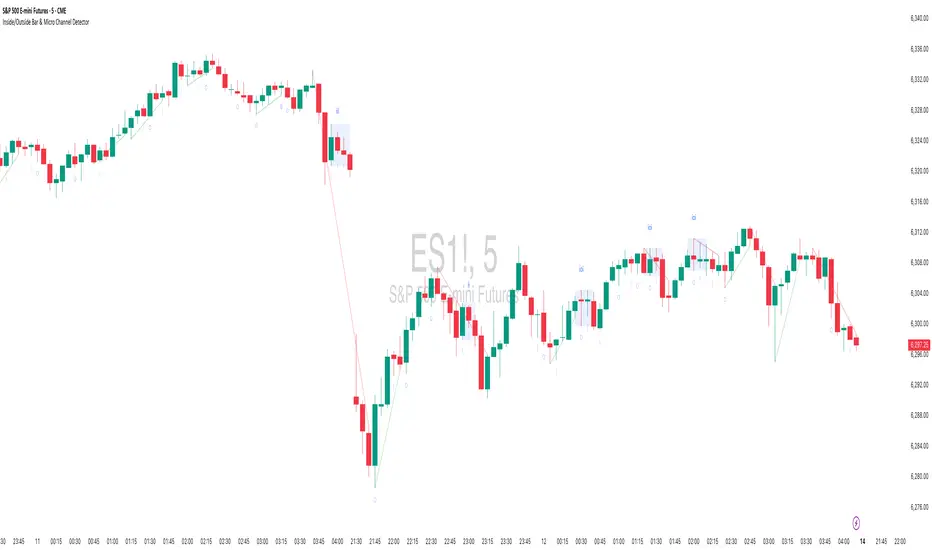
- Marks individual Inside bars with "i" and Outside bars with "o" below each candle
- Applies special pattern recognition rules for more accurate trade signals
- Fully customizable appearance including colors, opacity, and label positioning
Adjust the minimum sequence length according to your trading timeframe and strategy to filter out noise and focus on significant patterns.
## 中文描述
**内包/外包K线序列检测器**
这个指标可以识别并可视化任何图表上的内包和外包K线序列。它突出显示重要的价格行为模式,这些模式可能预示市场潜在的反转或延续走势。
**主要特点:**
- 自动检测连续的内包K线(价格活动被限制在前一根K线范围内)和外包K线(价格活动超出前一根K线范围)
- 通过可自定义的标签显示模式类型
- 用透明框突出显示每个序列的价格范围
- 在每根K线下方用"i"标记内包蜡烛,用"o"标记外包蜡烛
- 应用特殊模式识别规则,提供更准确的交易信号
- 完全可自定义的外观,包括颜色、透明度和标签位置
根据您的交易时间框架和策略调整最小序列长度,以过滤噪音并专注于重要模式。
Pine Script®指標