HTF Candle Range Box (Fixed to HTF Bars)### **Higher Timeframe Candle Range Box (HTF Box Indicator)**
This indicator visually highlights the price range of the most recently closed higher-timeframe (HTF) candle, directly on a lower-timeframe chart. It dynamically adjusts based on the user-selected HTF setting (e.g., 15-minute, 1-hour) and ensures that the box is displayed only on the bars that correspond to that specific HTF candle’s duration.
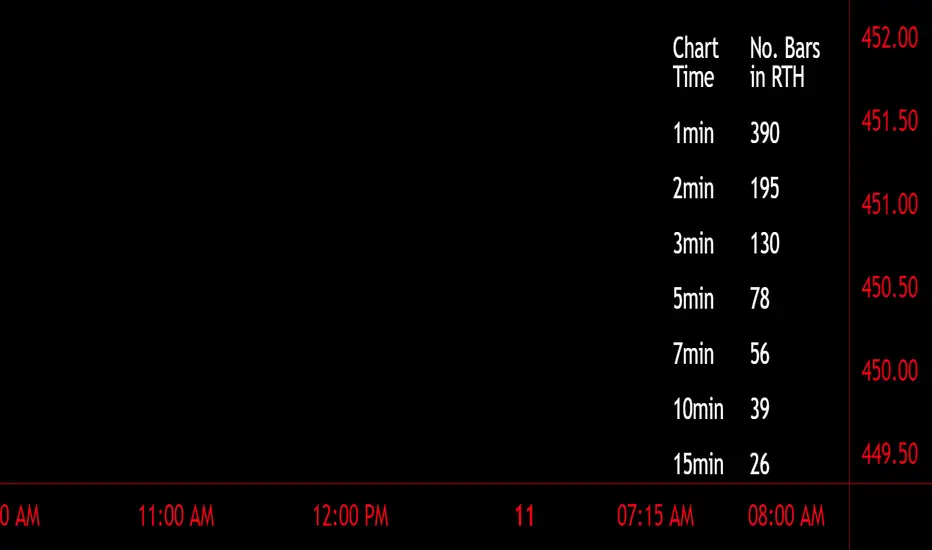
For instance, if a trader is on a **1-minute chart** with the **HTF set to 15 minutes**, the indicator will draw a box spanning exactly 15 one-minute candles, corresponding to the previous 15-minute HTF candle. The box updates only when a new HTF candle completes, ensuring that it does not change mid-formation.
---
### **How It Works:**
1. **Retrieves Higher Timeframe Data**
The script uses TradingView’s `request.security` function to pull **high, low, open, and close** values from the **previously completed HTF candle** (using ` ` to avoid repainting). It also fetches the **high and low of the candle before that** (using ` `) for comparison.
2. **Determines Breakout Behavior**
It compares the **last closed HTF candle** to the **one before it** to determine whether:
- It **broke above** the previous high.
- It **broke below** the previous low.
- It **broke both** the high and low.
- It **stayed within the previous candle’s range** (no breakout).
3. **Classifies the Candle & Assigns Color**
- **Green (Bullish)**
- Closes above the previous candle’s high.
- Breaks below the previous candle’s low but closes back inside the previous range **if it opened above** the previous high.
- **Red (Bearish)**
- Closes below the previous candle’s low.
- Breaks above the previous candle’s high but closes back inside the previous range **if it opened below** the previous low.
- **Orange (Neutral/Indecisive)**
- Stays within the previous candle’s range.
- Breaks both the high and low but closes inside the previous range without a clear bias.
4. **Box Placement on the Lower Timeframe**
- The script tracks the **bar index** where each HTF candle starts on the lower timeframe (e.g., every 15 bars on a 1-minute chart if HTF = 15 minutes).
- It **only displays the box on those bars**, ensuring that the range is accurately reflected for that time period.
- The box **resets and updates** only when a new HTF candle completes.
---
### **Key Features & Advantages:**
✅ **Clear Higher Timeframe Context:**
- The indicator provides a structured way to analyze HTF price action while trading in a lower timeframe.
- It helps traders identify **HTF support and resistance zones**, potential **breakouts**, and **failed breakouts**.
✅ **Fixed Box Display (No Mid-Candle Repainting):**
- The box is drawn **only after the HTF candle closes**, avoiding misleading fluctuations.
- Unlike other indicators that update live, this one ensures the trader is looking at **confirmed data** only.
✅ **Flexible Timeframe Selection:**
- The user can set **any HTF resolution** (e.g., 5min, 15min, 1hr, 4hr), making it adaptable for different strategies.
✅ **Dynamic Color Coding for Quick Analysis:**
- The **color of the box reflects the market sentiment**, making it easier to spot trends, reversals, and fake-outs.
✅ **No Clutter – Only Applies to the Relevant Bars:**
- Instead of spanning across the whole chart, the range box is **only visible on the bars belonging to the last HTF period**, keeping the chart clean and focused.
---
### **Example Use Case:**
💡 Imagine a trader is scalping on the **1-minute chart** but wants to factor in **HTF 15-minute structure** to avoid getting caught in bad trades. With this indicator:
- They can see whether the last **15-minute candle** was bullish, bearish, or indecisive.
- If it was **bullish (green)**, they may look for **buying opportunities** at lower timeframes.
- If it was **bearish (red)**, they might anticipate **a potential pullback or continuation down**.
- If the **HTF candle failed to break out**, they know the market is **ranging**, avoiding unnecessary trades.
---
### **Final Thoughts:**
This indicator is a **powerful addition for traders who combine multiple timeframes** in their analysis. It provides a **clean and structured way to track HTF price movements** without cluttering the chart or requiring constant manual switching between timeframes. Whether used for **intraday trading, swing trading, or scalping**, it adds an extra layer of confirmation for trade entries and exits.
🔹 **Best for traders who:**
- Want **HTF structure awareness while trading lower timeframes**.
- Need **confirmation of breakouts, failed breakouts, or indecision zones**.
- Prefer a **non-repainting tool that only updates after confirmed HTF closes**.
Let me know if you want any adjustments or additional features! 🚀
Pine Script®指標