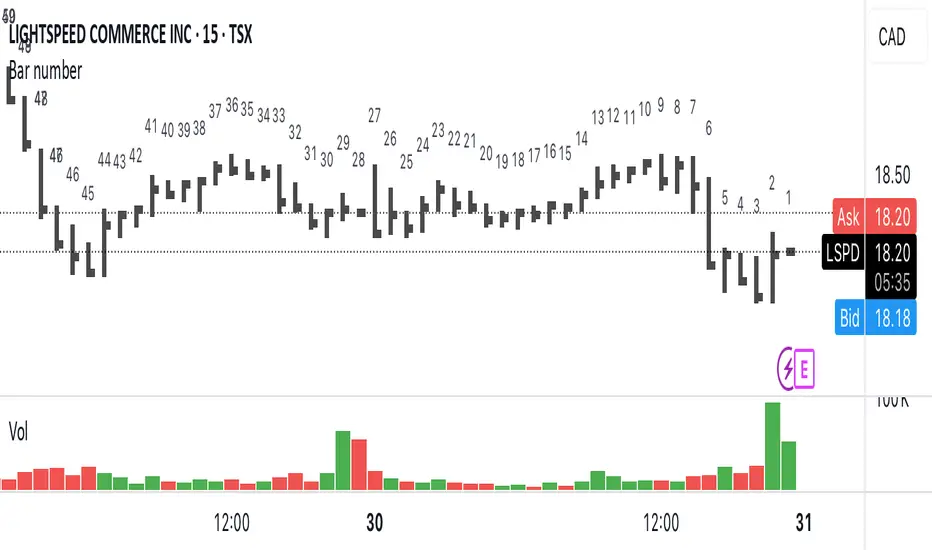
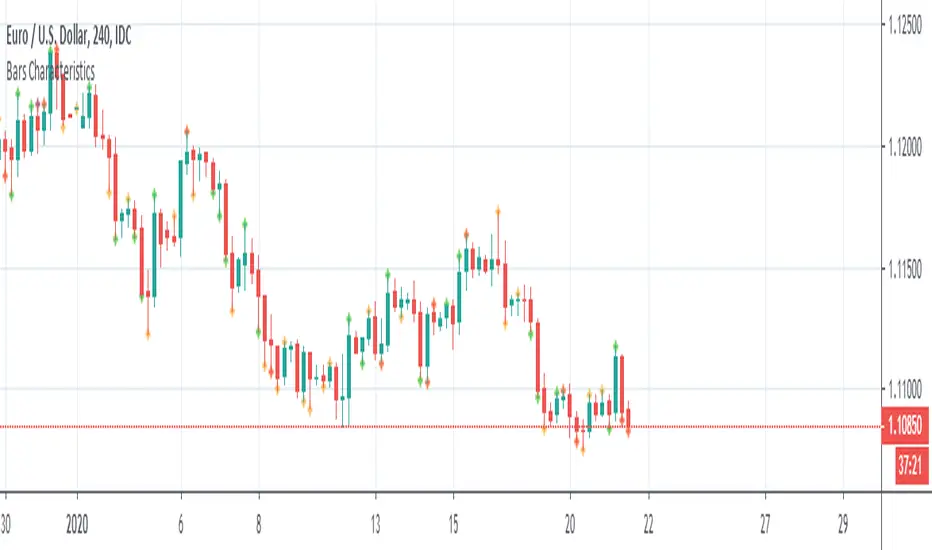
Price Action and 3 EMAs Momentum plus Sessions FilterThis indicator plots on the chart the parameters and signals of the Price Action and 3 EMAs Momentum plus Sessions Filter Algorithmic Strategy. The strategy trades based on time-series (absolute) and relative momentum of price close, highs, lows and 3 EMAs.
I am still learning PS and therefore I have only been able to write the indicator up to the Signal generation. I plan to expand the indicator to Entry Signals as well as the full Strategy.
The strategy works best on EURUSD in the 15 minutes TF during London and New York sessions with 1 to 1 TP and SL of 30 pips with lots resulting in 3% risk of the account per trade. I have already written the full strategy in another language and platform and back tested it for ten years and it was profitable for 7 of the 10 years with average profit of 15% p.a which can be easily increased by increasing risk per trade. I have been trading it live in that platform for over two years and it is profitable.
Contributions from experienced PS coders in completing the Indicator as well as writing the Strategy and back testing it on Trading View will be appreciated.
STRATEGY AND INDICATOR PARAMETERS
Three periods of 12, 48 and 96 in the 15 min TF which are equivalent to 3, 12 and 24 hours i.e (15 min * period / 60 min) are the foundational inputs for all the parameters of the PA & 3 EMAs Momentum + SF Algo Strategy and its Indicator.
3 EMAs momentum parameters and conditions
• FastEMA = ema of 12 periods
• MedEMA = ema of 48 periods
• SlowEMA = ema of 96 periods
• All the EMAs analyse price close for up to 96 (15 min periods) equivalent to 24 hours
• There’s Upward EMA momentum if price close > FastEMA and FastEMA > MedEMA and MedEMA > SlowEMA
• There’s Downward EMA momentum if price close < FastEMA and FastEMA < MedEMA and MedEMA < SlowEMA
PA momentum parameters and conditions
• HH = Highest High of 48 periods from 1st closed bar before current bar
• LL = Lowest Low of 48 periods from 1st closed bar from current bar
• Previous HH = Highest High of 84 periods from 12th closed bar before current bar
• Previous LL = Lowest Low of 84 periods from 12th closed bar before current bar
• All the HH & LL and prevHH & prevLL are within the 96 periods from the 1st closed bar before current bar and therefore indicative of momentum during the past 24 hours
• There’s Upward PA momentum if price close > HH and HH > prevHH and LL > prevLL
• There’s Downward PA momentum if price close < LL and LL < prevLL and HH < prevHH
Signal conditions and Status (BuySignal, SellSignal or Neutral)
• The strategy generates Buy or Sell Signals if both 3 EMAs and PA momentum conditions are met for each direction and these occur during the London and New York sessions
• BuySignal if price close > FastEMA and FastEMA > MedEMA and MedEMA > SlowEMA and price close > HH and HH > prevHH and LL > prevLL and timeinrange (LDN&NY) else Neutral
• SellSignal if price close < FastEMA and FastEMA < MedEMA and MedEMA < SlowEMA and price close < LL and LL < prevLL and HH < prevHH and timeinrange (LDN&NY) else Neutral
Entry conditions and Status (EnterBuy, EnterSell or Neutral)(NOT CODED YET)
• ENTRY IS NOT AT THE SIGNAL BAR but at the current bar tick price retracement to FastEMA after the signal
• EnterBuy if current bar tick price <= FastEMA and current bar tick price > prevHH at the time of the Buy Signal
• EnterSell if current bar tick price >= FastEMA and current bar tick price > prevLL at the time of the Sell Signal
在腳本中搜尋"bar"
Dskyz (DAFE) Aurora Divergence – Quant Master Dskyz (DAFE) Aurora Divergence – Quant Master
Introducing the Dskyz (DAFE) Aurora Divergence – Quant Master , a strategy that’s your secret weapon for mastering futures markets like MNQ, NQ, MES, and ES. Born from the legendary Aurora Divergence indicator, this fully automated system transforms raw divergence signals into a quant-grade trading machine, blending precision, risk management, and cyberpunk DAFE visuals that make your charts glow like a neon skyline. Crafted with care and driven by community passion, this strategy stands out in a sea of generic scripts, offering traders a unique edge to outsmart institutional traps and navigate volatile markets.
The Aurora Divergence indicator was a cult favorite for spotting price-OBV divergences with its aqua and fuchsia orbs, but traders craved a system to act on those signals with discipline and automation. This strategy delivers, layering advanced filters (z-score, ATR, multi-timeframe, session), dynamic risk controls (kill switches, adaptive stops/TPs), and a real-time dashboard to turn insights into profits. Whether you’re a newbie dipping into futures or a pro hunting reversals, this strat’s got your back with a beginner guide, alerts, and visuals that make trading feel like a sci-fi mission. Let’s dive into every detail and see why this original DAFE creation is a must-have.
Why Traders Need This Strategy
Futures markets are a battlefield—fast-paced, volatile, and riddled with institutional games that can wipe out undisciplined traders. From the April 28, 2025 NQ 1k-point drop to sneaky ES slippage, the stakes are high. Meanwhile, platforms are flooded with unoriginal, low-effort scripts that promise the moon but deliver noise. The Aurora Divergence – Quant Master rises above, offering:
Unmatched Originality: A bespoke system built from the ground up, with custom divergence logic, DAFE visuals, and quant filters that set it apart from copycat clutter.
Automation with Precision: Executes trades on divergence signals, eliminating emotional slip-ups and ensuring consistency, even in chaotic sessions.
Quant-Grade Filters: Z-score, ATR, multi-timeframe, and session checks filter out noise, targeting high-probability reversals.
Robust Risk Management: Daily loss and rolling drawdown kill switches, plus ATR-based stops/TPs, protect your capital like a fortress.
Stunning DAFE Visuals: Aqua/fuchsia orbs, aurora bands, and a glowing dashboard make signals intuitive and charts a work of art.
Community-Driven: Evolved from trader feedback, this strat’s a labor of love, not a recycled knockoff.
Traders need this because it’s a complete, original system that blends accessibility, sophistication, and style. It’s your edge to trade smarter, not harder, in a market full of traps and imitators.
1. Divergence Detection (Core Signal Logic)
The strategy’s core is its ability to detect bullish and bearish divergences between price and On-Balance Volume (OBV), pinpointing reversals with surgical accuracy.
How It Works:
Price Slope: Uses linear regression over a lookback (default: 9 bars) to measure price momentum (priceSlope).
OBV Slope: OBV tracks volume flow (+volume if price rises, -volume if falls), with its slope calculated similarly (obvSlope).
Bullish Divergence: Price slope negative (falling), OBV slope positive (rising), and price above 50-bar SMA (trend_ma).
Bearish Divergence: Price slope positive (rising), OBV slope negative (falling), and price below 50-bar SMA.
Smoothing: Requires two consecutive divergence bars (bullDiv2, bearDiv2) to confirm signals, reducing false positives.
Strength: Divergence intensity (divStrength = |priceSlope * obvSlope| * sensitivity) is normalized (0–1, divStrengthNorm) for visuals.
Why It’s Brilliant:
- Divergences catch hidden momentum shifts, often exploited by institutions, giving you an edge on reversals.
- The 50-bar SMA filter aligns signals with the broader trend, avoiding choppy markets.
- Adjustable lookback (min: 3) and sensitivity (default: 1.0) let you tune for different instruments or timeframes.
2. Filters for Precision
Four advanced filters ensure signals are high-probability and market-aligned, cutting through the noise of volatile futures.
Z-Score Filter:
Logic: Calculates z-score ((close - SMA) / stdev) over a lookback (default: 50 bars). Blocks entries if |z-score| > threshold (default: 1.5) unless disabled (useZFilter = false).
Impact: Avoids trades during extreme price moves (e.g., blow-off tops), keeping you in statistically safe zones.
ATR Percentile Volatility Filter:
Logic: Tracks 14-bar ATR in a 100-bar window (default). Requires current ATR > 80th percentile (percATR) to trade (tradeOk).
Impact: Ensures sufficient volatility for meaningful moves, filtering out low-volume chop.
Multi-Timeframe (HTF) Trend Filter:
Logic: Uses a 50-bar SMA on a higher timeframe (default: 60min). Longs require price > HTF MA (bullTrendOK), shorts < HTF MA (bearTrendOK).
Impact: Aligns trades with the bigger trend, reducing counter-trend losses.
US Session Filter:
Logic: Restricts trading to 9:30am–4:00pm ET (default: enabled, useSession = true) using America/New_York timezone.
Impact: Focuses on high-liquidity hours, avoiding overnight spreads and erratic moves.
Evolution:
- These filters create a robust signal pipeline, ensuring trades are timed for optimal conditions.
- Customizable inputs (e.g., zThreshold, atrPercentile) let traders adapt to their style without compromising quality.
3. Risk Management
The strategy’s risk controls are a masterclass in balancing aggression and safety, protecting capital in volatile markets.
Daily Loss Kill Switch:
Logic: Tracks daily loss (dayStartEquity - strategy.equity). Halts trading if loss ≥ $300 (default) and enabled (killSwitch = true, killSwitchActive).
Impact: Caps daily downside, crucial during events like April 27, 2025 ES slippage.
Rolling Drawdown Kill Switch:
Logic: Monitors drawdown (rollingPeak - strategy.equity) over 100 bars (default). Stops trading if > $1000 (rollingKill).
Impact: Prevents prolonged losing streaks, preserving capital for better setups.
Dynamic Stop-Loss and Take-Profit:
Logic: Stops = entry ± ATR * multiplier (default: 1.0x, stopDist). TPs = entry ± ATR * 1.5x (profitDist). Longs: stop below, TP above; shorts: vice versa.
Impact: Adapts to volatility, keeping stops tight but realistic, with TPs targeting 1.5:1 reward/risk.
Max Bars in Trade:
Logic: Closes trades after 8 bars (default) if not already exited.
Impact: Frees capital from stagnant trades, maintaining efficiency.
Kill Switch Buffer Dashboard:
Logic: Shows smallest buffer ($300 - daily loss or $1000 - rolling DD). Displays 0 (red) if kill switch active, else buffer (green).
Impact: Real-time risk visibility, letting traders adjust dynamically.
Why It’s Brilliant:
- Kill switches and ATR-based exits create a safety net, rare in generic scripts.
- Customizable risk inputs (maxDailyLoss, dynamicStopMult) suit different account sizes.
- Buffer metric empowers disciplined trading, a DAFE signature.
4. Trade Entry and Exit Logic
The entry/exit rules are precise, filtered, and adaptive, ensuring trades are deliberate and profitable.
Entry Conditions:
Long Entry: bullDiv2, cooldown passed (canSignal), ATR filter passed (tradeOk), in US session (inSession), no kill switches (not killSwitchActive, not rollingKill), z-score OK (zOk), HTF trend bullish (bullTrendOK), no existing long (lastDirection != 1, position_size <= 0). Closes shorts first.
Short Entry: Same, but for bearDiv2, bearTrendOK, no long (lastDirection != -1, position_size >= 0). Closes longs first.
Adaptive Cooldown: Default 2 bars (cooldownBars). Doubles (up to 10) after a losing trade, resets after wins (dynamicCooldown).
Exit Conditions:
Stop-Loss/Take-Profit: Set per trade (ATR-based). Exits on stop/TP hits.
Other Exits: Closes if maxBarsInTrade reached, ATR filter fails, or kill switch activates.
Position Management: Ensures no conflicting positions, closing opposites before new entries.
Built To Be Reliable and Consistent:
- Multi-filtered entries minimize false signals, a stark contrast to basic scripts.
- Adaptive cooldown prevents overtrading, especially after losses.
- Clean position handling ensures smooth execution, even in fast markets.
5. DAFE Visuals
The visuals are a DAFE hallmark, blending function with clean flair to make signals intuitive and charts stunning.
Aurora Bands:
Display: Bands around price during divergences (bullish: below low, bearish: above high), sized by ATR * bandwidth (default: 0.5).
Colors: Aqua (bullish), fuchsia (bearish), with transparency tied to divStrengthNorm.
Purpose: Highlights divergence zones with a glowing, futuristic vibe.
Divergence Orbs:
Display: Large/small circles (aqua below for bullish, fuchsia above for bearish) when bullDiv2/bearDiv2 and canSignal. Labels show strength (0–1).
Purpose: Pinpoints entries with eye-catching clarity.
Gradient Background:
Display: Green (bullish), red (bearish), or gray (neutral), 90–95% transparent.
Purpose: Sets the market mood without clutter.
Strategy Plots:
- Stop/TP Lines: Red (stops), green (TPs) for active trades.
- HTF MA: Yellow line for trend context.
- Z-Score: Blue step-line (if enabled).
- Kill Switch Warning: Red background flash when active.
What Makes This Next-Level?:
- Visuals make complex signals (divergences, filters) instantly clear, even for beginners.
- DAFE’s unique aesthetic (orbs, bands) sets it apart from generic scripts, reinforcing originality.
- Functional plots (stops, TPs) enhance trade management.
6. Metrics Dashboard
The top-right dashboard (2x8 table) is your command center, delivering real-time insights.
Metrics:
Daily Loss ($): Current loss vs. day’s start, red if > $300.
Rolling DD ($): Drawdown vs. 100-bar peak, red if > $1000.
ATR Threshold: Current percATR, green if ATR exceeds, red if not.
Z-Score: Current value, green if within threshold, red if not.
Signal: “Bullish Div” (aqua), “Bearish Div” (fuchsia), or “None” (gray).
Action: “Consider Buying”/“Consider Selling” (signal color) or “Wait” (gray).
Kill Switch Buffer ($): Smallest buffer to kill switch, green if > 0, red if 0.
Why This Is Important?:
- Consolidates critical data, making decisions effortless.
- Color-coded metrics guide beginners (e.g., green action = go).
- Buffer metric adds transparency, rare in off-the-shelf scripts.
7. Beginner Guide
Beginner Guide: Middle-right table (shown once on chart load), explains aqua orbs (bullish, buy) and fuchsia orbs (bearish, sell).
Key Features:
Futures-Optimized: Tailored for MNQ, NQ, MES, ES with point-value adjustments.
Highly Customizable: Inputs for lookback, sensitivity, filters, and risk settings.
Real-Time Insights: Dashboard and visuals update every bar.
Backtest-Ready: Fixed qty and tick calc for accurate historical testing.
User-Friendly: Guide, visuals, and dashboard make it accessible yet powerful.
Original Design: DAFE’s unique logic and visuals stand out from generic scripts.
How to Use
Add to Chart: Load on a 5min MNQ/ES chart in TradingView.
Configure Inputs: Adjust instrument, filters, or risk (defaults optimized for MNQ).
Monitor Dashboard: Watch signals, actions, and risk metrics (top-right).
Backtest: Run in strategy tester to evaluate performance.
Live Trade: Connect to a broker (e.g., Tradovate) for automation. Watch for slippage (e.g., April 27, 2025 ES issues).
Replay Test: Use bar replay (e.g., April 28, 2025 NQ drop) to test volatility handling.
Disclaimer
Trading futures involves significant risk of loss and is not suitable for all investors. Past performance is not indicative of future results. Backtest results may not reflect live trading due to slippage, fees, or market conditions. Use this strategy at your own risk, and consult a financial advisor before trading. Dskyz (DAFE) Trading Systems is not responsible for any losses incurred.
Backtesting:
Frame: 2023-09-20 - 2025-04-29
Fee Typical Range (per side, per contract)
CME Exchange $1.14 – $1.20
Clearing $0.10 – $0.30
NFA Regulatory $0.02
Firm/Broker Commis. $0.25 – $0.80 (retail prop)
TOTAL $1.60 – $2.30 per side
Round Turn: (enter+exit) = $3.20 – $4.60 per contract
Final Notes
The Dskyz (DAFE) Aurora Divergence – Quant Master isn’t just a strategy—it’s a movement. Crafted with originality and driven by community passion, it rises above the flood of generic scripts to deliver a system that’s as powerful as it is beautiful. With its quant-grade logic, DAFE visuals, and robust risk controls, it empowers traders to tackle futures with confidence and style. Join the DAFE crew, light up your charts, and let’s outsmart the markets together!
(This publishing will most likely be taken down do to some miscellaneous rule about properly displaying charting symbols, or whatever. Once I've identified what part of the publishing they want to pick on, I'll adjust and repost.)
Use it with discipline. Use it with clarity. Trade smarter.
**I will continue to release incredible strategies and indicators until I turn this into a brand or until someone offers me a contract.
Created by Dskyz, powered by DAFE Trading Systems. Trade fast, trade bold.
NYCSessionLibrary "NYCSession"
Library for New York trading session time functions
@author abneralvarado
@version 1.0
isInNYSession(sessionStart, sessionEnd)
Determines if the current bar is within New York trading session
Parameters:
sessionStart (simple int) : Starting time of NY session in 24hr format (HHMM) like 0930 for 9:30 AM ET
sessionEnd (simple int) : Ending time of NY session in 24hr format (HHMM) like 1600 for 4:00 PM ET
Returns: True if current bar is within the NY session time, false otherwise
getNYSessionStartTime(lookback, sessionStart)
Gets the start time of NY session for a given bar
Parameters:
lookback (simple int) : Bar index to check (0 is current bar)
sessionStart (simple int) : Starting time of NY session in 24hr format (HHMM)
Returns: Unix timestamp for the start of NY session on the given bar's date
getNYSessionEndTime(lookback, sessionEnd)
Gets the end time of NY session for a given bar
Parameters:
lookback (simple int) : Bar index to check (0 is current bar)
sessionEnd (simple int) : Ending time of NY session in 24hr format (HHMM)
Returns: Unix timestamp for the end of NY session on the given bar's date
isNYSessionOpen(sessionStart)
Checks if current bar opens the NY session
Parameters:
sessionStart (simple int) : Starting time of NY session in 24hr format (HHMM)
Returns: True if current bar marks the session opening, false otherwise
isNYSessionClose(sessionEnd)
Checks if current bar closes the NY session
Parameters:
sessionEnd (simple int) : Ending time of NY session in 24hr format (HHMM)
Returns: True if current bar marks the session closing, false otherwise
isWeekday()
Determines if the current day is a weekday (Mon-Fri)
Returns: True if current bar is on a weekday, false otherwise
getSessionBackgroundColor(sessionStart, sessionEnd, bgColor)
Gets session background color with transparency
Parameters:
sessionStart (simple int) : Starting time of NY session in 24hr format (HHMM)
sessionEnd (simple int) : Ending time of NY session in 24hr format (HHMM)
bgColor (color) : Background color for session highlighting
Returns: Color value for background or na if not in session
Multi-Anchored Linear Regression Channels [TANHEF]█ Overview:
The 'Multi-Anchored Linear Regression Channels ' plots multiple dynamic regression channels (or bands) with unique selectable calculation types for both regression and deviation. It leverages a variety of techniques, customizable anchor sources to determine regression lengths, and user-defined criteria to highlight potential opportunities.
Before getting started, it's worth exploring all sections, but make sure to review the Setup & Configuration section in particular. It covers key parameters like anchor type, regression length, bias, and signal criteria—essential for aligning the tool with your trading strategy.
█ Key Features:
⯁ Multi-Regression Capability:
Plot up to three distinct regression channels and/or bands simultaneously, each with customizable anchor types to define their length.
⯁ Regression & Deviation Methods:
Regressions Types:
Standard: Uses ordinary least squares to compute a simple linear trend by averaging the data and deriving a slope and endpoints over the lookback period.
Ridge: Introduces L2 regularization to stabilize the slope by penalizing large coefficients, which helps mitigate multicollinearity in the data.
Lasso: Uses L1 regularization through soft-thresholding to shrink less important coefficients, yielding a simpler model that highlights key trends.
Elastic Net: Combines L1 and L2 penalties to balance coefficient shrinkage and selection, producing a robust weighted slope that handles redundant predictors.
Huber: Implements the Huber loss with iteratively reweighted least squares (IRLS) and EMA-style weights to reduce the impact of outliers while estimating the slope.
Least Absolute Deviations (LAD): Reduces absolute errors using iteratively reweighted least squares (IRLS), yielding a slope less sensitive to outliers than squared-error methods.
Bayesian Linear: Merges prior beliefs with weighted data through Bayesian updating, balancing the prior slope with data evidence to derive a probabilistic trend.
Deviation Types:
Regressive Linear (Reverse): In reverse order (recent to oldest), compute weighted squared differences between the data and a line defined by a starting value and slope.
Progressive Linear (Forward): In forward order (oldest to recent), compute weighted squared differences between the data and a line defined by a starting value and slope.
Balanced Linear: In forward order (oldest to newest), compute regression, then pair to source data in reverse order (newest to oldest) to compute weighted squared differences.
Mean Absolute: Compute weighted absolute differences between each data point and its regression line value, then aggregate them to yield an average deviation.
Median Absolute: Determine the weighted median of the absolute differences between each data point and its regression line value to capture the central tendency of deviations.
Percent: Compute deviation as a percentage of a base value by multiplying that base by the specified percentage, yielding symmetric positive and negative deviations.
Fitted: Compare a regression line with high and low series values by computing weighted differences to determine the maximum upward and downward deviations.
Average True Range: Iteratively compute the weighted average of absolute differences between the data and its regression line to yield an ATR-style deviation measure.
Bias:
Bias: Applies EMA or inverse-EMA style weighting to both Regression and/or Deviation, emphasizing either recent or older data.
⯁ Customizable Regression Length via Anchors:
Anchor Types:
Fixed: Length.
Bar-Based: Bar Highest/Lowest, Volume Highest/Lowest, Spread Highest/Lowest.
Correlation: R Zero, R Highest, R Lowest, R Absolute.
Slope: Slope Zero, Slope Highest, Slope Lowest, Slope Absolute.
Indicator-Based: Indicators Highest/Lowest (ADX, ATR, BBW, CCI, MACD, RSI, Stoch).
Time-Based: Time (Day, Week, Month, Quarter, Year, Decade, Custom).
Session-Based: Session (Tokyo, London, New York, Sydney, Custom).
Event-Based: Earnings, Dividends, Splits.
External: Input Source Highest/Lowest.
Length Selection:
Maximum: The highest allowed regression length (also fixed value of “Length” anchor).
Minimum: The shortest allowed length, ensuring enough bars for a valid regression.
Step: The sampling interval (e.g., 1 checks every bar, 2 checks every other bar, etc.). Increasing the step reduces the loading time, most applicable to “Slope” and “R” anchors.
Adaptive lookback:
Adaptive Lookback: Enable to display regression regardless of too few historical bars.
⯁ Selecting Bias:
Bias applies separately to regression and deviation.
Positive values emphasize recent data (EMA-style), negative invert, and near-zero maintains balance. (e.g., a length 100, bias +1 gives the newest price ~7× more weight than the oldest).
It's best to apply bias to both (regression and deviation) or just the deviation. Biasing only regression may distort deviation visually, while biasing both keeps their relationship intuitive. Using bias only for deviation scales it without altering regression, offering unique analysis.
⯁ Scale Awareness:
Supports linear and logarithmic price scaling, the regression and deviations adjust accordingly.
⯁ Signal Generation & Alerts:
Customizable entry/exit signals and alerts, detailed in the dedicated section below.
⯁ Visual Enhancements & Real-World Examples:
Optional on-chart table display summarizing regression input criteria (display type, anchor type, source, regression type, regression bias, deviation type, deviation bias, deviation multiplier) and key calculated metrics (regression length, slope, Pearson’s R, percentage position within deviations, etc.) for quick reference.
█ Understanding R (Pearson Correlation Coefficient):
Pearson’s R gauges data alignment to a straight-line trend within the regression length:
Range: R varies between –1 and +1.
R = +1 → Perfect positive correlation (strong uptrend).
R = 0 → No linear relationship detected.
R = –1 → Perfect negative correlation (strong downtrend).
This script uses Pearson’s R as an anchor, adjusting regression length to target specific R traits. Strong R (±1) follows the regression channel, while weak R (0) shows inconsistency.
█ Understanding the Slope:
The slope is the direction and rate at which the regression line rises or falls per bar:
Positive Slope (>0): Uptrend – Steeper means faster increase.
Negative Slope (<0): Downtrend – Steeper means sharper drop.
Zero or Near-Zero Slope: Sideways – Indicating range-bound conditions.
This script uses highest and lowest slope as an anchor, where extremes highlight strong moves and trend lines, while values near zero indicate sideways action and possible support/resistance.
█ Setup & Configuration:
Whether you’re new to this script or want to quickly adjust all critical parameters, the panel below shows the main settings available. You can customize everything from the anchor type and maximum length to the bias, signal conditions, and more.
Scale (select Log Scale for logarithmic, otherwise linear scale).
Display (regression channel and/or bands).
Anchor (how regression length is determined).
Length (control bars analyzed):
• Max – Upper limit.
• Min – Prevents regression from becoming too short.
• Step – Controls scanning precision; increasing Step reduces load time.
Regression:
• Type – Calculation method.
• Bias – EMA-style emphasis (>0=new bars weighted more; <0=old bars weighted more).
Deviation:
• Type – Calculation method.
• Bias – EMA-style emphasis (>0=new bars weighted more; <0=old bars weighted more).
• Multiplier - Adjusts Upper and Lower Deviation.
Signal Criteria:
• % (Price vs Deviation) – (0% = lower deviation, 50% = regression, 100% = upper deviation).
• R – (0 = no correlation, ±1 = perfect correlation; >0 = +slope, <0 = -slope).
Table (analyze table of input settings, calculated results, and signal criteria).
Adaptive Lookback (display regression while too few historical bars).
Multiple Regressions (steps 2 to 7 apply to #1, #2, and #3 regressions).
█ Signal Generation & Alerts:
The script offers customizable entry and exit signals with flexible criteria and visual cues (background color, dots, or triangles). Alerts can also be triggered for these opportunities.
Percent Direction Criteria:
(0% = lower deviation, 50% = regression line, 100% = upper deviation)
Above %: Triggers if price is above a specified percent of the deviation channel.
Below %: Triggers if price is below a specified percent of the deviation channel.
(Blank): Ignores the percent‐based condition.
Pearson's R (Correlation) Direction Criteria:
(0 = no correlation, ±1 = perfect correlation; >0 = positive slope, <0 = negative slope)
Above R / Below R: Compares the correlation to a threshold.
Above│R│ / Below│R│: Uses absolute correlation to focus on strength, ignoring direction.
Zero to R: Checks if R is in the 0-to-threshold range.
(Blank): Ignores correlation-based conditions.
█ User Tips & Best Practices:
Choose an anchor type that suits your strategy, “Bar Highest/Lowest” automatically spots commonly used regression zones, while “│R│ Highest” targets strong linear trends.
Consider enabling or disabling the Adaptive Lookback feature to ensure you always have a plotted regression if your chart doesn’t meet the maximum-length requirement.
Use a small Step size (1) unless relying on R-correlation or slope-based anchors as the are time-consuming to calculate. Larger steps speed up calculations but reduce precision.
Fine-tune settings such as lookback periods, regression bias, and deviation multipliers, or trend strength. Small adjustments can significantly affect how channels and signals behave.
To reduce loading time , show only channels (not bands) and disable signals, this limits calculations to the last bar and supports more extreme criteria.
Use the table display to monitor anchor type, calculated length, slope, R value, and percent location at a glance—especially if you have multiple regressions visible simultaneously.
█ Conclusion:
With its blend of advanced regression techniques, flexible deviation options, and a wide range of anchor types, this indicator offers a highly adaptable linear regression channeling system. Whether you're anchoring to time, price extremes, correlation, slope, or external events, the tool can be shaped to fit a variety of strategies. Combined with customizable signals and alerts, it may help highlight areas of confluence and support a more structured approach to identifying potential opportunities.
Nef33-Volume Footprint ApproximationDescription of the "Volume Footprint Approximation" Indicator
Purpose
The "Volume Footprint Approximation" indicator is a tool designed to assist traders in analyzing market volume dynamics and anticipating potential trend changes in price. It is inspired by the concept of a volume footprint chart, which visualizes the distribution of trading volume across different price levels. However, since TradingView does not provide detailed intrabar data for all users, this indicator approximates the behavior of a footprint chart by using available volume and price data (open, close, volume) to classify volume as buy or sell, calculate volume delta, detect imbalances, and generate trend change signals.
The indicator is particularly useful for identifying areas of high buying or selling activity, imbalances between supply and demand, delta divergences, and potential reversal points in the market. It provides specific signals for bullish and bearish trend changes, making it suitable for traders looking to trade reversals or confirm trends.
How It Works
The indicator uses volume and price data from each candlestick to perform the following calculations:
Volume Classification:
Classifies the volume of each candlestick as "buy" or "sell" based on price movement:
If the closing price is higher than the opening price (close > open), the volume is classified as "buy."
If the closing price is lower than the opening price (close < open), the volume is classified as "sell."
If the closing price equals the opening price (close == open), it compares with the previous close to determine the direction:
If the current close is higher than the previous close, it is classified as "buy."
If the current close is lower than the previous close, it is classified as "sell."
If the current close equals the previous close, the classification from the previous bar is used.
Delta Calculation:
Calculates the volume delta as the difference between buy volume and sell volume (buyVolume - sellVolume).
A positive delta indicates more buy volume; a negative delta indicates more sell volume.
Imbalance Detection:
Identifies imbalances between buy and sell volume:
A buy imbalance occurs when buy volume exceeds sell volume by a defined percentage (default is 300%).
A sell imbalance occurs when sell volume exceeds buy volume by the same percentage.
Delta Divergence Detection:
Positive Delta Divergence: Occurs when the price is falling (for at least 2 bars) but the delta is increasing or becomes positive, indicating that buyers are entering despite the price decline.
Negative Delta Divergence: Occurs when the price is rising (for at least 2 bars) but the delta is decreasing or becomes negative, indicating that sellers are entering despite the price increase.
Trend Change Signals:
Bullish Signal (trendChangeBullish): Generated when the following conditions are met:
There is a positive delta divergence.
The delta has moved from a negative value (e.g., -500) to a positive value (e.g., +200) over the last 3 bars.
There is a buy imbalance.
The price is near a historical support level (approximated as the lowest low of the last 50 bars).
Bearish Signal (trendChangeBearish): Generated when the following conditions are met:
There is a negative delta divergence.
The delta has moved from a positive value (e.g., +500) to a negative value (e.g., -200) over the last 3 bars.
There is a sell imbalance.
The price is near a historical resistance level (approximated as the highest high of the last 50 bars).
Visual Elements
The indicator is displayed in a separate panel below the price chart (overlay=false) and includes the following elements:
Volume Histograms:
Buy Volume: Represented by a green histogram. Shows the volume classified as "buy."
Sell Volume: Represented by a red histogram. Shows the volume classified as "sell."
Note: The histograms overlap, and the last plotted histogram (red) takes visual precedence, meaning the sell volume may cover the buy volume if it is larger.
Delta Line:
Delta Volume: Represented by a blue line. Shows the difference between buy and sell volume.
A line above zero indicates more buy volume; a line below zero indicates more sell volume.
A dashed gray horizontal line marks the zero level for easier interpretation.
Imbalance Backgrounds:
Buy Imbalance: Light green background when buy volume exceeds sell volume by the defined percentage.
Sell Imbalance: Light red background when sell volume exceeds buy volume by the defined percentage.
Divergence Backgrounds:
Positive Delta Divergence: Lime green background when a positive delta divergence is detected.
Negative Delta Divergence: Fuchsia background when a negative delta divergence is detected.
Trend Change Signals:
Bullish Signal: Green label with the text "Bullish Trend Change" when the conditions for a bullish trend change are met.
Bearish Signal: Red label with the text "Bearish Trend Change" when the conditions for a bearish trend change are met.
Information Labels:
Below each bar, a label displays:
Total Vol: The total volume of the bar.
Delta: The delta volume value.
Alerts
The indicator generates the following alerts:
Positive Delta Divergence: "Positive Delta Divergence Detected! Price is falling, but delta is increasing."
Negative Delta Divergence: "Negative Delta Divergence Detected! Price is rising, but delta is decreasing."
Bullish Trend Change Signal: "Bullish Trend Change Signal! Positive Delta Divergence, Delta Rise, Buy Imbalance, and Near Support."
Bearish Trend Change Signal: "Bearish Trend Change Signal! Negative Delta Divergence, Delta Drop, Sell Imbalance, and Near Resistance."
These alerts can be configured in TradingView to receive real-time notifications.
Adjustable Parameters
The indicator allows customization of the following parameters:
Imbalance Threshold (%): The percentage required to detect an imbalance between buy and sell volume (default is 300%).
Lookback Period for Divergence: Number of bars to look back for detecting price and delta trends (default is 2 bars).
Support/Resistance Lookback Period: Number of bars to look back for identifying historical support and resistance levels (default is 50 bars).
Delta High Threshold (Bearish): Minimum delta value 2 bars ago for the bearish signal (default is +500).
Delta Low Threshold (Bearish): Maximum delta value in the current bar for the bearish signal (default is -200).
Delta Low Threshold (Bullish): Maximum delta value 2 bars ago for the bullish signal (default is -500).
Delta High Threshold (Bullish): Minimum delta value in the current bar for the bullish signal (default is +200).
Practical Use
The indicator is useful for the following purposes:
Identifying Trend Changes:
The trend change signals (trendChangeBullish and trendChangeBearish) indicate potential price reversals. For example, a bullish signal near a support level may be an opportunity to enter a long position.
Detecting Divergences:
Delta divergences (positive and negative) can anticipate trend changes by showing a disagreement between price movement and underlying buying/selling pressure.
Finding Key Levels:
Imbalances (green and red backgrounds) often coincide with support and resistance levels, helping to identify areas where the market might react.
Confirming Trends:
A consistently positive delta in an uptrend or a negative delta in a downtrend can confirm the strength of the trend.
Identifying Failed Auctions:
Although not detected automatically, you can manually identify failed auctions by observing a price move to new highs/lows with decreasing volume in the direction of the move.
Limitations
Intrabar Data: It does not use detailed intrabar data, making it less precise than a native footprint chart.
Approximations: Volume classification and support/resistance detection are approximations, which may lead to false signals.
Volume Dependency: It requires reliable volume data, so it may be less effective on assets with inaccurate volume data (e.g., some forex pairs).
False Signals: Divergences and imbalances do not always indicate a trend change, especially in strongly trending markets.
Recommendations
Combine with Other Indicators: Use tools like RSI, MACD, support/resistance levels, or candlestick patterns to confirm signals.
Trade on Higher Timeframes: Signals are more reliable on higher timeframes like 1-hour or 4-hour charts.
Perform Backtesting: Evaluate the indicator's accuracy on historical data to adjust parameters and improve effectiveness.
Adjust Parameters: Modify thresholds (e.g., imbalanceThreshold or supportResistanceLookback) based on the asset and timeframe you are trading.
Conclusion
The "Volume Footprint Approximation" indicator is a powerful tool for analyzing volume dynamics and anticipating price trend changes. By classifying volume, calculating delta, detecting imbalances and divergences, and generating trend change signals, it provides traders with valuable insights into market buying and selling pressure. While it has limitations due to the lack of intrabar data, it can be highly effective when used in combination with other technical analysis tools and on assets with reliable volume data.
BCVC - Volume & Big Candle ColorThe BCVC (Volume & Big Candle Color) indicator helps traders identify significant price movements accompanied by unusual volume activity. By dynamically coloring bars based on volume spikes and candle size, it highlights potential momentum shifts, breakouts, or reversals. This tool is ideal for traders who want to:
Spot institutional buying/selling activity.
Confirm trend strength using volume and price volatility.
Filter noise by focusing on high-impact bars.
Key Features
Volume Spike Detection:
Compares current volume to a moving average (EMA) of volume.
Highlights bars where volume exceeds the average by a user-defined multiplier.
Big Candle Detection:
Identifies bars with a range (high-low) larger than the historical average range (EMA of candle ranges).
Thresholds for "big candles" are customizable.
Color-Coded Logic:
White Bars: High volume + Big candle + Bullish (close > open).
Orange Bars: High volume + Big candle + Bearish (close < open).
Blue Bars: High volume + Regular candle + Bullish.
Maroon Bars: High volume + Regular candle + Bearish.
Input Parameters
Volume Settings:
Volume Period: EMA length for average volume calculation (default: 20).
Volume Multiplier: Threshold multiplier for volume spikes (e.g., 1.25 = 25% above average).
Candle Size Settings:
Lookback Period: EMA length for average candle range (default: 7).
Big Candle Multiplier: Threshold multiplier for large candles (e.g., 1.3 = 30% above average range).
How It Works
Volume Analysis:
The indicator calculates an EMA of volume over the specified period.
If the current bar’s volume exceeds Average Volume × Volume Multiplier, it’s flagged as a high-volume bar.
Candle Range Analysis:
The average candle range (high-low) is calculated using an EMA over the lookback period.
A "big candle" is identified when the current bar’s range exceeds Average Range × Big Candle Multiplier.
Combined Signals:
High-volume bars are colored based on whether they are bullish/bearish and whether their range exceeds the big-candle threshold.
Example: A white bar (high volume + big candle + bullish) suggests strong buying pressure with institutional participation.
Usage Scenarios
Breakout Confirmation: A white/orange bar at a support/resistance level may validate a breakout.
Reversal Signals: A maroon/orange bar after a long trend could indicate exhaustion and potential reversal.
Trend Strength: Clusters of blue/white bars during uptrends (or maroon/orange in downtrends) confirm momentum.
Benefits
Visual Clarity: Instantly spot high-impact bars without manually scanning volume or candle size.
Customizable Sensitivity: Adjust multipliers to filter noise (e.g., increase for fewer signals).
Universal Application: Works on all timeframes and instruments (stocks, forex, crypto).
Notes
Best Paired With: Trendlines, support/resistance levels, or momentum oscillators (e.g., RSI).
Avoid False Signals: Use higher multipliers (e.g., 1.5) on lower timeframes to reduce noise.
Volume Width Based Candles
Overview
This indicator reimagines traditional candlestick charts by adjusting the horizontal width of each candle based on the bar’s trading volume. In other words, candles with higher volume appear wider, while those with lower volume are drawn narrower. This extra visual dimension can help traders quickly identify bars with significant volume relative to a defined lookback period.
Key Components
Volume Normalization:
The script calculates the highest volume over a user-defined lookback period (default is 100 bars).
Each bar’s volume is then normalized by dividing it by this maximum value. The result is a value between 0 and 1 that represents how the current volume compares to the maximum over the lookback.
Variable Candle Width Calculation:
A base multiplier (default set to 0.4) is used to control how much the volume influences the candle width.
The normalized volume is multiplied by this multiplier to compute an offset value.
Instead of using timestamps (which could lead to drawing objects too far into the future), the script uses the bar_index (the sequential index of bars) to determine the left and right positions of each candle.
The left and right x–positions are calculated by subtracting and adding the offset from the current bar index, respectively.
Candle Body & Wick Drawing:
Candle Body:
The body is drawn using box.new as a rectangle.
The top and bottom of the box are determined by the higher and lower values of the open and close prices.
The color of the candle is set based on whether the bar is bullish (green) or bearish (red).
Wicks:
The upper wick is drawn from the high of the bar down to the top of the body.
The lower wick is drawn from the low up to the bottom of the body.
These are created using line.new at the current bar index.
Handling Edge Cases:
The indicator includes conditions to avoid drawing errors on the very first bar (or any bar where prior data is unavailable).
It also converts the calculated x–coordinates (which are derived from the bar index plus a floating point offset) to integers since box.new requires integer values for positioning.
What It Tells the Trader
Volume Visualization:
Wider candles indicate bars where trading volume is high relative to recent history, potentially highlighting periods of increased market activity.
Narrower candles suggest lower volume, which can signal less interest or participation during that bar.
Contextual Price Action:
By integrating volume into the visual representation of each candle, traders get an immediate sense of the strength behind price movements.
This can be particularly useful for spotting potential breakouts, reversals, or confirming trends when analyzed alongside traditional price-based indicators.
Customization Options
Volume Lookback Period:
You can adjust the number of bars considered when determining the maximum volume. A shorter period may be more responsive to recent changes, while a longer period provides a broader context.
Base Width Multiplier:
Adjusting this multiplier changes how pronounced the effect of volume is on the candle’s width. Increasing it will make high-volume candles even wider, and decreasing it will reduce the difference between high and low volume candles.
Final Thoughts
This indicator is a creative way to overlay volume information directly onto the price chart without the need for separate volume bars. It provides an at-a-glance understanding of market activity and can be a valuable addition to a trader’s toolkit, especially for those who prefer visual cues integrated with price action. However, due to limitations (like the maximum number of drawn boxes), it’s best used on charts with a moderate amount of historical data or with appropriate adjustments to manage performance.
beanBean's Multi-Instrument Pattern Scanner.
This indicator scans H1 timeframe for specific technical patterns. Here's how each pattern is detected:
PATTERN DETECTION CRITERIA:
1. Hammer
- Body Size: ≤ 30% of total candle length
- Lower Wick: > 50% of total candle length
- Upper Wick: < 20% of total candle length
- Formula:
* bodySize = |close - open|
* upperWick = high - max(open, close)
* lowerWick = min(open, close) - low
* totalLength = high - low
2. Shooting Star
- Body Size: ≤ 30% of total candle length
- Upper Wick: > 50% of total candle length
- Lower Wick: < 20% of total candle length
- Uses same measurements as Hammer but inverted
3. Outside/Inside (OI)
Checks three consecutive bars:
- Outside Bar: Bar2 high ≥ Bar3 high AND Bar2 low ≤ Bar3 low
- Inside Bar: Bar1 high ≤ Bar2 high AND Bar1 low ≥ Bar2 low
Pattern confirms when both conditions are met
4. Bullish/Bearish Umbrella
Checks two consecutive bars:
Bullish:
- Current bar's high ≤ previous bar's high
- Current body high ≤ previous bar's high
- Current body low ≥ previous body high
Bearish:
- Current bar's low ≥ previous bar's low
- Current body low ≥ previous bar's low
- Current body high ≤ previous body low
5. Three Bar Triangle (3BT)
Checks three consecutive bars:
- Current bar's high ≤ max(previous two highs)
- Current bar's low ≥ min(previous two lows)
- Indicates price compression
DISPLAY AND ALERTS:
- Patterns are displayed in real-time in the table
- Multiple patterns can be detected simultaneously
- Pattern detection resets each new H1 candle
CONFIGURATION:
- Each row can be independently configured
- Patterns are checked on H1 timeframe close
- Alert frequency: Once per H1 bar close
Note: All measurements use standard OHLC values from only completed H1 candles.
IB & Hammer at SMA(20,50|200)IB & Hammer at SMA (20, 50, 200) Breakout/Breakdown Indicator
Overview:
The IB (Inside Bar) & Hammer at SMA Breakout/Breakdown Indicator is designed to identify breakout and breakdown opportunities using Inside Bars (IB) in combination with Simple Moving Averages (SMA 20, 50, 200) as key trend filters. This indicator is useful for traders looking to catch momentum moves after consolidation phases, confirming the trend direction with moving averages.
Indicator Logic:
Inside Bar (IB) Detection:
An Inside Bar is a candlestick that is completely within the range of the previous candle (i.e., lower high and higher low).
Inside Bars indicate consolidation, suggesting a potential breakout.
SMA Trend Confirmation:
The script uses three moving averages (SMA 20, 50, 200) to determine the trend direction.
Bullish trend: Price is above the 50 & 200 SMAs.
Bearish trend: Price is below the 50 & 200 SMAs.
The 20 SMA is used as a dynamic short-term momentum filter.
Breakout & Breakdown Conditions:
Breakout: When price breaks above the Inside Bar’s high, and the trend is bullish (above key SMAs).
Breakdown: When price breaks below the Inside Bar’s low, and the trend is bearish (below key SMAs).
Alerts can be set to notify traders of potential trade opportunities.
Features:
✅ Identifies Inside Bars (consolidation zones).
✅ Uses SMA (20, 50, 200) for trend confirmation.
✅ Breakout/Breakdown signals based on Inside Bar structure.
✅ Customizable Moving Averages & Alerts.
✅ Visual markers for easy trade identification.
How to Use:
Confirm Trend Direction:
If the price is above SMA 50 & 200, look for breakout trades.
If the price is below SMA 50 & 200, look for breakdown trades.
Watch for Inside Bars:
The script highlights Inside Bars with a specific color (configurable).
These bars indicate a low-volatility phase, preparing for a breakout.
Trade on Breakout/Breakdown:
Breakout: Enter long when the price breaks above the Inside Bar’s high (bullish trend).
Breakdown: Enter short when the price breaks below the Inside Bar’s low (bearish trend).
Uptrick: FRAMA Matrix RSIUptrick: FRAMA Matrix RSI
Introduction
The Uptrick: FRAMA Matrix RSI is a momentum-based indicator that integrates the Relative Strength Index (RSI) with the Fractal Adaptive Moving Average (FRAMA). By applying FRAMA's adaptive smoothing to RSI—and further refining it with a Zero-Lag Moving Average (ZLMA)—this script creates a refined and reliable momentum oscillator. The indicator now includes enhanced divergence detection, potential reversal signals, customizable buy/sell signal options, an internal stats table, and a fully customizable bar coloring system for an enhanced visual trading experience.
Why Combine RSI with FRAMA
Traditional RSI is a well-known momentum indicator but has several limitations. It is highly sensitive to price fluctuations, often generating false signals in choppy or volatile markets. FRAMA, in contrast, adapts dynamically to price changes by adjusting its smoothing factor based on market conditions.
By integrating FRAMA into RSI calculations, this indicator reduces noise while preserving RSI's ability to track momentum, adapts to volatility by reducing lag in trending markets and smoothing out choppiness in ranging conditions, enhances trend-following capability for more reliable momentum shifts, and refines overbought and oversold signals by adjusting to the current market structure.
With the new enhancements, such as a manual alpha input, noise filtering, divergence detection, and multiple buy/sell signal options, the indicator offers even greater flexibility and precision for traders. This combination improves the standard RSI by making it more adaptive and responsive to market changes.
Originality
This indicator is unique because it applies FRAMA's adaptive smoothing technique to RSI, creating a dynamic momentum oscillator that adjusts to different market conditions. Many traditional RSI-based indicators either use fixed smoothing methods like exponential moving averages or employ basic RSI calculations without adjusting for volatility.
This script stands out by integrating several elements, including the fractal dimension-based smoothing of FRAMA to reduce noise while retaining responsiveness, the use of Zero-Lag Moving Average smoothing to enhance trend sensitivity and reduce lag, divergence detection to highlight mismatches between price action and RSI momentum, a noise filter and manual alpha option to prevent minor fluctuations from generating false signals, customizable buy/sell signal options that let traders choose between ZLMA-based or FRAMA RSI-based signals, an internal stats table displaying real-time FRAMA calculations such as fractal dimension and the adaptive alpha factor, and a fully customizable bar coloring system to visually distinguish bullish, bearish, and neutral conditions.
Features
Adaptive FRAMA RSI
The indicator applies FRAMA to RSI values, making the momentum oscillator adaptive to volatility while filtering out noise. Unlike a traditional RSI that reacts equally to all price movements, FRAMA RSI adjusts its smoothing factor based on market structure, making it more effective for identifying true momentum shifts.
Zero-Lag Moving Average (ZLMA)
A smoothing technique that minimizes lag while preserving the responsiveness of price movements. It is applied to the FRAMA RSI to further refine signals and ensure smoother trend detection.
Bullish and Bearish Threshold Crossovers
This system compares FRAMA RSI to a user-defined threshold (default is 50). When FRAMA RSI moves above the threshold, it indicates bullish momentum, while movement below signals bearish conditions. The enhanced noise filter ensures that only significant moves trigger signals.
Noise Filter and Manual Alpha
A new noise filter input prevents tiny fluctuations from triggering false signals. In addition, a manual alpha option allows traders to override the automatically computed smoothing factor with a custom value, providing extra control over the indicator’s sensitivity.
Divergence Detection
The indicator identifies divergence patterns by comparing FRAMA RSI pivots to price action. Bullish divergence occurs when price makes a lower low while FRAMA RSI makes a higher low, and bearish divergence occurs when price makes a higher high while FRAMA RSI makes a lower high. These signals can help traders anticipate potential reversals.
Reversal Signals
Labels appear on the chart when FRAMA RSI confirms classic RSI overbought (70) or oversold (30) conditions, providing visual cues for potential trend reversals.
Buy and Sell Signal Options
Traders can now choose between two signal-generation methods. ZLMA-based signals trigger when the ZLMA of FRAMA RSI crosses key overbought (70) or oversold (30) levels, while FRAMA RSI-based signals trigger when FRAMA RSI itself crosses these levels. This added flexibility allows users to tailor the indicator to their preferred trading style.
ZLMA:
FRAMA:
Customizable Alerts
Alerts notify traders when FRAMA RSI crosses key levels, divergence signals occur, reversal conditions are met, or buy/sell signals trigger. This ensures that important trading events are not missed.
Fully Customizable Bar Coloring System
Users can color bars based on different conditions, enhancing visual clarity. Bar coloring modes include: FRAMA RSI threshold (bars change color based on whether FRAMA RSI is above or below the threshold), ZLMA crossover (bars change when ZLMA crosses overbought or oversold levels), buy/sell signals (bars change when official signals trigger), divergence (bars highlight when bullish or bearish divergence is detected), and reversals (bars indicate when RSI reaches overbought or oversold conditions confirmed by FRAMA RSI). The system also remembers the last applied bar color, ensuring a smooth visual transition.
Input Parameters and Features
Core Inputs
RSI Length (default: 14) defines the period for RSI calculations.
FRAMA Lookback (default: 16) determines the length for the FRAMA smoothing function.
RSI Bull Threshold (default: 50) sets the level above which the market is considered bullish and below which it is bearish.
Noise Filter (default: 1.0) ensures that small fluctuations do not trigger false bullish or bearish signals.
Additional Features
Show Bull and Bear Alerts (default: true) enables notifications when FRAMA RSI crosses the threshold.
Enable Divergence Detection (default: false) highlights bullish and bearish divergences based on price and FRAMA RSI pivots.
Show Potential Reversal Signals (default: false) identifies overbought (70) and oversold (30) levels as possible trend reversal points.
Buy and Sell Signal Option (default: ZLMA) allows traders to choose between ZLMA-based signals or FRAMA RSI-based signals for trade entry.
ZLMA Enhancements
ZLMA Length (default: 14) determines the period for the Zero-Lag Moving Average applied to FRAMA RSI.
Visualization Options
Show Internal Stats Table (default: false) displays real-time FRAMA calculations, including fractal dimension and the adaptive alpha smoothing factor.
Show Threshold FRAMA Signals (default: false) plots buy and sell labels when FRAMA RSI crosses the threshold level.
How It Works
FRAMA Calculation
FRAMA dynamically adjusts smoothing based on the price fractal dimension. The alpha smoothing factor is derived from the fractal dimension or can be set manually to maintain responsiveness.
RSI with FRAMA Smoothing
RSI is calculated using the user-defined lookback period. FRAMA is then applied to the RSI to make it more adaptive to volatility. Optionally, ZLMA is applied to further refine the signals and reduce lag.
Bullish and Bearish Threshold Crosses
A bullish condition occurs when FRAMA RSI crosses above the threshold, while a bearish condition occurs when it falls below. The noise filter ensures that only significant trend shifts generate signals.
Buy and Sell Signal Options
Traders can choose between ZLMA crossovers or FRAMA RSI crossovers as the basis for buy and sell signals, offering flexibility in trade entry timing.
Divergence Detection
The indicator identifies divergences where price action and FRAMA RSI momentum do not align, potentially signaling upcoming reversals.
Reversal Signal Labels
When classic RSI overbought or oversold levels are confirmed by FRAMA RSI conditions, reversal labels are added on the chart to highlight potential exhaustion points.
Bar Coloring System
Bars are dynamically colored based on various conditions such as RSI thresholds, ZLMA crossovers, buy/sell signals, divergence, and reversals, allowing traders to quickly interpret market sentiment.
Alerts and Internal Stats
Customizable alerts notify traders of key events, and an optional internal stats table displays real-time calculations (fractal dimension, alpha value, and RSI values) to help users understand the underlying dynamics of the indicator.
Summary
The Uptrick: FRAMA Matrix RSI offers an enhanced approach to momentum analysis by combining RSI with adaptive FRAMA smoothing and additional layers of signal refinement. The indicator now includes adaptive RSI smoothing to reduce noise and improve responsiveness, Zero-Lag Moving Average filtering to minimize lag, divergence and reversal detection to identify potential turning points, customizable buy/sell signal options that let traders choose between different signal methodologies, a fully customizable bar coloring system to visually distinguish market conditions, and an internal stats table for real-time insight into FRAMA calculation parameters.
Whether used for trend confirmation, divergence detection, or momentum-based strategies, this indicator provides a powerful and adaptive approach to trading.
Disclaimer
This script is for informational and educational purposes only. Trading involves risk, and past performance does not guarantee future results. Always conduct proper research and consult with a financial advisor before making trading decisions.
ka66: Candle Range MarkThis is a simple trailing stop loss tool using bar ranges, to be used with some discretion and understanding of basic price action.
Given a configurable percentage value, e.g. 25%:
A bullish bar (close > open) will be marked at the lower 25%
A bearish bar (close < open) will be marked at the upper 25%
The idea is to move your stop loss after each completed bar in the direction of the trade, at the configured percentage value.
If you have an inside bar, or something very close to it, or a doji-type bar, don't trail that, because there is no clarity of what the bar means, we can only wait.
The chart shows an example use, with trailing at 10% of the bar, from the initial stop loss after entry, trailing till we get stopped out. Some things to note:
Because this example focuses on a short trade, we ignore the bullish candles, and keep our trailing stop at the last bearish candle.
We ignore doji-esque candles and inside bars, where the body is in the range of the prior candle. Some definitions of inside bars include the wicks as well. I don't have a strong opinion, and this example is just for illustration. Furthermore, the inside bar will likely be the opposite of the swing bars (e.g. bullish bar in a range of bearish bars), so our stop remains unchanged.
One could use this semi-systematic approach in scalping on any timeframe, for example to maximise gains, adjusting the bar percentage as needed.
Fractal Trend Detector [Skyrexio]Introduction
Fractal Trend Detector leverages the combination of Williams fractals and Alligator Indicator to help traders to understand with the high probability what is the current trend: bullish or bearish. It visualizes the potential uptrend with the coloring bars in green, downtrend - in red color. Indicator also contains two additional visualizations, the strong uptrend and downtrend as the green and red zones and the white line - trend invalidation level (more information in "Methodology and it's justification" paragraph)
Features
Optional strong up and downtrends visualization: with the specified parameter in settings user can add/hide the green and red zones of the strong up and downtrends.
Optional trend invalidation level visualization: with the specified parameter in settings user can add/hide the white line which shows the current trend invalidation price.
Alerts: user can set up the alert and have notifications when uptrend/downtrend has been started, strong uptrend/downtrend started.
Methodology and it's justification
In this script we apply the concept of trend given by Bill Williams in his book "Trading Chaos". This approach leverages the Alligator and Fractals in conjunction. Let's briefly explain these two components.
The Williams Alligator, created by Bill Williams, is a technical analysis tool used to identify trends and potential market reversals. It consists of three moving averages, called the jaw, teeth, and lips, which represent different time periods:
Jaw (Blue Line): The slowest line, showing a 13-period smoothed moving average shifted 8 bars forward.
Teeth (Red Line): The medium-speed line, an 8-period smoothed moving average shifted 5 bars forward.
Lips (Green Line): The fastest line, a 5-period smoothed moving average shifted 3 bars forward.
When the lines are spread apart and aligned, the "alligator" is "awake," indicating a strong trend. When the lines intertwine, the "alligator" is "sleeping," signaling a non-trending or range-bound market. This indicator helps traders identify when to enter or avoid trades.
Williams Fractals, introduced by Bill Williams, are a technical analysis tool used to identify potential reversal points on a price chart. A fractal is a series of at least five consecutive bars where the middle bar has the highest high (for a up fractal) or the lowest low (for a down fractal), compared to the two bars on either side.
Key Points:
Up fractal: Formed when the middle bar shows a higher high than the two preceding and two following bars, signaling a potential turning point downward.
Down fractal: Formed when the middle bar has a lower low than the two surrounding bars, indicating a potential upward reversal.
Fractals are often used with other indicators to confirm trend direction or reversal, helping traders make more informed trading decisions.
How we can use its combination? Let's explain the uptrend example. The up fractal breakout to the upside can be interpret as bullish sign, there is a high probability that uptrend has just been started. It can be explained as following: the up fractal created is the potential change in market's behavior. A lot of traders made a decision to sell and it created the pullback with the fractal at the top. But if price is able to reach the fractal's top and break it, this is a high probability sign that market "changed his opinion" and bullish trend has been started. The moment of breaking is the potential changing to the uptrend. Here is another one important point, this breakout shall happen above the Alligator's teeth line. If not, this crossover doesn't count and the downtrend potentially remaining. The inverted logic is true for the down fractals and downtrend.
According to this methodology we received the high probability up and downtrend changes, but we can even add it. If current trend established by the indicator as the uptrend and alligator's lines have the following order: lips is higher than teeth, teeth is higher than jaw, script count it as a strong uptrend and start print the green zone - zone between lips and jaw. It can be used as a high probability support of the current bull market. The inverted logic can be used for bearish trend and red zones: if lips is lower than teeth and teeth is lower than jaw it's interpreted by the indicator as a strong down trend.
Indicator also has the trend invalidation line (white line). If current bar is green and market condition is interpreted by the script as an uptrend you will see the invalidation line below current price. This is the price level which shall be crossed by the price to change up trend to down trend according to algorithm. This level is recalculated on every candle. The inverted logic is valid for downtrend.
How to use indicator
Apply it to desired chart and time frame. It works on every time frame.
Setup the settings with enabling/disabling visualization of strong up/downtrend zones and trend invalidation line. "Show Strong Bullish/Bearish Trends" and "Show Trend Invalidation Price" checkboxes in the settings. By default they are turned on.
Analyze the price action. Indicator colored candle in green if it's more likely that current state is uptrend, in red if downtrend has the high probability to be now. Green zones between two lines showing if current uptrend is likely to be strong. This zone can be used as a high probability support on the uptrend. The red zone show high probability of strong downtrend and can be used as a resistance. White line is showing the level where uptrend or downtrend is going be invalidated according to indicator's algorithm. If current bar is green invalidation line will be below the current price, if red - above the current price.
Set up the alerts if it's needed. Indicator has four custom alerts called "Uptrend has been started" when current bar closed as green and the previous was not green, "Downtrend has been started" when current bar closed red and the previous was not red, "Uptrend became strong" if script started printing the green zone "Downtrend became strong" if script started printing the red zone.
Disclaimer:
Educational and informational tool reflecting Skyrex commitment to informed trading. Past performance does not guarantee future results. Test indicators before live implementation.
Custom Volume for scalping### **Indicator Summary: Custom Volume with Arrow Highlight**
#### **Purpose:**
This indicator visualizes volume bars in a chart, highlighting specific conditions based on volume trends. It displays arrows above the volume bars to indicate potential bullish or bearish market conditions.
#### **Key Features:**
1. **Volume Bars**:
- The indicator plots volume as columns on the chart.
- Volume bars are colored:
- **White** for bullish volume (when the closing price is higher than the opening price).
- **Blue** for bearish volume (when the closing price is lower than the opening price).
2. **Highlight Conditions**:
- The indicator identifies a sequence of three consecutive volume bars:
- The first two bars must be of the same direction (either both bullish or both bearish).
- The third bar must be of the opposite direction.
- Additionally, the third bar's volume must be greater than the previous bar's volume.
3. **Arrow Indicators**:
- When the highlight conditions are met:
- An **upward arrow** ("▲") is placed above the third volume bar for bullish conditions (when the third bar is bullish).
- A **downward arrow** ("▼") is placed above the third volume bar for bearish conditions (when the third bar is bearish).
- The arrows are colored to match the respective volume bar: white for bullish and blue for bearish.
4. **Adjustable Size**:
- The arrows are sized appropriately to ensure visibility without cluttering the chart.
#### **Use Cases:**
- This indicator can help traders identify potential reversals or continuation patterns based on volume behavior.
- It is particularly useful for traders focusing on volume analysis to confirm market trends and make informed trading decisions.
#### **Customization:**
- Users can modify the conditions and visual attributes according to their preferences, such as changing colors, sizes, and label positions.
### **Conclusion:**
The "Custom Volume with Arrow Highlight" indicator provides a straightforward and effective way to visualize volume trends and identify key market conditions, aiding traders in their decision-making processes. It combines the power of volume analysis with clear visual cues, making it a valuable tool for technical analysis in trading.
If you need any further modifications or details, let me know!
SW Gann Pressure time from tops and bottomsW.D. Gann's trading techniques often emphasized the significance of time in the markets, believing that specific time intervals could influence price movements. Here’s how the 30, 60, 90, 120, 180, and 270 bar intervals relate to Gann's rules:
1. **30 Bars**:
- Gann often viewed shorter time frames as critical for identifying short-term trends. A 30-bar interval can signify minor cycles or potential turning points in price.
2. **60 Bars**:
- This interval is significant as Gann believed in the importance of quarterly cycles. A 60-bar mark could indicate a completion of a two-month cycle, often leading to retracements or reversals.
3. **90 Bars**:
- Gann considered 90 days (or bars) to represent a quarter. This interval can signify a substantial shift in market sentiment or a pivotal point in a longer trend.
4. **120 Bars**:
- The 120-bar mark corresponds to about four months. Gann viewed longer intervals as more significant, often leading to major shifts in market trends.
5. **180 Bars**:
- A 180-bar period relates to a semi-annual cycle, which Gann regarded as critical for major support and resistance levels. Price action around this interval can reveal potential long-term trend reversals.
6. **270 Bars**:
- Gann believed that longer cycles, such as 270 bars (approximately nine months), could indicate significant market phases. This interval may represent major turning points and help identify long-term trends.
### Application in Trading:
- **Identifying Trends**: Traders can use these intervals to spot potential trend reversals or continuations based on Gann’s principles of market cycles.
- **Setting Targets and Stops**: Knowing where these key bars fall can help in setting profit targets and stop-loss orders.
- **Analyzing Market Sentiment**: Price reactions at these intervals can provide insights into market psychology and sentiment shifts.
By marking these intervals on a chart, traders can visually assess when price action aligns with Gann's theories, helping them make more informed trading decisions based on historical patterns and cycles.
PineConnectorLibrary "PineConnector"
This library is a comprehensive alert webhook text generator for PineConnector. It contains every possible alert syntax variation from the documentation, along with some debugging functions.
To use it, just import the library (eg. "import ZenAndTheArtOfTrading/PineConnector/1 as pc") and use pc.buy(licenseID) to send an alert off to PineConnector - assuming all your webhooks etc are set up correctly.
View the PineConnector documentation for more information on how to send the commands you're looking to send (all of this library's function names match the documentation).
all()
Usage: pc.buy(pc_id, freq=pc.all())
Returns: "all"
once_per_bar()
Usage: pc.buy(pc_id, freq=pc.once_per_bar())
Returns: "once_per_bar"
once_per_bar_close()
Usage: pc.buy(pc_id, freq=pc.once_per_bar_close())
Returns: "once_per_bar_close"
na0(value)
Checks if given value is either 'na' or 0. Useful for streamlining scripts with float user setting inputs which default values to 0 since na is unavailable as a user input default.
Parameters:
value (float) : The value to check
Returns: True if the given value is 0 or na
getDecimals()
Calculates how many decimals are on the quote price of the current market.
Returns: The current decimal places on the market quote price
truncate(number, decimals)
Truncates the given number. Required params: mumber.
Parameters:
number (float) : Number to truncate
decimals (int) : Decimal places to cut down to
Returns: The input number, but as a string truncated to X decimals
getPipSize(multiplier)
Calculates the pip size of the current market.
Parameters:
multiplier (int) : The mintick point multiplier (1 by default, 10 for FX/Crypto/CFD but can be used to override when certain markets require)
Returns: The pip size for the current market
toWhole(number)
Converts pips into whole numbers. Required params: number.
Parameters:
number (float) : The pip number to convert into a whole number
Returns: The converted number
toPips(number)
Converts whole numbers back into pips. Required params: number.
Parameters:
number (float) : The whole number to convert into pips
Returns: The converted number
debug(txt, tooltip, displayLabel)
Prints to console and generates a debug label with the given text. Required params: txt.
Parameters:
txt (string) : Text to display
tooltip (string) : Tooltip to display (optional)
displayLabel (bool) : Turns on/off chart label (default: off)
Returns: Nothing
order(licenseID, command, symbol, parameters, accfilter, comment, secret, freq, debug)
Generates an alert string. Required params: licenseID, command.
Parameters:
licenseID (string) : Your PC license ID
command (string) : Command to send
symbol (string) : The symbol to trigger this order on
parameters (string) : Other optional parameters to include
accfilter (float) : Optional minimum account balance filter
comment (string) : Optional comment (maximum 20 characters)
secret (string) : Optional secret key (must be enabled in dashboard)
freq (string) : Alert frequency. Default = "all", options = "once_per_bar", "once_per_bar_close" and "none"
debug (bool) : Turns on/off debug label
Returns: An alert string with valid PC syntax based on supplied parameters
market_order(licenseID, buy, risk, sl, tp, betrigger, beoffset, spread, trailtrig, traildist, trailstep, atrtimeframe, atrperiod, atrmultiplier, atrshift, atrtrigger, symbol, accfilter, comment, secret, freq, debug)
Generates a market entry alert with relevant syntax commands. Required params: licenseID, buy, risk.
Parameters:
licenseID (string) : Your PC license ID
buy (bool) : true=buy/long, false=sell/short
risk (float) : Risk quantity (according to EA settings)
sl (float) : Stop loss distance in pips or price
tp (float) : Take profit distance in pips or price
betrigger (float) : Breakeven will be activated after the position gains this number of pips
beoffset (float) : Offset from entry price. This is the amount of pips you'd like to protect
spread (float) : Enter the position only if the spread is equal or less than the specified value in pips
trailtrig (float) : Trailing stop-loss will be activated after a trade gains this number of pips
traildist (float) : Distance of the trailing stop-loss from current price
trailstep (float) : Moves trailing stop-loss once price moves to favourable by a specified number of pips
atrtimeframe (int) : ATR Trailing Stop timeframe, only updates once per bar close. Options: 1, 5, 15, 30, 60, 240, 1440
atrperiod (int) : ATR averaging period
atrmultiplier (float) : Multiple of ATR to utilise in the new SL computation, default = 1
atrshift (int) : Relative shift of price information, 0 uses latest candle, 1 uses second last, etc. Default = 0
atrtrigger (int) : Activate the trigger of ATR Trailing after market moves favourably by a number of pips. Default = 0 (instant)
symbol (string) : The symbol to trigger this order on (defaults to current symbol)
accfilter (float) : Optional minimum account balance filter
comment (string) : Optional comment (maximum 20 characters)
secret (string) : Optional secret key (must be enabled in dashboard)
freq (string) : Alert frequency. Default = "all", options = "once_per_bar", "once_per_bar_close" and "none"
debug (bool) : Turns on/off debug label
Returns: A market order alert string with valid PC syntax based on supplied parameters
buy(licenseID, risk, sl, tp, betrigger, beoffset, spread, trailtrig, traildist, trailstep, atrtimeframe, atrperiod, atrmultiplier, atrshift, atrtrigger, symbol, accfilter, comment, secret, freq, debug)
Generates a market buy alert with relevant syntax commands. Required params: licenseID, risk.
Parameters:
licenseID (string) : Your PC license ID
risk (float) : Risk quantity (according to EA settings)
sl (float) : Stop loss distance in pips or price
tp (float) : Take profit distance in pips or price
betrigger (float) : Breakeven will be activated after the position gains this number of pips
beoffset (float) : Offset from entry price. This is the amount of pips you'd like to protect
spread (float) : Enter the position only if the spread is equal or less than the specified value in pips
trailtrig (float) : Trailing stop-loss will be activated after a trade gains this number of pips
traildist (float) : Distance of the trailing stop-loss from current price
trailstep (float) : Moves trailing stop-loss once price moves to favourable by a specified number of pips
atrtimeframe (int) : ATR Trailing Stop timeframe, only updates once per bar close. Options: 1, 5, 15, 30, 60, 240, 1440
atrperiod (int) : ATR averaging period
atrmultiplier (float) : Multiple of ATR to utilise in the new SL computation, default = 1
atrshift (int) : Relative shift of price information, 0 uses latest candle, 1 uses second last, etc. Default = 0
atrtrigger (int) : Activate the trigger of ATR Trailing after market moves favourably by a number of pips. Default = 0 (instant)
symbol (string) : The symbol to trigger this order on (defaults to current symbol)
accfilter (float) : Optional minimum account balance filter
comment (string) : Optional comment (maximum 20 characters)
secret (string) : Optional secret key (must be enabled in dashboard)
freq (string) : Alert frequency. Default = "all", options = "once_per_bar", "once_per_bar_close" and "none"
debug (bool) : Turns on/off debug label
Returns: A market order alert string with valid PC syntax based on supplied parameters
sell(licenseID, risk, sl, tp, betrigger, beoffset, spread, trailtrig, traildist, trailstep, atrtimeframe, atrperiod, atrmultiplier, atrshift, atrtrigger, symbol, accfilter, comment, secret, freq, debug)
Generates a market sell alert with relevant syntax commands. Required params: licenseID, risk.
Parameters:
licenseID (string) : Your PC license ID
risk (float) : Risk quantity (according to EA settings)
sl (float) : Stop loss distance in pips or price
tp (float) : Take profit distance in pips or price
betrigger (float) : Breakeven will be activated after the position gains this number of pips
beoffset (float) : Offset from entry price. This is the amount of pips you'd like to protect
spread (float) : Enter the position only if the spread is equal or less than the specified value in pips
trailtrig (float) : Trailing stop-loss will be activated after a trade gains this number of pips
traildist (float) : Distance of the trailing stop-loss from current price
trailstep (float) : Moves trailing stop-loss once price moves to favourable by a specified number of pips
atrtimeframe (int) : ATR Trailing Stop timeframe, only updates once per bar close. Options: 1, 5, 15, 30, 60, 240, 1440
atrperiod (int) : ATR averaging period
atrmultiplier (float) : Multiple of ATR to utilise in the new SL computation, default = 1
atrshift (int) : Relative shift of price information, 0 uses latest candle, 1 uses second last, etc. Default = 0
atrtrigger (int) : Activate the trigger of ATR Trailing after market moves favourably by a number of pips. Default = 0 (instant)
symbol (string) : The symbol to trigger this order on (defaults to current symbol)
accfilter (float) : Optional minimum account balance filter
comment (string) : Optional comment (maximum 20 characters)
secret (string) : Optional secret key (must be enabled in dashboard)
freq (string) : Alert frequency. Default = "all", options = "once_per_bar", "once_per_bar_close" and "none"
debug (bool) : Turns on/off debug label
Returns: A market order alert string with valid PC syntax based on supplied parameters
closeall(licenseID, comment, secret, freq, debug)
Closes all open trades at market regardless of symbol. Required params: licenseID.
Parameters:
licenseID (string) : Your PC license ID
comment (string) : Optional comment to include (max 20 characters)
secret (string) : Optional secret key (must be enabled in dashboard)
freq (string) : Alert frequency. Default = "all", options = "once_per_bar", "once_per_bar_close" and "none"
debug (bool) : Turns on/off debug label
Returns: The required alert syntax as a string
closealleaoff(licenseID, comment, secret, freq, debug)
Closes all open trades at market regardless of symbol, and turns the EA off. Required params: licenseID.
Parameters:
licenseID (string) : Your PC license ID
comment (string) : Optional comment to include (max 20 characters)
secret (string) : Optional secret key (must be enabled in dashboard)
freq (string) : Alert frequency. Default = "all", options = "once_per_bar", "once_per_bar_close" and "none"
debug (bool) : Turns on/off debug label
Returns: The required alert syntax as a string
closelong(licenseID, symbol, comment, secret, freq, debug)
Closes all long trades at market for the given symbol. Required params: licenseID.
Parameters:
licenseID (string) : Your PC license ID
symbol (string) : Symbol to act on (defaults to current symbol)
comment (string) : Optional comment to include (max 20 characters)
secret (string) : Optional secret key (must be enabled in dashboard)
freq (string) : Alert frequency. Default = "all", options = "once_per_bar", "once_per_bar_close" and "none"
debug (bool) : Turns on/off debug label
Returns: The required alert syntax as a string
closeshort(licenseID, symbol, comment, secret, freq, debug)
Closes all open short trades at market for the given symbol. Required params: licenseID.
Parameters:
licenseID (string) : Your PC license ID
symbol (string) : Symbol to act on (defaults to current symbol)
comment (string) : Optional comment to include (max 20 characters)
secret (string) : Optional secret key (must be enabled in dashboard)
freq (string) : Alert frequency. Default = "all", options = "once_per_bar", "once_per_bar_close" and "none"
debug (bool) : Turns on/off debug label
Returns: The required alert syntax as a string
closelongshort(licenseID, symbol, comment, secret, freq, debug)
Closes all open trades at market for the given symbol. Required params: licenseID.
Parameters:
licenseID (string) : Your PC license ID
symbol (string) : Symbol to act on (defaults to current symbol)
comment (string) : Optional comment to include (max 20 characters)
secret (string) : Optional secret key (must be enabled in dashboard)
freq (string) : Alert frequency. Default = "all", options = "once_per_bar", "once_per_bar_close" and "none"
debug (bool) : Turns on/off debug label
Returns: The required alert syntax as a string
closelongbuy(licenseID, risk, symbol, comment, secret, freq, debug)
Close all long positions and open a new long at market for the given symbol with given risk/contracts. Required params: licenseID.
Parameters:
licenseID (string) : Your PC license ID
risk (float) : Risk or contracts (according to EA settings)
symbol (string) : Symbol to act on (defaults to current symbol)
comment (string) : Optional comment to include (max 20 characters)
secret (string) : Optional secret key (must be enabled in dashboard)
freq (string) : Alert frequency. Default = "all", options = "once_per_bar", "once_per_bar_close" and "none"
debug (bool) : Turns on/off debug label
Returns: The required alert syntax as a string
closeshortsell(licenseID, risk, symbol, comment, secret, freq, debug)
Close all short positions and open a new short at market for the given symbol with given risk/contracts. Required params: licenseID, risk.
Parameters:
licenseID (string) : Your PC license ID
risk (float) : Risk or contracts (according to EA settings)
symbol (string) : Symbol to act on (defaults to current symbol)
comment (string) : Optional comment to include (max 20 characters)
secret (string) : Optional secret key (must be enabled in dashboard)
freq (string) : Alert frequency. Default = "all", options = "once_per_bar", "once_per_bar_close" and "none"
debug (bool) : Turns on/off debug label
Returns: The required alert syntax as a string
newsltplong(licenseID, sl, tp, symbol, accfilter, comment, secret, freq, debug)
Updates the stop loss and/or take profit of any open long trades on the given symbol with the given values. Required params: licenseID, sl and/or tp.
Parameters:
licenseID (string) : Your PC license ID
sl (float) : Stop loss pips or price (according to EA settings)
tp (float) : Take profit pips or price (according to EA settings)
symbol (string) : Symbol to act on (defaults to current symbol)
accfilter (float) : Optional minimum account balance filter
comment (string) : Optional comment to include (max 20 characters)
secret (string) : Optional secret key (must be enabled in dashboard)
freq (string) : Alert frequency. Default = "all", options = "once_per_bar", "once_per_bar_close" and "none"
debug (bool) : Turns on/off debug label
Returns: The required alert syntax as a string
newsltpshort(licenseID, sl, tp, symbol, accfilter, comment, secret, freq, debug)
Updates the stop loss and/or take profit of any open short trades on the given symbol with the given values. Required params: licenseID, sl and/or tp.
Parameters:
licenseID (string) : Your PC license ID
sl (float) : Stop loss pips or price (according to EA settings)
tp (float) : Take profit pips or price (according to EA settings)
symbol (string) : Symbol to act on (defaults to current symbol)
accfilter (float) : Optional minimum account balance filter
comment (string) : Optional comment to include (max 20 characters)
secret (string) : Optional secret key (must be enabled in dashboard)
freq (string) : Alert frequency. Default = "all", options = "once_per_bar", "once_per_bar_close" and "none"
debug (bool) : Turns on/off debug label
Returns: The required alert syntax as a string
closelongpct(licenseID, symbol, comment, secret, freq, debug)
Close a percentage of open long positions (according to EA settings). Required params: licenseID.
Parameters:
licenseID (string) : Your PC license ID
symbol (string) : Symbol to act on (defaults to current symbol)
comment (string) : Optional comment to include (max 20 characters)
secret (string) : Optional secret key (must be enabled in dashboard)
freq (string) : Alert frequency. Default = "all", options = "once_per_bar", "once_per_bar_close" and "none"
debug (bool) : Turns on/off debug label
Returns: The required alert syntax as a string
closeshortpct(licenseID, symbol, comment, secret, freq, debug)
Close a percentage of open short positions (according to EA settings). Required params: licenseID.
Parameters:
licenseID (string) : Your PC license ID
symbol (string) : Symbol to act on (defaults to current symbol)
comment (string) : Optional comment to include (max 20 characters)
secret (string) : Optional secret key (must be enabled in dashboard)
freq (string) : Alert frequency. Default = "all", options = "once_per_bar", "once_per_bar_close" and "none"
debug (bool) : Turns on/off debug label
Returns: The required alert syntax as a string
closelongvol(licenseID, risk, symbol, comment, secret, freq, debug)
Close all open long contracts on the current symbol until the given risk value is remaining. Required params: licenseID, risk.
Parameters:
licenseID (string) : Your PC license ID
risk (float) : The quantity to leave remaining
symbol (string) : Symbol to act on (defaults to current symbol)
comment (string) : Optional comment to include (max 20 characters)
secret (string) : Optional secret key (must be enabled in dashboard)
freq (string) : Alert frequency. Default = "all", options = "once_per_bar", "once_per_bar_close" and "none"
debug (bool) : Turns on/off debug label
Returns: The required alert syntax as a string
closeshortvol(licenseID, risk, symbol, comment, secret, freq, debug)
Close all open short contracts on the current symbol until the given risk value is remaining. Required params: licenseID, risk.
Parameters:
licenseID (string) : Your PC license ID
risk (float) : The quantity to leave remaining
symbol (string) : Symbol to act on (defaults to current symbol)
comment (string) : Optional comment to include (max 20 characters)
secret (string) : Optional secret key (must be enabled in dashboard)
freq (string) : Alert frequency. Default = "all", options = "once_per_bar", "once_per_bar_close" and "none"
debug (bool) : Turns on/off debug label
Returns: The required alert syntax as a string
limit_order(licenseID, buy, price, risk, sl, tp, betrigger, beoffset, spread, trailtrig, traildist, trailstep, atrtimeframe, atrperiod, atrmultiplier, atrshift, atrtrigger, symbol, accfilter, comment, secret, freq, debug)
Generates a limit order alert with relevant syntax commands. Required params: licenseID, buy, price, risk.
Parameters:
licenseID (string) : Your PC license ID
buy (bool) : true=buy/long, false=sell/short
price (float) : Price or pips to set limit order (according to EA settings)
risk (float) : Risk quantity (according to EA settings)
sl (float) : Stop loss distance in pips or price
tp (float) : Take profit distance in pips or price
betrigger (float) : Breakeven will be activated after the position gains this number of pips
beoffset (float) : Offset from entry price. This is the amount of pips you'd like to protect
spread (float) : Enter the position only if the spread is equal or less than the specified value in pips
trailtrig (float) : Trailing stop-loss will be activated after a trade gains this number of pips
traildist (float) : Distance of the trailing stop-loss from current price
trailstep (float) : Moves trailing stop-loss once price moves to favourable by a specified number of pips
atrtimeframe (int) : ATR Trailing Stop timeframe, only updates once per bar close. Options: 1, 5, 15, 30, 60, 240, 1440
atrperiod (int) : ATR averaging period
atrmultiplier (float) : Multiple of ATR to utilise in the new SL computation, default = 1
atrshift (int) : Relative shift of price information, 0 uses latest candle, 1 uses second last, etc. Default = 0
atrtrigger (int) : Activate the trigger of ATR Trailing after market moves favourably by a number of pips. Default = 0 (instant)
symbol (string) : The symbol to trigger this order on (defaults to current symbol)
accfilter (float) : Optional minimum account balance filter
comment (string) : Optional comment (maximum 20 characters)
secret (string) : Optional secret key (must be enabled in dashboard)
freq (string) : Alert frequency. Default = "all", options = "once_per_bar", "once_per_bar_close" and "none"
debug (bool) : Turns on/off debug label
Returns: A limit order alert string with valid PC syntax based on supplied parameters
buylimit(licenseID, price, risk, sl, tp, betrigger, beoffset, spread, trailtrig, traildist, trailstep, atrtimeframe, atrperiod, atrmultiplier, atrshift, atrtrigger, symbol, accfilter, comment, secret, freq, debug)
Generates a buylimit order alert with relevant syntax commands. Required params: licenseID, price, risk.
Parameters:
licenseID (string) : Your PC license ID
price (float) : Price or pips to set limit order (according to EA settings)
risk (float) : Risk quantity (according to EA settings)
sl (float) : Stop loss distance in pips or price
tp (float) : Take profit distance in pips or price
betrigger (float) : Breakeven will be activated after the position gains this number of pips
beoffset (float) : Offset from entry price. This is the amount of pips you'd like to protect
spread (float) : Enter the position only if the spread is equal or less than the specified value in pips
trailtrig (float) : Trailing stop-loss will be activated after a trade gains this number of pips
traildist (float) : Distance of the trailing stop-loss from current price
trailstep (float) : Moves trailing stop-loss once price moves to favourable by a specified number of pips
atrtimeframe (int) : ATR Trailing Stop timeframe, only updates once per bar close. Options: 1, 5, 15, 30, 60, 240, 1440
atrperiod (int) : ATR averaging period
atrmultiplier (float) : Multiple of ATR to utilise in the new SL computation, default = 1
atrshift (int) : Relative shift of price information, 0 uses latest candle, 1 uses second last, etc. Default = 0
atrtrigger (int) : Activate the trigger of ATR Trailing after market moves favourably by a number of pips. Default = 0 (instant)
symbol (string) : The symbol to trigger this order on (defaults to current symbol)
accfilter (float) : Optional minimum account balance filter
comment (string) : Optional comment (maximum 20 characters)
secret (string) : Optional secret key (must be enabled in dashboard)
freq (string) : Alert frequency. Default = "all", options = "once_per_bar", "once_per_bar_close" and "none"
debug (bool) : Turns on/off debug label
Returns: A limit order alert string with valid PC syntax based on supplied parameters
selllimit(licenseID, price, risk, sl, tp, betrigger, beoffset, spread, trailtrig, traildist, trailstep, atrtimeframe, atrperiod, atrmultiplier, atrshift, atrtrigger, symbol, accfilter, comment, secret, freq, debug)
Generates a selllimit order alert with relevant syntax commands. Required params: licenseID, price, risk.
Parameters:
licenseID (string) : Your PC license ID
price (float) : Price or pips to set limit order (according to EA settings)
risk (float) : Risk quantity (according to EA settings)
sl (float) : Stop loss distance in pips or price
tp (float) : Take profit distance in pips or price
betrigger (float) : Breakeven will be activated after the position gains this number of pips
beoffset (float) : Offset from entry price. This is the amount of pips you'd like to protect
spread (float) : Enter the position only if the spread is equal or less than the specified value in pips
trailtrig (float) : Trailing stop-loss will be activated after a trade gains this number of pips
traildist (float) : Distance of the trailing stop-loss from current price
trailstep (float) : Moves trailing stop-loss once price moves to favourable by a specified number of pips
atrtimeframe (int) : ATR Trailing Stop timeframe, only updates once per bar close. Options: 1, 5, 15, 30, 60, 240, 1440
atrperiod (int) : ATR averaging period
atrmultiplier (float) : Multiple of ATR to utilise in the new SL computation, default = 1
atrshift (int) : Relative shift of price information, 0 uses latest candle, 1 uses second last, etc. Default = 0
atrtrigger (int) : Activate the trigger of ATR Trailing after market moves favourably by a number of pips. Default = 0 (instant)
symbol (string) : The symbol to trigger this order on (defaults to current symbol)
accfilter (float) : Optional minimum account balance filter
comment (string) : Optional comment (maximum 20 characters)
secret (string) : Optional secret key (must be enabled in dashboard)
freq (string) : Alert frequency. Default = "all", options = "once_per_bar", "once_per_bar_close" and "none"
debug (bool) : Turns on/off debug label
Returns: A limit order alert string with valid PC syntax based on supplied parameters
stop_order(licenseID, buy, price, risk, sl, tp, betrigger, beoffset, spread, trailtrig, traildist, trailstep, atrtimeframe, atrperiod, atrmultiplier, atrshift, atrtrigger, symbol, accfilter, comment, secret, freq, debug)
Generates a stop order alert with relevant syntax commands. Required params: licenseID, buy, price, risk.
Parameters:
licenseID (string) : Your PC license ID
buy (bool) : true=buy/long, false=sell/short
price (float) : Price or pips to set limit order (according to EA settings)
risk (float) : Risk quantity (according to EA settings)
sl (float) : Stop loss distance in pips or price
tp (float) : Take profit distance in pips or price
betrigger (float) : Breakeven will be activated after the position gains this number of pips
beoffset (float) : Offset from entry price. This is the amount of pips you'd like to protect
spread (float) : Enter the position only if the spread is equal or less than the specified value in pips
trailtrig (float) : Trailing stop-loss will be activated after a trade gains this number of pips
traildist (float) : Distance of the trailing stop-loss from current price
trailstep (float) : Moves trailing stop-loss once price moves to favourable by a specified number of pips
atrtimeframe (int) : ATR Trailing Stop timeframe, only updates once per bar close. Options: 1, 5, 15, 30, 60, 240, 1440
atrperiod (int) : ATR averaging period
atrmultiplier (float) : Multiple of ATR to utilise in the new SL computation, default = 1
atrshift (int) : Relative shift of price information, 0 uses latest candle, 1 uses second last, etc. Default = 0
atrtrigger (int) : Activate the trigger of ATR Trailing after market moves favourably by a number of pips. Default = 0 (instant)
symbol (string) : The symbol to trigger this order on (defaults to current symbol)
accfilter (float) : Optional minimum account balance filter
comment (string) : Optional comment (maximum 20 characters)
secret (string) : Optional secret key (must be enabled in dashboard)
freq (string) : Alert frequency. Default = "all", options = "once_per_bar", "once_per_bar_close" and "none"
debug (bool) : Turns on/off debug label
Returns: A stop order alert string with valid PC syntax based on supplied parameters
buystop(licenseID, price, risk, sl, tp, betrigger, beoffset, spread, trailtrig, traildist, trailstep, atrtimeframe, atrperiod, atrmultiplier, atrshift, atrtrigger, symbol, accfilter, comment, secret, freq, debug)
Generates a buystop order alert with relevant syntax commands. Required params: licenseID, price, risk.
Parameters:
licenseID (string) : Your PC license ID
price (float) : Price or pips to set limit order (according to EA settings)
risk (float) : Risk quantity (according to EA settings)
sl (float) : Stop loss distance in pips or price
tp (float) : Take profit distance in pips or price
betrigger (float) : Breakeven will be activated after the position gains this number of pips
beoffset (float) : Offset from entry price. This is the amount of pips you'd like to protect
spread (float) : Enter the position only if the spread is equal or less than the specified value in pips
trailtrig (float) : Trailing stop-loss will be activated after a trade gains this number of pips
traildist (float) : Distance of the trailing stop-loss from current price
trailstep (float) : Moves trailing stop-loss once price moves to favourable by a specified number of pips
atrtimeframe (int) : ATR Trailing Stop timeframe, only updates once per bar close. Options: 1, 5, 15, 30, 60, 240, 1440
atrperiod (int) : ATR averaging period
atrmultiplier (float) : Multiple of ATR to utilise in the new SL computation, default = 1
atrshift (int) : Relative shift of price information, 0 uses latest candle, 1 uses second last, etc. Default = 0
atrtrigger (int) : Activate the trigger of ATR Trailing after market moves favourably by a number of pips. Default = 0 (instant)
symbol (string) : The symbol to trigger this order on (defaults to current symbol)
accfilter (float) : Optional minimum account balance filter
comment (string) : Optional comment (maximum 20 characters)
secret (string) : Optional secret key (must be enabled in dashboard)
freq (string) : Alert frequency. Default = "all", options = "once_per_bar", "once_per_bar_close" and "none"
debug (bool) : Turns on/off debug label
Returns: A stop order alert string with valid PC syntax based on supplied parameters
sellstop(licenseID, price, risk, sl, tp, betrigger, beoffset, spread, trailtrig, traildist, trailstep, atrtimeframe, atrperiod, atrmultiplier, atrshift, atrtrigger, symbol, accfilter, comment, secret, freq, debug)
Generates a sellstop order alert with relevant syntax commands. Required params: licenseID, price, risk.
Parameters:
licenseID (string) : Your PC license ID
price (float) : Price or pips to set limit order (according to EA settings)
risk (float) : Risk quantity (according to EA settings)
sl (float) : Stop loss distance in pips or price
tp (float) : Take profit distance in pips or price
betrigger (float) : Breakeven will be activated after the position gains this number of pips
beoffset (float) : Offset from entry price. This is the amount of pips you'd like to protect
spread (float) : Enter the position only if the spread is equal or less than the specified value in pips
trailtrig (float) : Trailing stop-loss will be activated after a trade gains this number of pips
traildist (float) : Distance of the trailing stop-loss from current price
trailstep (float) : Moves trailing stop-loss once price moves to favourable by a specified number of pips
atrtimeframe (int) : ATR Trailing Stop timeframe, only updates once per bar close. Options: 1, 5, 15, 30, 60, 240, 1440
atrperiod (int) : ATR averaging period
atrmultiplier (float) : Multiple of ATR to utilise in the new SL computation, default = 1
atrshift (int) : Relative shift of price information, 0 uses latest candle, 1 uses second last, etc. Default = 0
atrtrigger (int) : Activate the trigger of ATR Trailing after market moves favourably by a number of pips. Default = 0 (instant)
symbol (string) : The symbol to trigger this order on (defaults to current symbol)
accfilter (float) : Optional minimum account balance filter
comment (string) : Optional comment (maximum 20 characters)
secret (string) : Optional secret key (must be enabled in dashboard)
freq (string) : Alert frequency. Default = "all", options = "once_per_bar", "once_per_bar_close" and "none"
debug (bool) : Turns on/off debug label
Returns: A stop order alert string with valid PC syntax based on supplied parameters
cancel_neworder(licenseID, order, price, risk, sl, tp, betrigger, beoffset, spread, trailtrig, traildist, trailstep, atrtimeframe, atrperiod, atrmultiplier, atrshift, atrtrigger, symbol, accfilter, comment, secret, freq, debug)
Cancel + place new order template function.
Parameters:
licenseID (string) : Your PC license ID
order (string) : Cancel order type
price (float) : Price or pips to set limit order (according to EA settings)
risk (float) : Risk quantity (according to EA settings)
sl (float) : Stop loss distance in pips or price
tp (float) : Take profit distance in pips or price
betrigger (float) : Breakeven will be activated after the position gains this number of pips
beoffset (float) : Offset from entry price. This is the amount of pips you'd like to protect
spread (float) : Enter the position only if the spread is equal or less than the specified value in pips
trailtrig (float) : Trailing stop-loss will be activated after a trade gains this number of pips
traildist (float) : Distance of the trailing stop-loss from current price
trailstep (float) : Moves trailing stop-loss once price moves to favourable by a specified number of pips
atrtimeframe (int) : ATR Trailing Stop timeframe, only updates once per bar close. Options: 1, 5, 15, 30, 60, 240, 1440
atrperiod (int) : ATR averaging period
atrmultiplier (float) : Multiple of ATR to utilise in the new SL computation, default = 1
atrshift (int) : Relative shift of price information, 0 uses latest candle, 1 uses second last, etc. Default = 0
atrtrigger (int) : Activate the trigger of ATR Trailing after market moves favourably by a number of pips. Default = 0 (instant)
symbol (string) : The symbol to trigger this order on (defaults to current symbol)
accfilter (float) : Optional minimum account balance filter
comment (string) : Optional comment (maximum 20 characters)
secret (string) : Optional secret key (must be enabled in dashboard)
freq (string) : Alert frequency. Default = "all", options = "once_per_bar", "once_per_bar_close" and "none"
debug (bool) : Turns on/off debug label
Returns: A stop order alert string with valid PC syntax based on supplied parameters
cancellongbuystop(licenseID, price, risk, sl, tp, betrigger, beoffset, spread, trailtrig, traildist, trailstep, atrtimeframe, atrperiod, atrmultiplier, atrshift, atrtrigger, symbol, accfilter, comment, secret, freq, debug)
Cancels all long orders with the specified symbol and places a new buystop order. Required params: licenseID, price, risk.
Parameters:
licenseID (string) : Your PC license ID
price (float) : Price or pips to set limit order (according to EA settings)
risk (float) : Risk quantity (according to EA settings)
sl (float) : Stop loss distance in pips or price
tp (float) : Take profit distance in pips or price
betrigger (float) : Breakeven will be activated after the position gains this number of pips
beoffset (float) : Offset from entry price. This is the amount of pips you'd like to protect
spread (float) : Enter the position only if the spread is equal or less than the specified value in pips
trailtrig (float) : Trailing stop-loss will be activated after a trade gains this number of pips
traildist (float) : Distance of the trailing stop-loss from current price
trailstep (float) : Moves trailing stop-loss once price moves to favourable by a specified number of pips
atrtimeframe (int) : ATR Trailing Stop timeframe, only updates once per bar close. Options: 1, 5, 15, 30, 60, 240, 1440
atrperiod (int) : ATR averaging period
atrmultiplier (float) : Multiple of ATR to utilise in the new SL computation, default = 1
atrshift (int) : Relative shift of price information, 0 uses latest candle, 1 uses second last, etc. Default = 0
atrtrigger (int) : Activate the trigger of ATR Trailing after market moves favourably by a number of pips. Default = 0 (instant)
symbol (string) : The symbol to trigger this order on (defaults to current symbol)
accfilter (float) : Optional minimum account balance filter
comment (string) : Optional comment (maximum 20 characters)
secret (string) : Optional secret key (must be enabled in dashboard)
freq (string) : Alert frequency. Default = "all", options = "once_per_bar", "once_per_bar_close" and "none"
debug (bool) : Turns on/off debug label
Returns: A stop order alert string with valid PC syntax based on supplied parameters
cancellongbuylimit(licenseID, price, risk, sl, tp, betrigger, beoffset, spread, trailtrig, traildist, trailstep, atrtimeframe, atrperiod, atrmultiplier, atrshift, atrtrigger, symbol, accfilter, comment, secret, freq, debug)
Cancels all long orders with the specified symbol and places a new buylimit order. Required params: licenseID, price, risk.
Parameters:
licenseID (string) : Your PC license ID
price (float) : Price or pips to set limit order (according to EA settings)
risk (float) : Risk quantity (according to EA settings)
sl (float) : Stop loss distance in pips or price
tp (float) : Take profit distance in pips or price
betrigger (float) : Breakeven will be activated after the position gains this number of pips
beoffset (float) : Offset from entry price. This is the amount of pips you'd like to protect
spread (float) : Enter the position only if the spread is equal or less than the specified value in pips
trailtrig (float) : Trailing stop-loss will be activated after a trade gains this number of pips
traildist (float) : Distance of the trailing stop-loss from current price
trailstep (float) : Moves trailing stop-loss once price moves to favourable by a specified number of pips
atrtimeframe (int) : ATR Trailing Stop timeframe, only updates once per bar close. Options: 1, 5, 15, 30, 60, 240, 1440
atrperiod (int) : ATR averaging period
atrmultiplier (float) : Multiple of ATR to utilise in the new SL computation, default = 1
atrshift (int) : Relative shift of price information, 0 uses latest candle, 1 uses second last, etc. Default = 0
atrtrigger (int) : Activate the trigger of ATR Trailing after market moves favourably by a number of pips. Default = 0 (instant)
symbol (string) : The symbol to trigger this order on (defaults to current symbol)
accfilter (float) : Optional minimum account balance filter
comment (string) : Optional comment (maximum 20 characters)
secret (string) : Optional secret key (must be enabled in dashboard)
freq (string) : Alert frequency. Default = "all", options = "once_per_bar", "once_per_bar_close" and "none"
debug (bool) : Turns on/off debug label
Returns: A stop order alert string with valid PC syntax based on supplied parameters
cancelshortsellstop(licenseID, price, risk, sl, tp, betrigger, beoffset, spread, trailtrig, traildist, trailstep, atrtimeframe, atrperiod, atrmultiplier, atrshift, atrtrigger, symbol, accfilter, comment, secret, freq, debug)
Cancels all short orders with the specified symbol and places a sellstop order. Required params: licenseID, price, risk.
Parameters:
licenseID (string) : Your PC license ID
price (float) : Price or pips to set limit order (according to EA settings)
risk (float) : Risk quantity (according to EA settings)
sl (float) : Stop loss distance in pips or price
tp (float) : Take profit distance in pips or price
betrigger (float) : Breakeven will be activated after the position gains this number of pips
beoffset (float) : Offset from entry price. This is the amount of pips you'd like to protect
spread (float) : Enter the position only if the spread is equal or less than the specified value in pips
trailtrig (float) : Trailing stop-loss will be activated after a trade gains this number of pips
traildist (float) : Distance of the trailing stop-loss from current price
trailstep (float) : Moves trailing stop-loss once price moves to favourable by a specified number of pips
atrtimeframe (int) : ATR Trailing Stop timeframe, only updates once per bar close. Options: 1, 5, 15, 30, 60, 240, 1440
atrperiod (int) : ATR averaging period
atrmultiplier (float) : Multiple of ATR to utilise in the new SL computation, default = 1
atrshift (int) : Relative shift of price information, 0 uses latest candle, 1 uses second last, etc. Default = 0
atrtrigger (int) : Activate the trigger of ATR Trailing after market moves favourably by a number of pips. Default = 0 (instant)
symbol (string) : The symbol to trigger this order on (defaults to current symbol)
accfilter (float) : Optional minimum account balance filter
comment (string) : Optional comment (maximum 20 characters)
secret (string) : Optional secret key (must be enabled in dashboard)
freq (string) : Alert frequency. Default = "all", options = "once_per_bar", "once_per_bar_close" and "none"
debug (bool) : Turns on/off debug label
Returns: A stop order alert string with valid PC syntax based on supplied parameters
cancelshortselllimit(licenseID, price, risk, sl, tp, betrigger, beoffset, spread, trailtrig, traildist, trailstep, atrtimeframe, atrperiod, atrmultiplier, atrshift, atrtrigger, symbol, accfilter, comment, secret, freq, debug)
Cancels all short orders with the specified symbol and places a selllimit order. Required params: licenseID, price, risk.
Parameters:
licenseID (string) : Your PC license ID
price (float) : Price or pips to set limit order (according to EA settings)
risk (float) : Risk quantity (according to EA settings)
sl (float) : Stop loss distance in pips or price
tp (float) : Take profit distance in pips or price
betrigger (float) : Breakeven will be activated after the position gains this number of pips
beoffset (float) : Offset from entry price. This is the amount of pips you'd like to protect
spread (float) : Enter the position only if the spread is equal or less than the specified value in pips
trailtrig (float) : Trailing stop-loss will be activated after a trade gains this number of pips
traildist (float) : Distance of the trailing stop-loss from current price
trailstep (float) : Moves trailing stop-loss once price moves to favourable by a specified number of pips
atrtimeframe (int) : ATR Trailing Stop timeframe, only updates once per bar close. Options: 1, 5, 15, 30, 60, 240, 1440
atrperiod (int) : ATR averaging period
atrmultiplier (float) : Multiple of ATR to utilise in the new SL computation, default = 1
atrshift (int) : Relative shift of price information, 0 uses latest candle, 1 uses second last, etc. Default = 0
atrtrigger (int) : Activate the trigger of ATR Trailing after market moves favourably by a number of pips. Default = 0 (instant)
symbol (string) : The symbol to trigger this order on (defaults to current symbol)
accfilter (float) : Optional minimum account balance filter
comment (string) : Optional comment (maximum 20 characters)
secret (string) : Optional secret key (must be enabled in dashboard)
freq (string) : Alert frequency. Default = "all", options = "once_per_bar", "once_per_bar_close" and "none"
debug (bool) : Turns on/off debug label
Returns: A stop order alert string with valid PC syntax based on supplied parameters
cancellong(licenseID, symbol, accfilter, comment, secret, freq, debug)
Cancels all pending long orders with the specified symbol. Required params: licenseID.
Parameters:
licenseID (string) : Your PC license ID
symbol (string) : Symbol to act on (defaults to current symbol)
accfilter (float) : Optional minimum account balance filter
comment (string) : Optional comment to include (max 20 characters)
secret (string) : Optional secret key (must be enabled in dashboard)
freq (string) : Alert frequency. Default = "all", options = "once_per_bar", "once_per_bar_close" and "none"
debug (bool) : Turns on/off debug label
Returns: A cancel long alert command
cancelshort(licenseID, symbol, accfilter, comment, secret, freq, debug)
Cancels all pending short orders with the specified symbol. Required params: licenseID.
Parameters:
licenseID (string) : Your PC license ID
symbol (string) : Symbol to act on (defaults to current symbol)
accfilter (float) : Optional minimum account balance filter
comment (string) : Optional comment to include (max 20 characters)
secret (string) : Optional secret key (must be enabled in dashboard)
freq (string) : Alert frequency. Default = "all", options = "once_per_bar", "once_per_bar_close" and "none"
debug (bool) : Turns on/off debug label
Returns: A cancel short alert command
newsltpbuystop(licenseID, sl, tp, symbol, accfilter, comment, secret, freq, debug)
Updates the stop loss and/or take profit of any pending buy stop orders on the given symbol. Required params: licenseID, sl and/or tp.
Parameters:
licenseID (string) : Your PC license ID
sl (float) : Stop loss pips or price (according to EA settings)
tp (float) : Take profit pips or price (according to EA settings)
symbol (string) : Symbol to act on (defaults to current symbol)
accfilter (float) : Optional minimum account balance filter
comment (string) : Optional comment to include (max 20 characters)
secret (string) : Optional secret key (must be enabled in dashboard)
freq (string) : Alert frequency. Default = "all", options = "once_per_bar", "once_per_bar_close" and "none"
debug (bool) : Turns on/off debug label
Returns: The required alert syntax as a string
newsltpbuylimit(licenseID, sl, tp, symbol, accfilter, comment, secret, freq, debug)
Updates the stop loss and/or take profit of any pending buy limit orders on the given symbol. Required params: licenseID, sl and/or tp.
Parameters:
licenseID (string) : Your PC license ID
sl (float) : Stop loss pips or price (according to EA settings)
tp (float) : Take profit pips or price (according to EA settings)
symbol (string) : Symbol to act on (defaults to current symbol)
accfilter (float) : Optional minimum account balance filter
comment (string) : Optional comment to include (max 20 characters)
secret (string) : Optional secret key (must be enabled in dashboard)
freq (string) : Alert frequency. Default = "all", options = "once_per_bar", "once_per_bar_close" and "none"
debug (bool) : Turns on/off debug label
Returns: The required alert syntax as a string
newsltpsellstop(licenseID, sl, tp, symbol, accfilter, comment, secret, freq, debug)
Updates the stop loss and/or take profit of any pending sell stop orders on the given symbol. Required params: licenseID, sl and/or tp.
Parameters:
licenseID (string) : Your PC license ID
sl (float) : Stop loss pips or price (according to EA settings)
tp (float) : Take profit pips or price (according to EA settings)
symbol (string) : Symbol to act on (defaults to current symbol)
accfilter (float) : Optional minimum account balance filter
comment (string) : Optional comment to include (max 20 characters)
secret (string) : Optional secret key (must be enabled in dashboard)
freq (string) : Alert frequency. Default = "all", options = "once_per_bar", "once_per_bar_close" and "none"
debug (bool) : Turns on/off debug label
Returns: The required alert syntax as a string
newsltpselllimit(licenseID, sl, tp, symbol, accfilter, comment, secret, freq, debug)
Updates the stop loss and/or take profit of any pending sell limit orders on the given symbol. Required params: licenseID, sl and/or tp.
Parameters:
licenseID (string) : Your PC license ID
sl (float) : Stop loss pips or price (according to EA settings)
tp (float) : Take profit pips or price (according to EA settings)
symbol (string) : Symbol to act on (defaults to current symbol)
accfilter (float) : Optional minimum account balance filter
comment (string) : Optional comment to include (max 20 characters)
secret (string) : Optional secret key (must be enabled in dashboard)
freq (string) : Alert frequency. Default = "all", options = "once_per_bar", "once_per_bar_close" and "none"
debug (bool) : Turns on/off debug label
Returns: The required alert syntax as a string
eaoff(licenseID, secret, freq, debug)
Turns the EA off. Required params: licenseID.
Parameters:
licenseID (string) : Your PC license ID
secret (string) : Optional secret key (must be enabled in dashboard)
freq (string) : Alert frequency. Default = "all", options = "once_per_bar", "once_per_bar_close" and "none"
debug (bool) : Turns on/off debug label
Returns: The required alert syntax as a string
eaon(licenseID, secret, freq, debug)
Turns the EA on. Required params: licenseID.
Parameters:
licenseID (string) : Your PC license ID
secret (string) : Optional secret key (must be enabled in dashboard)
freq (string) : Alert frequency. Default = "all", options = "once_per_bar", "once_per_bar_close" and "none"
debug (bool) : Turns on/off debug label
Returns: The required alert syntax as a string
Prometheus Fractal WaveThe Fractal Wave is an indicator that uses a fractal analysis to determine where reversals may happen. This is done through a Fractal process, making sure a price point is in a certain set and then getting a Distance metric.
Calculation:
A bullish Fractal is defined by the current bar’s high being less than the last bar’s high, and the last bar’s high being greater than the second to last bar’s high, and the last bar’s high being greater than the third to last bar’s high.
A bearish Fractal is defined by the current low being greater than the last bar’s low, and the last bar’s low being less than the second to last bar’s low, and the last bar’s low being less than the third to last bar’s low.
When there is that bullish or bearish fractal the value we store is either the last bar’s high or low respective to bullish or bearish fractal.
Once we have that value stored we either subtract the last bar’s low from the bullish Fractal value, and subtract the last bar’s high from the bearish Fractal value. Those are our Distances.
Code:
isBullishFractal() =>
high > high and high < high and high > high
isBearishFractal() =>
low < low and low > low and low < low
var float lastBullishFractal = na
var float lastBearishFractal = na
if isBullishFractal() and barstate.isconfirmed
lastBullishFractal := high
if isBearishFractal() and barstate.isconfirmed
lastBearishFractal := low
//------------------------------
//-------CACLULATION------------
//------------------------------
bullWaveDistance = na(lastBullishFractal) ? na : lastBullishFractal - low
bearWaveDistance = na(lastBearishFractal) ? na : high - lastBearishFractal
We then plot the bullish distance and the negative bearish distance.
The trade scenarios come from when one breaks the zero line and then goes back above or below. So if the last bullish distance was below 0 and is now above, or if the last negative bearish distance was above 0 and now below. We plot a green label below a candle for a bullish scenario, or a red label above a candle for a bearish one, you can turn them on or off.
Code:
plot(bullWaveDistance, color=color.green, title="Bull Wave Distance", linewidth=2)
plot(-bearWaveDistance, color=color.red, title="Bear Wave Distance", linewidth=2)
plot(0, "Zero Line", color=color.gray, display = display.pane)
bearish_reversal = plot_labels ? bullWaveDistance < 0 and bullWaveDistance > 0 : na
bullish_reversal = plot_labels ? -bearWaveDistance > 0 and -bearWaveDistance < 0 : na
plotshape(bullish_reversal, location=location.belowbar, color=color.green, style=shape.labelup, title="Bullish Fractal", text="↑", display = display.all - display.status_line, force_overlay = true)
plotshape(bearish_reversal, location=location.abovebar, color=color.red, style=shape.labeldown, title="Bearish Fractal", text="↓", display = display.all - display.status_line, force_overlay = true)
We can see in this daily NASDAQ:QQQ chart that the indicator gives us marks that can either be used as Reversal signals or as breathers in the trend.
Since it is designed to provide reversals, on something like Gold where the uptrend has been strong, the signals may be just short breathers, not full blown strong reversal signs.
The indicator works just as well intra day as it does on larger timeframes.
We encourage traders to not follow indicators blindly, none are 100% accurate. Please comment on any desired updates, all criticism is welcome!
Uptrick: DPO Signal & Zone Indicator
## **Uptrick: DPO Signal & Zone Indicator**
### **Introduction:**
The **Uptrick: DPO Signal & Zone Indicator** is a sophisticated technical analysis tool tailored to provide insights into market momentum, identify potential trading signals, and recognize extreme market conditions. It leverages the Detrended Price Oscillator (DPO) to strip out long-term trends from price movements, allowing traders to focus on short-term fluctuations and cyclical behavior. The indicator integrates multiple components, including a Detrended Price Oscillator, a Signal Line, a Histogram, and customizable alert levels, to deliver a robust framework for market analysis and trading decision-making.
### **Detailed Breakdown:**
#### **1. Detrended Price Oscillator (DPO):**
- **Purpose and Functionality:**
- The DPO is designed to filter out long-term trends from the price data, isolating short-term price movements. This helps in understanding the cyclical patterns and momentum of an asset, allowing traders to detect periods of acceleration or deceleration that might be overlooked when focusing solely on long-term trends.
- **Calculation:**
- **Formula:** `dpo = close - ta.sma(close, smaLength)`
- **`close`:** The asset’s closing price for each period in the dataset.
- **`ta.sma(close, smaLength)`:** The Simple Moving Average (SMA) of the closing prices over a period defined by `smaLength`.
- The DPO is derived by subtracting the SMA value from the current closing price. This calculation reveals how much the current price deviates from the moving average, effectively detrending the price data.
- **Interpretation:**
- **Positive DPO Values:** Indicate that the current price is higher than the moving average, suggesting bullish market conditions and a potential upward trend.
- **Negative DPO Values:** Indicate that the current price is lower than the moving average, suggesting bearish market conditions and a potential downward trend.
- **Magnitude of DPO:** Reflects the strength of momentum. Larger positive or negative values suggest stronger momentum in the respective direction.
#### **2. Signal Line:**
- **Purpose and Functionality:**
- The Signal Line is a smoothed average of the DPO, intended to act as a reference point for generating trading signals. It helps to filter out short-term fluctuations and provides a clearer perspective on the prevailing trend.
- **Calculation:**
- **Formula:** `signalLine = ta.sma(dpo, signalLength)`
- **`ta.sma(dpo, signalLength)`:** The SMA of the DPO values over a period defined by `signalLength`.
- The Signal Line is calculated by applying a moving average to the DPO values. This smoothing process reduces noise and highlights the underlying trend direction.
- **Interpretation:**
- **DPO Crossing Above Signal Line:** Generates a buy signal, suggesting that short-term momentum is turning bullish relative to the longer-term trend.
- **DPO Crossing Below Signal Line:** Generates a sell signal, suggesting that short-term momentum is turning bearish relative to the longer-term trend.
- **Signal Line’s Role:** Provides a benchmark for assessing the strength of the DPO. The interaction between the DPO and the Signal Line offers actionable insights into potential entry or exit points.
#### **3. Histogram:**
- **Purpose and Functionality:**
- The Histogram visualizes the difference between the DPO and the Signal Line. It provides a graphical representation of momentum strength and direction, allowing traders to quickly gauge market conditions.
- **Calculation:**
- **Formula:** `histogram = dpo - signalLine`
- The Histogram is computed by subtracting the Signal Line value from the DPO value. Positive values indicate that the DPO is above the Signal Line, while negative values indicate that the DPO is below the Signal Line.
- **Interpretation:**
- **Color Coding:**
- **Green Bars:** Represent positive values, indicating bullish momentum.
- **Red Bars:** Represent negative values, indicating bearish momentum.
- **Width of Bars:** Indicates the strength of momentum. Wider bars signify stronger momentum, while narrower bars suggest weaker momentum.
- **Zero Line:** A horizontal gray line that separates positive and negative histogram values. Crosses of the histogram through this zero line can signal shifts in momentum direction.
#### **4. Alert Levels:**
- **Purpose and Functionality:**
- Alert levels define specific thresholds to identify extreme market conditions, such as overbought and oversold states. These levels help traders recognize potential reversal points and extreme market conditions.
- **Inputs:**
- **`alertLevel1`:** Defines the upper threshold for identifying overbought conditions.
- **Default Value:** 0.5
- **`alertLevel2`:** Defines the lower threshold for identifying oversold conditions.
- **Default Value:** -0.5
- **Interpretation:**
- **Overbought Condition:** When the DPO exceeds `alertLevel1`, indicating that the market may be overbought. This condition suggests that the asset could be due for a correction or reversal.
- **Oversold Condition:** When the DPO falls below `alertLevel2`, indicating that the market may be oversold. This condition suggests that the asset could be poised for a rebound or reversal.
#### **5. Visual Elements:**
- **DPO and Signal Line Plots:**
- **DPO Plot:**
- **Color:** Blue
- **Width:** 2 pixels
- **Purpose:** To visually represent the deviation of the current price from the moving average.
- **Signal Line Plot:**
- **Color:** Red
- **Width:** 1 pixel
- **Purpose:** To provide a smoothed reference for the DPO and generate trading signals.
- **Histogram Plot:**
- **Color Coding:**
- **Green:** For positive values, signaling bullish momentum.
- **Red:** For negative values, signaling bearish momentum.
- **Style:** Histogram bars are displayed with varying width to represent the strength of momentum.
- **Zero Line:** A gray horizontal line separating positive and negative histogram values.
- **Overbought/Oversold Zones:**
- **Background Colors:**
- **Green Shading:** Applied when the DPO exceeds `alertLevel1`, indicating an overbought condition.
- **Red Shading:** Applied when the DPO falls below `alertLevel2`, indicating an oversold condition.
- **Horizontal Lines:**
- **Dotted Green Line:** At `alertLevel1`, marking the upper alert threshold.
- **Dotted Red Line:** At `alertLevel2`, marking the lower alert threshold.
- **Purpose:** To provide clear visual cues for extreme market conditions, aiding in the identification of potential reversal points.
#### **6. Trading Signals and Alerts:**
- **Buy Signal:**
- **Trigger:** When the DPO crosses above the Signal Line.
- **Visual Representation:** A "BUY" label appears below the price bar in the specified buy color.
- **Purpose:** Indicates a potential buying opportunity as short-term momentum turns bullish.
- **Sell Signal:**
- **Trigger:** When the DPO crosses below the Signal Line.
- **Visual Representation:** A "SELL" label appears above the price bar in the specified sell color.
- **Purpose:** Indicates a potential selling opportunity as short-term momentum turns bearish.
- **Overbought/Oversold Alerts:**
- **Overbought Alert:** Triggered when the DPO crosses below `alertLevel1`.
- **Oversold Alert:** Triggered when the DPO crosses above `alertLevel2`.
- **Visual Representation:** Labels "OVERBOUGHT" and "OVERSOLD" appear with distinctive colors and sizes to highlight extreme conditions.
- **Purpose:** To signal potential reversal points and extreme market conditions that may lead to price corrections or trend reversals.
- **Alert Conditions:**
- **DPO Cross Above Signal Line:** Alerts traders when the DPO crosses above the Signal Line, generating a buy signal.
- **DPO Cross Below Signal Line:** Alerts traders when the DPO crosses below the Signal Line, generating a sell signal.
- **DPO Above Upper Alert Level:** Alerts when the DPO is above `alertLevel1`, indicating an overbought condition.
- **DPO Below Lower Alert Level:** Alerts when the DPO is below `alertLevel2`, indicating an oversold condition.
- **Purpose:** To provide real-time notifications of significant market events, enabling traders to make informed decisions promptly.
### **Practical Applications:**
#### **1. Trend Following Strategies:**
- **Objective:**
- To capture and ride the prevailing market trends by entering trades that align with the direction of the momentum.
- **How to Use:**
- Monitor buy and sell signals generated by the DPO crossing the Signal Line. A buy signal suggests a bullish trend and a potential long trade, while a sell signal suggests a bearish trend and a potential short trade.
- Use the Histogram to confirm the strength of the trend. Expanding green bars indicate strong bullish momentum, while expanding red bars indicate strong bearish momentum.
- **Advantages:**
- Helps traders stay aligned with the market trend, increasing the likelihood of capturing substantial price moves.
#### **2. Reversal Trading:**
- **Objective:**
- To identify potential market reversals
by detecting overbought and oversold conditions.
- **How to Use:**
- Look for overbought and oversold signals based on the DPO crossing `alertLevel1` and `alertLevel2`. These conditions suggest that the market may be due for a reversal.
- Confirm reversal signals with the Histogram. A decrease in histogram bars (from green to red or vice versa) may support the reversal hypothesis.
- **Advantages:**
- Provides early warnings of potential market reversals, allowing traders to position themselves before significant price changes occur.
#### **3. Momentum Analysis:**
- **Objective:**
- To gauge the strength and direction of market momentum for making informed trading decisions.
- **How to Use:**
- Analyze the Histogram to assess momentum strength. Positive and expanding histogram bars indicate increasing bullish momentum, while negative and expanding bars suggest increasing bearish momentum.
- Use momentum insights to validate or question existing trading positions and strategies.
- **Advantages:**
- Offers valuable information about the market's momentum, helping traders confirm the validity of trends and trading signals.
### **Customization and Flexibility:**
The **Uptrick: DPO Signal & Zone Indicator** offers extensive customization options to accommodate diverse trading preferences and market conditions:
- **SMA Length and Signal Line Length:**
- Adjust the `smaLength` and `signalLength` parameters to control the sensitivity and responsiveness of the DPO and Signal Line. Shorter lengths make the indicator more responsive to price changes, while longer lengths provide smoother, less volatile signals.
- **Alert Levels:**
- Modify `alertLevel1` and `alertLevel2` to fit varying market conditions and volatility. Setting these levels appropriately helps tailor the indicator to different asset classes and trading strategies.
- **Color and Shape Customization:**
- Customize the colors and sizes of buy/sell signals, histogram bars, and alert levels to enhance visual clarity and align with personal preferences. This customization helps ensure that the indicator integrates seamlessly with a trader's charting setup.
### **Conclusion:**
The **Uptrick: DPO Signal & Zone Indicator** is a multifaceted analytical tool that combines the power of the Detrended Price Oscillator with customizable visual elements and alert levels to deliver a comprehensive approach to market analysis. By offering insights into momentum strength, trend direction, and potential reversal points, this indicator equips traders with valuable information to make informed decisions and enhance their trading strategies. Its flexibility and customization options ensure that it can be adapted to various trading styles and market conditions, making it a versatile addition to any trader's toolkit.
Uptrick: RSI Histogram
1. **Introduction to the RSI and Moving Averages**
2. **Detailed Breakdown of the Uptrick: RSI Histogram**
3. **Calculation and Formula**
4. **Visual Representation**
5. **Customization and User Settings**
6. **Trading Strategies and Applications**
7. **Risk Management**
8. **Case Studies and Examples**
9. **Comparison with Other Indicators**
10. **Advanced Usage and Tips**
---
## 1. Introduction to the RSI and Moving Averages
### **1.1 Relative Strength Index (RSI)**
The Relative Strength Index (RSI) is a momentum oscillator developed by J. Welles Wilder and introduced in his 1978 book "New Concepts in Technical Trading Systems." It is widely used in technical analysis to measure the speed and change of price movements.
**Purpose of RSI:**
- **Identify Overbought/Oversold Conditions:** RSI values range from 0 to 100. Traditionally, values above 70 are considered overbought, while values below 30 are considered oversold. These thresholds help traders identify potential reversal points in the market.
- **Trend Strength Measurement:** RSI also indicates the strength of a trend. High RSI values suggest strong bullish momentum, while low values indicate bearish momentum.
**Calculation of RSI:**
1. **Calculate the Average Gain and Loss:** Over a specified period (e.g., 14 days), calculate the average gain and loss.
2. **Compute the Relative Strength (RS):** RS is the ratio of average gain to average loss.
3. **RSI Formula:** RSI = 100 - (100 / (1 + RS))
### **1.2 Moving Averages (MA)**
Moving Averages are used to smooth out price data and identify trends by filtering out short-term fluctuations. Two common types are:
**Simple Moving Average (SMA):** The average of prices over a specified number of periods.
**Exponential Moving Average (EMA):** A type of moving average that gives more weight to recent prices, making it more responsive to recent price changes.
**Smoothed Moving Average (SMA):** Used to reduce the impact of volatility and provide a clearer view of the underlying trend. The RMA, or Running Moving Average, used in the USH script is similar to an EMA but based on the average of RSI values.
## 2. Detailed Breakdown of the Uptrick: RSI Histogram
### **2.1 Indicator Overview**
The Uptrick: RSI Histogram (USH) is a technical analysis tool that combines the RSI with a moving average to create a histogram that reflects momentum and trend strength.
**Key Components:**
- **RSI Calculation:** Determines the relative strength of price movements.
- **Moving Average Application:** Smooths the RSI values to provide a clearer trend indication.
- **Histogram Plotting:** Visualizes the deviation of the smoothed RSI from a neutral level.
### **2.2 Indicator Purpose**
The primary purpose of the USH is to provide a clear visual representation of the market's momentum and trend strength. It helps traders identify:
- **Bullish and Bearish Trends:** By showing how far the smoothed RSI is from the neutral 50 level.
- **Potential Reversal Points:** By highlighting changes in momentum.
### **2.3 Indicator Design**
**RSI Moving Average (RSI MA):** The RSI MA is a smoothed version of the RSI, calculated using a running moving average. This smooths out short-term fluctuations and provides a clearer indication of the underlying trend.
**Histogram Calculation:**
- **Neutral Level:** The histogram is plotted relative to the neutral level of 50. This level represents a balanced market where neither bulls nor bears have dominance.
- **Histogram Values:** The histogram bars show the difference between the RSI MA and the neutral level. Positive values indicate bullish momentum, while negative values indicate bearish momentum.
## 3. Calculation and Formula
### **3.1 RSI Calculation**
The RSI calculation involves:
1. **Average Gain and Loss:** Calculated over the specified length (e.g., 14 periods).
2. **Relative Strength (RS):** RS = Average Gain / Average Loss.
3. **RSI Formula:** RSI = 100 - (100 / (1 + RS)).
### **3.2 Moving Average Calculation**
For the USH indicator, the RSI is smoothed using a running moving average (RMA). The RMA formula is similar to that of the EMA but is based on averaging RSI values over the specified length.
### **3.3 Histogram Calculation**
The histogram value is calculated as:
- **Histogram Value = RSI MA - 50**
**Plotting the Histogram:**
- **Positive Histogram Values:** Indicate that the RSI MA is above the neutral level, suggesting bullish momentum.
- **Negative Histogram Values:** Indicate that the RSI MA is below the neutral level, suggesting bearish momentum.
## 4. Visual Representation
### **4.1 Histogram Bars**
The histogram is plotted as bars on the chart:
- **Bullish Bars:** Colored green when the RSI MA is above 50.
- **Bearish Bars:** Colored red when the RSI MA is below 50.
### **4.2 Customization Options**
Traders can customize:
- **RSI Length:** Adjust the length of the RSI calculation to match their trading style.
- **Bull and Bear Colors:** Choose colors for histogram bars to enhance visual clarity.
### **4.3 Interpretation**
**Bullish Signal:** A histogram bar that moves from red to green indicates a potential shift to a bullish trend.
**Bearish Signal:** A histogram bar that moves from green to red indicates a potential shift to a bearish trend.
## 5. Customization and User Settings
### **5.1 Adjusting RSI Length**
The length parameter determines the number of periods over which the RSI is calculated and smoothed. Shorter lengths make the RSI more sensitive to price changes, while longer lengths provide a smoother view of trends.
### **5.2 Color Settings**
Traders can adjust:
- **Bull Color:** Color of histogram bars indicating bullish momentum.
- **Bear Color:** Color of histogram bars indicating bearish momentum.
**Customization Benefits:**
- **Visual Clarity:** Traders can choose colors that stand out against their chart’s background.
- **Personal Preference:** Adjust settings to match individual trading styles and preferences.
## 6. Trading Strategies and Applications
### **6.1 Trend Following**
**Identifying Entry Points:**
- **Bullish Entry:** When the histogram changes from red to green, it signals a potential entry point for long positions.
- **Bearish Entry:** When the histogram changes from green to red, it signals a potential entry point for short positions.
**Trend Confirmation:** The histogram helps confirm the strength of a trend. Strong, consistent green bars indicate robust bullish momentum, while strong, consistent red bars indicate robust bearish momentum.
### **6.2 Swing Trading**
**Momentum Analysis:**
- **Entry Signals:** Look for significant shifts in the histogram to time entries. A shift from bearish to bullish (red to green) indicates potential for upward movement.
- **Exit Signals:** A shift from bullish to bearish (green to red) suggests a potential weakening of the trend, signaling an exit or reversal point.
### **6.3 Range Trading**
**Market Conditions:**
- **Consolidation:** The histogram close to zero suggests a range-bound market. Traders can use this information to identify support and resistance levels.
- **Breakout Potential:** A significant move away from the neutral level may indicate a potential breakout from the range.
### **6.4 Risk Management**
**Stop-Loss Placement:**
- **Bullish Positions:** Place stop-loss orders below recent support levels when the histogram is green.
- **Bearish Positions:** Place stop-loss orders above recent resistance levels when the histogram is red.
**Position Sizing:** Adjust position sizes based on the strength of the histogram signals. Strong trends (indicated by larger histogram bars) may warrant larger positions, while weaker signals suggest smaller positions.
## 7. Risk Management
### **7.1 Importance of Risk Management**
Effective risk management is crucial for long-term trading success. It involves protecting capital, managing losses, and optimizing trade setups.
### **7.2 Using USH for Risk Management**
**Stop-Loss and Take-Profit Levels:**
- **Stop-Loss Orders:** Use the histogram to set stop-loss levels based on trend strength. For instance, place stops below support levels in bullish trends and above resistance levels in bearish trends.
- **Take-Profit Targets:** Adjust take-profit levels based on histogram changes. For example, lock in profits as the histogram starts to shift from green to red.
**Position Sizing:**
- **Trend Strength:** Scale position sizes based on the strength of histogram signals. Larger histogram bars indicate stronger trends, which may justify larger positions.
- **Volatility:** Consider market volatility and adjust position sizes to mitigate risk.
## 8. Case Studies and Examples
### **8.1 Example 1: Bullish Trend**
**Scenario:** A trader notices a transition from red to green histogram bars.
**Analysis:**
- **Entry Point:** The transition indicates a potential bullish trend. The trader decides to enter a long position.
- **Stop-Loss:** Set stop-loss below recent support levels.
- **Take-Profit:** Consider taking profits as the histogram moves back towards zero or turns red.
**Outcome:** The bullish trend continues, and the histogram remains green, providing a profitable trade setup.
### **8.2 Example 2: Bearish Trend**
**Scenario:** A trader observes a transition from green to red histogram bars.
**Analysis:**
- **Entry Point:** The transition suggests a potential
bearish trend. The trader decides to enter a short position.
- **Stop-Loss:** Set stop-loss above recent resistance levels.
- **Take-Profit:** Consider taking profits as the histogram approaches zero or shifts to green.
**Outcome:** The bearish trend continues, and the histogram remains red, resulting in a successful trade.
## 9. Comparison with Other Indicators
### **9.1 RSI vs. USH**
**RSI:** Measures momentum and identifies overbought/oversold conditions.
**USH:** Builds on RSI by incorporating a moving average and histogram to provide a clearer view of trend strength and momentum.
### **9.2 RSI vs. MACD**
**MACD (Moving Average Convergence Divergence):** A trend-following momentum indicator that uses moving averages to identify changes in trend direction.
**Comparison:**
- **USH:** Provides a smoothed RSI perspective and visual histogram for trend strength.
- **MACD:** Offers signals based on the convergence and divergence of moving averages.
### **9.3 RSI vs. Stochastic Oscillator**
**Stochastic Oscillator:** Measures the level of the closing price relative to the high-low range over a specified period.
**Comparison:**
- **USH:** Focuses on smoothed RSI values and histogram representation.
- **Stochastic Oscillator:** Provides overbought/oversold signals and potential reversals based on price levels.
## 10. Advanced Usage and Tips
### **10.1 Combining Indicators**
**Multi-Indicator Strategies:** Combine the USH with other technical indicators (e.g., Moving Averages, Bollinger Bands) for a comprehensive trading strategy.
**Confirmation Signals:** Use the USH to confirm signals from other indicators. For instance, a bullish histogram combined with a moving average crossover may provide a stronger buy signal.
### **10.2 Customization Tips**
**Adjust RSI Length:** Experiment with different RSI lengths to match various market conditions and trading styles.
**Color Preferences:** Choose histogram colors that enhance visibility and align with personal preferences.
### **10.3 Continuous Learning**
**Backtesting:** Regularly backtest the USH with historical data to refine strategies and improve accuracy.
**Education:** Stay updated with trading education and adapt strategies based on market changes and personal experiences.
Scalping with Williams %R, MACD, and SMA (1m)Overview:
This trading strategy is designed for scalping in the 1-minute timeframe. It uses a combination of the Williams %R, MACD, and SMA indicators to generate buy and sell signals. It also includes alert functionalities to notify users when trades are executed or closed.
Indicators Used:
Williams %R : A momentum indicator that measures overbought and oversold conditions. The Williams %R values range from -100 to 0.
Length: 140 bars (i.e., 140-period).
MACD (Moving Average Convergence Divergence) : A trend-following momentum indicator that shows the relationship between two moving averages of a security's price.
Fast Length: 24 bars
Slow Length: 52 bars
MACD Length: 9 bars (signal line)
SMA (Simple Moving Average) : A trend-following indicator that smooths out price data to create a trend-following indicator.
Length: 7 bars
Conditions and Logic:
Timeframe Check :
The strategy is designed specifically for the 1-minute timeframe. If the current chart is not on the 1-minute timeframe, a warning label is displayed on the chart instructing the user to switch to the 1-minute timeframe.
Williams %R Conditions :
Buy Condition: The strategy looks for a crossover of Williams %R from below -94 to above -94. This indicates a potential buying opportunity when the market is moving out of an oversold condition.
Sell Condition: The strategy looks for a crossunder of Williams %R from above -6 to below -6. This indicates a potential selling opportunity when the market is moving out of an overbought condition.
Deactivate Buy: If Williams %R crosses above -40, the buy signal is deactivated, suggesting that the buying condition is no longer valid.
Deactivate Sell: If Williams %R crosses below -60, the sell signal is deactivated, suggesting that the selling condition is no longer valid.
MACD Conditions :
MACD Histogram: Used to identify the momentum and the direction of the trend.
Long Entry: The strategy initiates a buy order if the MACD histogram shows a positive bar after a negative bar while a buy condition is active and Williams %R is above -94.
Long Exit: The strategy exits the buy position if the MACD histogram turns negative and is below the previous histogram bar.
Short Entry: The strategy initiates a sell order if the MACD histogram shows a negative bar after a positive bar while a sell condition is active and Williams %R is below -6.
Short Exit: The strategy exits the sell position if the MACD histogram turns positive and is above the previous histogram bar.
Trend Confirmation (Using SMA) :
Bullish Trend: The strategy considers a bullish trend if the current price is above the 7-bar SMA. A buy signal is only considered if this condition is met.
Bearish Trend: The strategy considers a bearish trend if the current price is below the 7-bar SMA. A sell signal is only considered if this condition is met.
Alerts:
Long Entry Alert: An alert is triggered when a buy order is executed.
Long Exit Alert: An alert is triggered when the buy order is closed.
Short Entry Alert: An alert is triggered when a sell order is executed.
Short Exit Alert: An alert is triggered when the sell order is closed.
Summary:
Buy Signal: Activated when Williams %R crosses above -94 and the price is above the 7-bar SMA. A buy order is placed if the MACD histogram shows a positive bar after a negative bar. The buy order is closed when the MACD histogram turns negative and is below the previous histogram bar.
Sell Signal: Activated when Williams %R crosses below -6 and the price is below the 7-bar SMA. A sell order is placed if the MACD histogram shows a negative bar after a positive bar. The sell order is closed when the MACD histogram turns positive and is above the previous histogram bar.
This strategy combines momentum (Williams %R), trend-following (MACD), and trend confirmation (SMA) to identify trading opportunities in the 1-minute timeframe. It is designed for short-term trading or scalping.
4C Data Table SuiteOverview
The 4C Data Table Suite is a versatile TradingView indicator, designed for traders who focus on the critical role of prior bar levels in their strategy. By highlighting the high and low points of previous bars, this tool aids in pinpointing crucial support and resistance zones, which often act as psychological triggers for market participants. The unique feature of this indicator is its dual-color coding: it colors bars green for bullish closes and red for bearish closes in the Prior Bar Table, and for the current timeframe, it highlights whether the current price is above (green) or below (red) these levels.
Concepts
1 — This sophisticated indicator is not just about visual cues; it provides a rich tableau of data including:
• Current timeframe countdown to bar close
• GMT-adjusted clock for precise trade timing
• Real-time updates on market internals and volatility measures such as the NYSE TICK and ATR
2 — The configuration is highly customizable, allowing users to:
• Adjust the table's positioning and text size
• Choose color settings for text, background, and borders to suit their visual preference
• Toggle the display of various data components based on their trading needs
3 — The Prior Bar Table is particularly valuable for:
• Traders using prior bar levels as triggers for trade entries and exits
• Quick visual assessment of market sentiment
• Real-time decision-making supported by dynamic color coding based on current price movements relative to prior highs and lows
Features
• Prior Bar Levels Table: Visualizes high and low levels of prior bars with intuitive color coding, aiding traders in assessing market trends.
• Dynamic Color Coding: Updates colors based on the closure of the previous bar and current price positions relative to the past bar's highs and lows.
• Comprehensive Market Data: Includes a suite of essential data such as market internals, the prior bar’s range, and the latest price information.
• Customizable Visuals: Offers extensive options for customizing the appearance and data presented, ensuring the tool fits seamlessly into any trader's strategy.
How to Use
1. To add the indicator, search for "4C Data Table Suite" under indicators on TradingView and apply it to your chart.
2. Navigate to the indicator settings to customize the display properties, including table position, color schemes, and which data points to display.
3. Utilize the toggles within the "Prior Bar Levels Table" settings to adjust the visibility and behavior of the table, depending on your trading approach.
Limitations
• This indicator is optimized for use on time-based charts and may not perform as intended on tick charts or non-standard timeframes.
• The color coding is based on the closure of bars, which may not always reflect intrabar movements, potentially affecting real-time decision-making in highly volatile markets.
Notes
• Ensure your TradingView interface is set to the correct timezone settings to align the GMT clock accurately.
• The dynamic color updates are designed to provide at-a-glance insights but should be used in conjunction with other analysis tools for best results.
*If you find that the indicator is blocking some of the candles at the bottom of the screen, go to (Chart) Settings, Canvas, and then adjust the Bottom/Top margin by increasing the % Amount.
Thanks
Special thanks to the TradingView community and developers whose feedback and insights have helped refine the functionalities of the 4C Data Table Suite. Your collaborative spirit is what makes continuous improvement possible.
QuasimodoThis indicator helps traders spot certain patterns on a price chart that might indicate a change in price direction. These patterns are known as "engulfing patterns."
How It Works1.
Bullish Engulfing Patterns:- The current bar (or candle) closes higher than it opens (it's a green or white candle).- The previous bar closed lower than it opened (it was a red or black candle).- The current bar's high is higher than the previous bar's high, and its low is lower than the previous bar's low.- There's another variation where both the current and previous bars are green, but the current bar is still higher and lower than the previous one.
2. Bearish Engulfing Patterns:- The current bar closes lower than it opens (it's a red or black candle).- The previous bar closed higher than it opened (it was a green or white candle).- The current bar's low is lower than the previous bar's low, and its high is higher than the previous bar's high.- There's another variation where both the current and previous bars are red, but the current bar is still higher and lower than the previous one.
What It Shows-
When the indicator spots one of these patterns, it colors the previous candle:-
Yellow for a bullish pattern (price might go up).-
Pink for a bearish pattern (price might go down).
Alerts- The indicator can also send an alert to let you know when it finds one of these patterns, so you don't miss it.
Adaptive Trend Classification: Moving Averages [InvestorUnknown]Adaptive Trend Classification: Moving Averages
Overview
The Adaptive Trend Classification (ATC) Moving Averages indicator is a robust and adaptable investing tool designed to provide dynamic signals based on various types of moving averages and their lengths. This indicator incorporates multiple layers of adaptability to enhance its effectiveness in various market conditions.
Key Features
Adaptability of Moving Average Types and Lengths: The indicator utilizes different types of moving averages (EMA, HMA, WMA, DEMA, LSMA, KAMA) with customizable lengths to adjust to market conditions.
Dynamic Weighting Based on Performance: ] Weights are assigned to each moving average based on the equity they generate, with considerations for a cutout period and decay rate to manage (reduce) the influence of past performances.
Exponential Growth Adjustment: The influence of recent performance is enhanced through an adjustable exponential growth factor, ensuring that more recent data has a greater impact on the signal.
Calibration Mode: Allows users to fine-tune the indicator settings for specific signal periods and backtesting, ensuring optimized performance.
Visualization Options: Multiple customization options for plotting moving averages, color bars, and signal arrows, enhancing the clarity of the visual output.
Alerts: Configurable alert settings to notify users based on specific moving average crossovers or the average signal.
User Inputs
Adaptability Settings
λ (Lambda): Specifies the growth rate for exponential growth calculations.
Decay (%): Determines the rate of depreciation applied to the equity over time.
CutOut Period: Sets the period after which equity calculations start, allowing for a focus on specific time ranges.
Robustness Lengths: Defines the range of robustness for equity calculation with options for Narrow, Medium, or Wide adjustments.
Long/Short Threshold: Sets thresholds for long and short signals.
Calculation Source: The data source used for calculations (e.g., close price).
Moving Averages Settings
Lengths and Weights: Allows customization of lengths and initial weights for each moving average type (EMA, HMA, WMA, DEMA, LSMA, KAMA).
Calibration Mode
Calibration Mode: Enables calibration for fine-tuning inputs.
Calibrate: Specifies which moving average type to calibrate.
Strategy View: Shifts entries and exits by one bar for non-repainting backtesting.
Calculation Logic
Rate of Change (R): Calculates the rate of change in the price.
Set of Moving Averages: Generates multiple moving averages with different lengths for each type.
diflen(length) =>
int L1 = na, int L_1 = na
int L2 = na, int L_2 = na
int L3 = na, int L_3 = na
int L4 = na, int L_4 = na
if robustness == "Narrow"
L1 := length + 1, L_1 := length - 1
L2 := length + 2, L_2 := length - 2
L3 := length + 3, L_3 := length - 3
L4 := length + 4, L_4 := length - 4
else if robustness == "Medium"
L1 := length + 1, L_1 := length - 1
L2 := length + 2, L_2 := length - 2
L3 := length + 4, L_3 := length - 4
L4 := length + 6, L_4 := length - 6
else
L1 := length + 1, L_1 := length - 1
L2 := length + 3, L_2 := length - 3
L3 := length + 5, L_3 := length - 5
L4 := length + 7, L_4 := length - 7
// Function to calculate different types of moving averages
ma_calculation(source, length, ma_type) =>
if ma_type == "EMA"
ta.ema(source, length)
else if ma_type == "HMA"
ta.sma(source, length)
else if ma_type == "WMA"
ta.wma(source, length)
else if ma_type == "DEMA"
ta.dema(source, length)
else if ma_type == "LSMA"
lsma(source,length)
else if ma_type == "KAMA"
kama(source, length)
else
na
// Function to create a set of moving averages with different lengths
SetOfMovingAverages(length, source, ma_type) =>
= diflen(length)
MA = ma_calculation(source, length, ma_type)
MA1 = ma_calculation(source, L1, ma_type)
MA2 = ma_calculation(source, L2, ma_type)
MA3 = ma_calculation(source, L3, ma_type)
MA4 = ma_calculation(source, L4, ma_type)
MA_1 = ma_calculation(source, L_1, ma_type)
MA_2 = ma_calculation(source, L_2, ma_type)
MA_3 = ma_calculation(source, L_3, ma_type)
MA_4 = ma_calculation(source, L_4, ma_type)
Exponential Growth Factor: Computes an exponential growth factor based on the current bar index and growth rate.
// The function `e(L)` calculates an exponential growth factor based on the current bar index and a given growth rate `L`.
e(L) =>
// Calculate the number of bars elapsed.
// If the `bar_index` is 0 (i.e., the very first bar), set `bars` to 1 to avoid division by zero.
bars = bar_index == 0 ? 1 : bar_index
// Define the cuttime time using the `cutout` parameter, which specifies how many bars will be cut out off the time series.
cuttime = time
// Initialize the exponential growth factor `x` to 1.0.
x = 1.0
// Check if `cuttime` is not `na` and the current time is greater than or equal to `cuttime`.
if not na(cuttime) and time >= cuttime
// Use the mathematical constant `e` raised to the power of `L * (bar_index - cutout)`.
// This represents exponential growth over the number of bars since the `cutout`.
x := math.pow(math.e, L * (bar_index - cutout))
x
Equity Calculation: Calculates the equity based on starting equity, signals, and the rate of change, incorporating a natural decay rate.
pine code
// This function calculates the equity based on the starting equity, signals, and rate of change (R).
eq(starting_equity, sig, R) =>
cuttime = time
if not na(cuttime) and time >= cuttime
// Calculate the rate of return `r` by multiplying the rate of change `R` with the exponential growth factor `e(La)`.
r = R * e(La)
// Calculate the depreciation factor `d` as 1 minus the depreciation rate `De`.
d = 1 - De
var float a = 0.0
// If the previous signal `sig ` is positive, set `a` to `r`.
if (sig > 0)
a := r
// If the previous signal `sig ` is negative, set `a` to `-r`.
else if (sig < 0)
a := -r
// Declare the variable `e` to store equity and initialize it to `na`.
var float e = na
// If `e ` (the previous equity value) is not available (first calculation):
if na(e )
e := starting_equity
else
// Update `e` based on the previous equity value, depreciation factor `d`, and adjustment factor `a`.
e := (e * d) * (1 + a)
// Ensure `e` does not drop below 0.25.
if (e < 0.25)
e := 0.25
e
else
na
Signal Generation: Generates signals based on crossovers and computes a weighted signal from multiple moving averages.
Main Calculations
The indicator calculates different moving averages (EMA, HMA, WMA, DEMA, LSMA, KAMA) and their respective signals, applies exponential growth and decay factors to compute equities, and then derives a final signal by averaging weighted signals from all moving averages.
Visualization and Alerts
The final signal, along with additional visual aids like color bars and arrows, is plotted on the chart. Users can also set up alerts based on specific conditions to receive notifications for potential trading opportunities.
Repainting
The indicator does support intra-bar changes of signal but will not repaint once the bar is closed, if you want to get alerts only for signals after bar close, turn on “Strategy View” while setting up the alert.
Conclusion
The Adaptive Trend Classification: Moving Averages Indicator is a sophisticated tool for investors, offering extensive customization and adaptability to changing market conditions. By integrating multiple moving averages and leveraging dynamic weighting based on performance, it aims to provide reliable and timely investing signals.
Phaser [QuantVue]The Phaser indicator is a tool to help identify inflection points by looking at price relative to past prices across multiple timeframes and assets.
Phase 1 looks for the price to be higher or lower than the closing price of the bar 4 bars earlier and is complete when 9 consecutive bars meet this criterion.
A completed Phase 1 is considered perfect when the highs (bearish) or lows (bullish) have been exceeded from bars 6 and 7 of the phase.
A bullish setup requires 9 consecutive closes less than the close 4 bars earlier.
A bearish setup requires 9 consecutive closes greater than the close 4 bars earlier.
Phase 2 begins once Phase 1 has been completed. Phase 2 compares the current price to the high or low of two bars earlier.
Unlike Phase 1, Phase 2 does not require the count to be consecutive.
Phase 2 is considered complete when 13 candles have met the criteria.
An important aspect to Phase 2 is the relationship between bar 13 and bar 8.
To ensure the end of Phase 2 is in line with the existing trend, the high or low of bar 13 is compared to the close of bar 8.
A bullish imperfect 13 occurs when the current price is less than the low of 2 bars earlier, but the current low is greater than the close of bar 8 in Phase 2.
A bearish imperfect 13 occurs when the current price is greater than the high of 2 bars earlier, but the current high is less than the close of bar 8 in Phase 2.
Phase 2 does not need to go until it is complete. A Phase 2 can be canceled if the price closes above or below the highest or lowest price from Phase 1.
Settings
3 Tickers
3 Timeframes
Show Phase 1
Show Phase 2
User-selected colors