Sentiment Zone OscillatorHere's a (forgotten but still useful) Sentiment Zone Oscillator. The Sentiment Zone Oscillator takes a sum of positive price candles over a user-specified window length. Normally, a triple exponential moving average of the sum is used, but we opted to just go with a double EMA for the sake of more responsiveness. When the histogram is green it is bullish and red/pink means bears.
在腳本中搜尋"bear"

Bilateral Stochastic Oscillator - For The Sake Of EfficiencyIntroduction
The stochastic oscillator is a feature scaling method commonly used in technical analysis, this method is the same as the running min-max normalization method except that the stochastic oscillator is in a range of (0,100) while min-max normalization is in a range of (0,1). The stochastic oscillator in itself is efficient since it tell's us when the price reached its highest/lowest or crossed this average, however there could be ways to further develop the stochastic oscillator, this is why i propose this new indicator that aim to show all the information a classical stochastic oscillator would give with some additional features.
Min-Max Derivation
The min-max normalization of the price is calculated as follow : (price - min)/(max - min) , this calculation is efficient but there is alternates forms such as :
price - (max - min) - min/(max - min)
This alternate form is the one i chosen to make the indicator except that both range (max - min) are smoothed with a simple moving average, there are also additional modifications that you can see on the code.
The Indicator
The indicator return two main lines, in blue the bull line who show the buying force and in red the bear line who show the selling force.
An orange line show the signal line who represent the moving average of the max(bull,bear), this line aim to show possible exit/reversals points for the current trend.
Length control the highest/lowest period as well as the smoothing amount, signal length control the moving average period of the signal line, the pre-filtering setting indicate which smoothing method will be used to smooth the input source before applying normalization.
The default pre-filtering method is the sma.
The ema method is slightly faster as you can see above.
The triangular moving average is the moving average of another moving average, the impulse response of this filter is a triangular function hence its name. This moving average is really smooth.
The lsma or least squares moving average is the fastest moving average used in this indicator, this filter try to best fit a linear function to the data in a certain window by using the least squares method.
No filtering will use the source price without prior smoothing for the indicator calculation.
Relationship With The Stochastic Oscillator
The crosses between the bull and bear line mean that the stochastic oscillator crossed the 50 level. When the Bull line is equal to 0 this mean that the stochastic oscillator is equal to 0 while a bear line equal to 0 mean a stochastic oscillator equal to 100.
The indicator and below a stochastic oscillator of both period 100
Using Levels
Unlike a stochastic oscillator who would clip at the 0 and 100 level the proposed indicator is not heavily constrained in a range like the stochastic oscillator, this mean that you can apply levels to trigger signals
Possible levels could be 1,2,3... even if the indicator rarely go over 3.
Its then possible to create strategies using such levels as support or resistance one.
Conclusion
I've showed a modified stochastic oscillator who aim to show additional information to the user while keeping all the information a classical stochastic oscillator would give. The proposed indicator is no longer constrained in an hard range and posses more liberty to exploit its scale which in return allow to create strategies based on levels.
For pinescript users what you can learn from this is that alternates forms of specific formulas can be extremely interesting to modify, changes can be really surprising so if you are feeling stuck, modifying alternates forms of know indicators can give great results, use tools such as sympy gamma to get alternates forms of formulas.
Thanks for reading !
If you are looking for something or just want to say thanks try to pm me :)

Combo Strategy 123 Reversal & Bull And Bear Balance This is combo strategies for get a cumulative signal.
First strategy
This System was created from the Book "How I Tripled My Money In The
Futures Market" by Ulf Jensen, Page 183. This is reverse type of strategies.
The strategy buys at market, if close price is higher than the previous close
during 2 days and the meaning of 9-days Stochastic Slow Oscillator is lower than 50.
The strategy sells at market, if close price is lower than the previous close price
during 2 days and the meaning of 9-days Stochastic Fast Oscillator is higher than 50.
Second strategy
This new indicator analyzes the balance between bullish and
bearish sentiment.
One can cay that it is an improved analogue of Elder Ray indicator.
To get more information please see "Bull And Bear Balance Indicator"
by Vadim Gimelfarb.
WARNING:
- For purpose educate only
- This script to change bars colors.

SMA 50 collectorHello traders
The SMA 50 is known to define a trend. If price is closing above, trend is bullish, if below, trend is bearish.
That's why I like to have all of them on my chart :)
Enjoy
David

Turbo TriggerSome Words
This indicator is a collaboration between me and Himeyuri, i encourage you to check her profile and follow her www.tradingview.com
Introduction
A lot of indicators include a "trigger" line, it can be a smoothed version of another input, in this case the trigger will generate signals from his crosses with the input. The purpose of this indicator is to provide a fast trigger line to generate earlier signals as well as avoiding some whipsaw.
The Indicator
There are two lines, a bull line (blue) and the trigger (orange) , when the trigger cross over the bull line a buy signal is generated, when the trigger cross under the bull line a sell signal is generated. The trigger is made from the smoothed difference between the bull and bear line.
smooth control the smoothness of the output. The Bull/Bear Mode is an idea proposed by Himeyuri that involve plotting the bear line instead of the trigger.
Bull/Bear Mode, the lines are somewhat asymmetrical from each others.
Conclusion
We have showcased a new indicator who use a really fast trigger line to generate earlier signals, if some are way to earlier you can still increase smooth in order to correct reactivity. I hope you find a use to it.
Thanks for reading !
A big thanks to Himeyuri who is a great student and great pinescripter.

BOSS Smooth Stochastic Bull/Bear Oscillator With Alerts THE BEST FOREX, BINARY OPTIONS, AND CRYPTO INDICATORS FOR TRADINGVIEW.COM
Short Entry
During a price downtrend and you get a sell signal (red dot) enter short when the "K" line (green line) drops below 65 (mid upper band).
Long Entry
During an uptrend, buy when you get a long signal (green dot) and "D" line (red line) rises above 35 (mid lower band) .
Bull/Bear
Green background indicates bullish price action (uptrend)
Red background indicates bearish price action (downtrend)
Available At bosscripts.com
Website bosscripts.com

Eagle-CrossingThis is Arcane Bears First Script Which charts your Golden Cross and Death Cross, You can update the settings as you see fit!
If you have any questions please join us at www.arcanebear.com

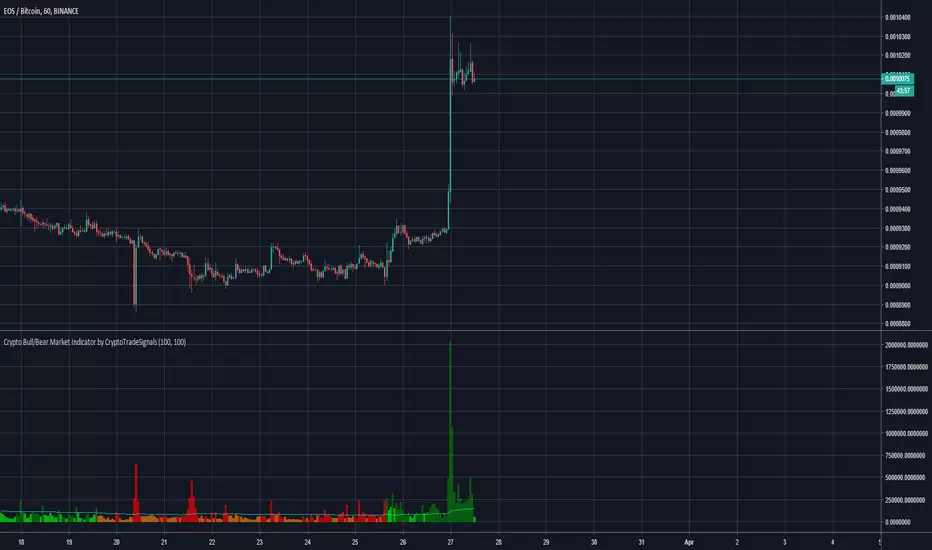
Crypto Bull/Bear Market Indicator by CryptoTradeSignalsHave you ever struggled to identify the sentiment of the crypto market?
With the "Crypto Bull/Bear Market Indicator by CryptoTradeSIgnals" you can easily determine whether markets are “bullish” or “bearish".
Features
Combines price and volume algorithms to easily identify market sell offs or strong buying activity.
Synergises with with Crypto Peak and Crypto Bottom indicators to better identify ENTRY and EXIT points for your trades.
Complete REWRITE of the pre-existing Crypto Bull/Bear Signal which provides better visual cues to understand market activity.
>>Get access to our Crypto Trading Indicators by visiting our website (please go to my main profile page or check the my signature)<<
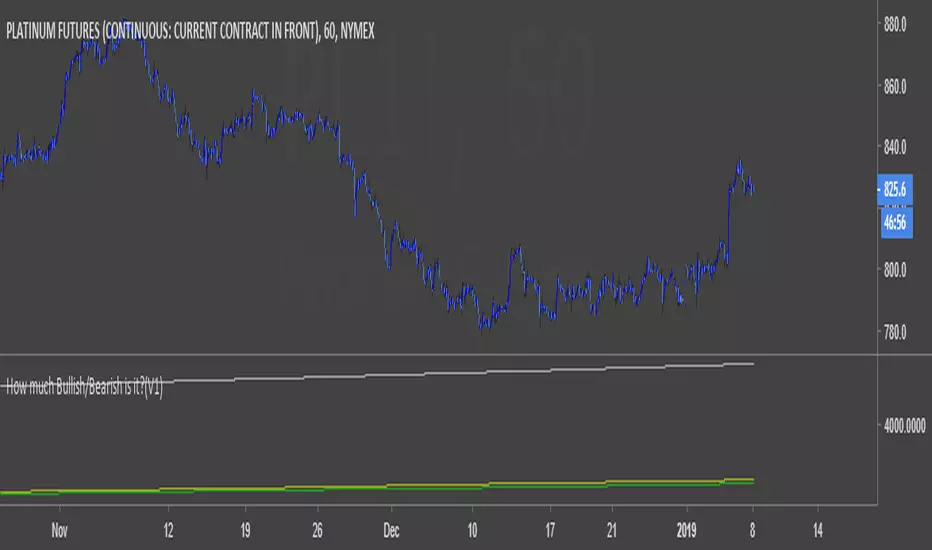
AG Market QualityGiven that we are primarily focussed on trend-following, we built this indicator in a quest to assess the "quality" of a market. It was adapted primarily from methods that trading coach Dr. Van Tharp popularised, namely to do with his SQN.
This indicator has 5 zones that act to classify the market:
Strong Bull - Dark Green
Bull - Green
Neutral - Grey
Bear - Red
Strong Bear - Dark Red
The black line is an SMA(20) of Market Quality (indicating average quality over a period).
The simplistic theory is to look for long trades when the quality is indicating bull or strong bull conditions (green or dark green), and look for short trades when the quality is indicating bear or strong bear conditions (red or dark red). When the quality is in neutral territory (grey bars), the market is choppy/sideways/rangebound, and it's generally best to stay out in these conditions (for trend-followers).
We like to look for long trades when the quality is bull or strong bull, and above the average quality (black line), and look for short trades when the quality is bear or strong bear, and below the average quality.
So, not only does this indicator help you decide when to get in the market, it also tells you when to stay out of the market - really handy!
You can change the periods of the Market Quality, and also the SMA measuring average quality.

Bitfinex Sentiment Index [Long-Short]BSI provides two attractive graphs that breakdown the long (green area) and short (red area) positions ratio for the all Bitfinex margin cryptocurrency pairs only .
It is a quantitative measure of the bullishness or bearishness that can be used as a trading rule or in a trading system entries or exits. Included slow stochastic oscillator.

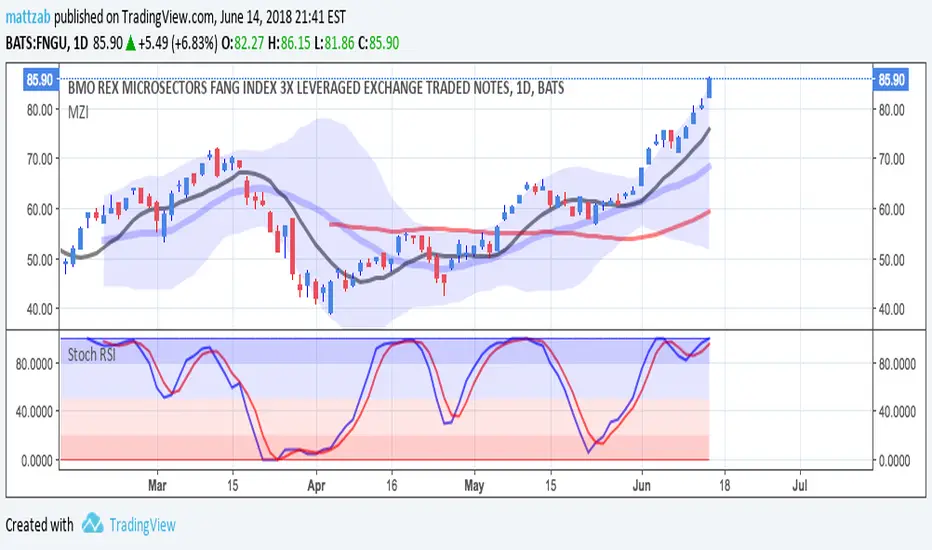
How much Bullish/Bearish is it?(V1)A script can show the amount of the bullishness and bearishness of candles on the chart based on the offered calculations.
Bull/Bear CandleThis script identifies whether the current and previous candle is bullish, bearish or neutral. Bullish candles are displayed with a green triangle, bearish with a red, and neutral with a yellow. The bull/bear cut off is set at 65% but this is adjustable to your taste.
Bull Bear Stoch RSIStandard Stoch RSI with some color modification. 0 - 20 = Really Bearish (Dark Red Zone) 20 - 50 = Bearish (Light Red Zone) 50 - 80 = Bullish (Light Blue Zone) and 80 - 100 = Really Bullish (Strong Blue Zone). Thick lines at top and bottom to easily see 100 and 0.
Confluence Strategy This is modified version of Dale Legan's "Confluence" indicator written by Gary Fritz.
================================================================
Here is Gary`s commentary:
Since the Confluence indicator returned several "states" (bull, bear, grey, and zero),
he modified the return value a bit:
-9 to -1 = Bearish
-0.9 to 0.9 = "grey" (and zero)
1 to 9 = Bullish
The "grey" range corresponds to the "grey" values plotted by Dale's indicator, but
they're divided by 10.

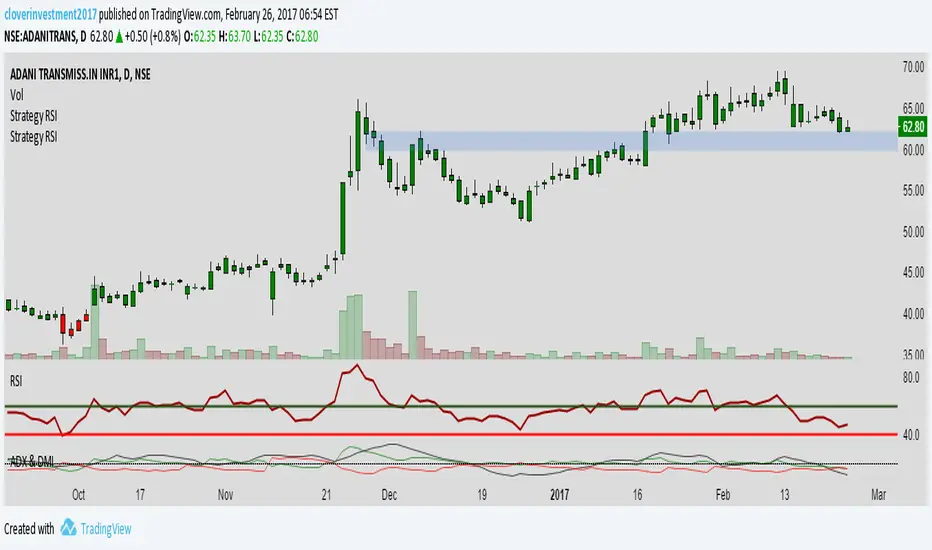
RSI IN Bull AND BEARLook RSI will oversold at 40 and 60 in Bullish Market
and RSI overbought at 60 and 40 at Bearish Market
To know more about Bullish and Bearish Market Criteria
Connect me at cloverinvestmentsindia@gmail.com
EMA bullish/bearish dashboard - MTFThis is a good reminder for which way you should be placing orders.
It's best to not ignore these signals!!!
lime = full bull - 100ema above 200ema and price is above 200ema
green = hallf bull - price now below 200ema but 100ema is still above the 200
maroon = full bear - opposite of full bull
red = half bear - opposite of half bull
Also with multi timeframe option - so I guess you could stack several of these on a single framed chart if you wanted.

[NM] EMADiff v01 - an indicator for everyone !Allright gang, we are here with a new indicator that should help you with determining the direction to trade or whether you should trade at all.
It uses the close of the candle and 2 EMAs.
The faster moving line is the difference between the close and the Slow EMA, while the slower moving line shows the difference between the Fast EMA and the Slow EMA.
There are a couple of ways you can use this indicator, depending on your trading style :
For the quick profit, in and out :
- enable the safer trading option and keep smoothing at the default setting, buy when both lines are green, sell when both line are red and get out when one of the lines changes color (or when profit target is reached) (see the top option)
For longer trades :
- you can increase the smoothing, use a higher Slow EMA and disable the Safer trading option, enter either when both lines have the same color, either on a crossover. (the bottom option)
In both cases, if both lines hover around the zero line, the trend is definitely not strong.
Much more options are available so I would love to hear how you use this indicator. A thumbs up if you like it would be highly appreciated :)
Works nicely together with my other indicators below :
To add this indicator (or any other) to your chart, click the "Add to favorites" button. Then while having the chart you wish to apply it to open, click on Indicators > Favorites > EMADiff v01 (or any other indicator that you favorited.

Elder Ray Composite DOA hybrid representation of Elder Ray's Bear/Bull as an oscillator, using TEMA and LRC calculations to average out the signals. The Oscillation is based off of the Derivative oscillator. This gives an interesting interpretation of Bear vs Bull power. Give it a try!

TraderDemircan - Ultimate Fibonacci Suite (Bearish) v2.0-Overview
This indicator is a comprehensive Fibonacci-based trading tool specifically designed for identifying and trading bearish XABCD harmonic patterns. It combines classical Fibonacci retracement/extension levels with advanced harmonic pattern recognition, risk management calculations, and confluence zone detection to provide traders with a complete analytical framework for short positions.
-What Makes This Script Original
Unlike standard Fibonacci tools that simply draw static levels, this script:
Dynamically identifies swing highs and lows using lookback period analysis
Automatically detects and labels XABCD formation points (X, A, B, C, D) in real-time
Recognizes multiple harmonic patterns (Gartley, Butterfly, Bat, Crab, Shark) with customizable tolerance
Calculates and displays Potential Reversal Zones (PRZ) at point D
Provides integrated risk management with position sizing, stop loss, and multiple take profit levels
Identifies confluence zones where multiple Fibonacci levels intersect
Includes trend filter to validate pattern direction
Offers trading mode presets for scalpers, day traders, and swing traders
-How It Works
XABCD Pattern Detection (Bearish Version)
The script uses a bearish structure where:
Point X: The highest point (swing high) identified within the lookback period
Point A: The lowest point (swing low) that occurs after X
Point B: The retracement level from A back toward X (typically 0.382, 0.5, 0.618, or 0.786)
Point C: The projected target below B (calculated as B minus the X-A range)
Point D: The Potential Reversal Zone (PRZ) where the short position is recommended
The algorithm:
Scans the last N bars (user-defined) to find the highest point (X)
Identifies the lowest point after X (point A)
Monitors price retracement to determine point B
Projects point C and D targets based on Fibonacci extensions
Validates the formation against minimum swing size requirements
Optionally applies trend filter to confirm bearish bias
Fibonacci Levels
The script plots 14 customizable Fibonacci levels:
Retracement levels: 0.0 (X), 0.236, 0.382, 0.5, 0.618, 0.786, 1.0 (A)
Extension levels: 1.272, 1.414, 1.618, 2.0, 2.618, 3.618, 4.236
Each level is color-coded and can be individually toggled on/off. In the bearish version, these levels are calculated from the swing high (X) downward to the swing low (A) and beyond.
Harmonic Pattern Recognition
The indicator automatically detects five classic harmonic patterns when enabled:
Bearish Gartley (75% probability): B retracement at 0.618, D target at 0.786
Bearish Butterfly (70% probability): B retracement at 0.786, D target at 1.272
Bearish Bat (80% probability): B retracement at 0.382-0.5, D target at 0.886
Bearish Crab (85% probability): B retracement at 0.382-0.618, D target at 1.618
Bearish Shark (72% probability): B retracement at 0.382-0.618, D target at 1.13
Pattern detection uses a tolerance parameter (default 5%) to account for market imperfections. When a pattern is identified, it displays the pattern name and estimated success probability.
Risk Management System
The script includes a complete risk management framework:
Position Sizing: Calculates the appropriate position size based on:
Account size (user input)
Risk percentage per trade (user input)
Distance from entry to stop loss
Stop Loss: Automatically placed 0.5% above point X to protect against invalidation
Take Profit Levels:
TP1: 1.272 extension (customizable)
TP2: 1.618 extension (customizable)
TP3: 2.0 extension (customizable)
Risk/Reward Ratio: Displayed in the info panel, calculated as (Entry - TP3) / (Stop Loss - Entry)
Confluence Detection
When multiple Fibonacci levels converge within 0.5% of each other, the script highlights these zones with translucent boxes. These confluence zones often act as strong support/resistance areas and increase the probability of reversal.
Minimum confluence threshold is customizable (default: 2 levels).
Trend Filter
Optional moving average filter (default: 50-period SMA) helps validate that patterns are forming in the direction of the prevailing trend. When enabled with "Only Show Patterns in Trend Direction," the indicator will only display formations that align with a bearish trend (price below MA).
-How to Use
For Scalpers:
Select "Scalper" trading mode
Use lower timeframes (1m, 5m, 15m)
Focus on TP1 and TP2 levels
Tight stop loss above point X
For Day Traders:
Select "Day Trader" trading mode
Use medium timeframes (15m, 30m, 1H)
Target TP2 and TP3 levels
Monitor confluence zones for entry refinement
For Swing Traders:
Select "Swing Trader" trading mode
Use higher timeframes (4H, D)
Hold for TP3 or beyond
Use trend filter to confirm macro direction
Entry Strategy:
Wait for point D (PRZ) to be reached
Look for bearish confirmation (candlestick patterns, volume, momentum)
Enter short position at or near point D
Place stop loss above point X as indicated
Scale out at TP1, TP2, and TP3 levels
-Key Settings
General Settings:
Trading Mode: Presets optimized for different trading styles
Lookback Bars: Historical period for swing detection (10-200)
Min Swing Size: Minimum percentage move to validate formation (0.1-10%)
Fibonacci Levels:
Individual toggle and color customization for all 14 levels
Line thickness and style options (Solid/Dashed/Dotted)
Optional price and percentage labels
Left and right line extension
Harmonic Patterns:
Enable/disable specific pattern types
Pattern tolerance adjustment (1-15%)
Risk Management:
Account size input
Risk percentage per trade (0.5-10%)
Customizable TP level multipliers
Toggle stop loss and take profit displays
Display Options:
Show/hide XABCD lines
C target and D target (PRZ) visualization
Confluence zone highlights
Trend MA overlay
Information panel with trade statistics
Alert Settings:
Pattern completion alerts
C target hit notifications
Key Fibonacci level alerts
-Visual Features
Color-coded Fibonacci levels: Each level has a distinct color for easy identification
Dynamic XABCD lines: Yellow lines connect pattern formation points
Target projections: Magenta for C target, blue for D target (PRZ)
Risk management lines: Red for stop loss, green for take profits
Confluence boxes: Golden translucent boxes highlight key zones
Information panel: Top-right panel displays pattern type, entry, stop loss, TP3, R:R ratio, position size, and direction
Point labels: Clear X, A, B, C, D markers with hover tooltips showing exact prices
-Important Disclaimers
Risk Warning: Trading financial instruments involves substantial risk and may not be suitable for all investors. Past performance of any trading system or pattern is not necessarily indicative of future results.
No Repainting: This indicator does NOT repaint. All pattern detection and level calculations are based on confirmed price data at the close of each bar.
Backtesting Note: If used as a strategy with backtesting, ensure realistic parameters:
Use appropriate commission (0.1% or higher for most markets)
Include slippage (10+ ticks for liquid markets)
Risk no more than 2-5% of account per trade
Test on sufficient sample size (100+ trades minimum)
Manual Confirmation: This indicator is a tool to assist analysis, not a complete trading system. Always use additional confirmation from:
Price action analysis
Volume confirmation
Market context and news
Risk tolerance assessment
Harmonic Pattern Probabilities: The success rates shown (70-85%) are theoretical estimates based on historical studies and should not be interpreted as guarantees. Actual results will vary based on market conditions, execution timing, and individual risk management.
-Technical Details
Pine Script Version: v6 (latest)
Overlay: True (displays on price chart)
Maximum Objects: 500 lines, 500 labels, 500 boxes
Calculation Method: Swing high/low detection with percentage-based Fibonacci calculations
No Lookahead Bias: All calculations use confirmed historical data
Compatible Timeframes: All timeframes (1m to 1M), recommended 15m and above
-Differences from Bullish Version
This is the bearish version specifically designed for short positions:
X point is the swing HIGH (not low)
A point is the swing LOW (not high)
B retracement moves UP from A toward X
C target projects DOWN from B
D target (PRZ) is calculated ABOVE X for short entries
All Fibonacci levels are inverted for downward price movement
Pattern recognition logic adjusted for bearish structures
A companion bullish version is available separately for long position analysis.

Direction via Zone Break [by rukich]🟠 OVERVIEW
The indicator shows the direction of movement and zones: SSL, BSL, FVG.
Zones serve as support/resistance and as validation/invalidation of a movement reversal.
🟠 COMPONENTS
The direction of movement is built based on a three-candle swing high (BSL) and swing low (SSL) pattern. If swing high (BSL) and swing low (SSL) are formed, and then an internal swing high/low is formed (depending on the direction of movement), then in case the initial movement continues — for example, in an upward movement — the new swing low (SSL) will be the minimum before the update, i.e., the internal low, while the swing high (BSL) will be formed according to the three-candle pattern.
A change of direction is considered when a candle closes beyond the key swing high/low (BSL/SSL), depending on the direction of movement. For example, in an upward movement, a break occurs when a candle closes beyond the swing low (SSL). After that, the swing high (BSL) will be the nearest fractal (swing high), and the swing low (SSL) will be formed according to the three-candle pattern.
All the above logic also applies to downward movements.
Within each movement, there can be FVG zones, which can act as support/resistance or indicate weakness in the movement direction.
Note: if the movement is upward, only bullish FVG+ will be displayed; if the movement is downward, only bearish FVG- will be displayed.
Weakness of movement direction.
For example, consider an upward impulse with the nearest FVG+ zone. If the price closes beyond the lower boundary of the zone, it will be considered invalidated (inv. FVG-), which in turn indicates weakness in the movement direction and a possible local short, which may subsequently lead to a break of the entire movement.
🟠 HOW TO USE
There are only two visual settings in the configuration:
Show previous SSL/BSL – enables/disables the display of all previous SSL/BSL zones
Show Bullish/Bearish trend – enables/disables background shading between SSL and BSL for visual understanding of the movement direction
On the chart, the following are displayed:
Labels with current SSL/BSL
FVG+- / inv. FVG+- zones, for trading in the movement direction
In case the nearest FVG is invalidated, a label will appear with the text: Weak bullish/bearish & local short/long (this is not a signal, but only indicates the probability of a potential move based on the weakness of the nearest zone)
🟠 CONCLUSION
The indicator helps determine the current movement with zones for trading in the direction, and also indicates movement weakness through invalidation of the nearest zones.

S&P 500 Breadth: Bull vs Bear (20DMA)S&P 500 Breadth: Bull vs Bear (20DMA)
Use as simple market breadth
EMAs Bullish/Bearish Confluence [Trend Bias]EMA Confluence Zones
This indicator is designed to simplify trend identification by visually highlighting "Confluence Zones" —areas where short-term, medium-term, and long-term momentum are fully aligned.
While traders can manually add three Moving Averages to a chart, identifying the exact moment all three align (the "Perfect Stack") can be visually difficult during live trading. This script automates that process, converting complex line crosses into simple background color zones and providing actionable alerts for the exact moment a trend alignment begins.
🛠 How It Works
The script utilizes three customizable Exponential Moving Averages (EMAs) to detect the market bias:
Short EMA: Represents immediate price action/momentum.
Medium EMA: Represents the intermediate trend.
Long EMA: Represents the major trend baseline.
Calculations & Logic
The indicator checks for a specific hierarchical alignment (Stacking) of these averages:
1. 🟢 Bullish Confluence (Buy Zone):** Returns true when `Short > Medium` AND `Medium >Long`. This confirms that momentum is rising across all three monitored timeframes.
2. 🔴 Bearish Confluence (Sell Zone):** Returns true when `Short < Medium` AND `Medium < Long`. This confirms that momentum is falling across all three monitored timeframes.
3. ⚪ Neutral (No Color): Any other state indicates a choppy or consolidating market where the EMAs are intertwined.
---
🚀 Key Features
*Visual Bias Confirmation: The background highlights Green (Bullish) or Red (Bearish) only when the "Perfect Stack" conditions are met.
Trend Start Alerts: Unlike standard EMA cross alerts, this script includes custom alert conditions that trigger only on the first bar where the confluence becomes valid. This prevents spam alerts during a prolonged trend.
Full Customization: Users can adjust the lengths of all three EMAs to fit specific strategies (e.g., Scalping vs. Swing Trading).
Clean Chart Mode: Includes options to hide the EMA lines entirely and rely solely on the background color for a minimalist "Naked Trading" setup.
🎯 How to Use
1. Trend Filter: Use the background color to determine your directional bias. If the background is Green, look only for Long setups on lower timeframes. If Red, look only for Short setups.
2. Breakout Confirmation: If price breaks a key level, wait for the background color to flip. This confirms that the Moving Averages have caught up to the move, validating the breakout strength.
3. Exit Signal: If you are in a trend trade and the background color disappears (turns transparent), it indicates the trend momentum is fading and the EMAs are beginning to cross/compress.
⚙️ Settings
EMA Lengths: Default is 20, 50, 100. These can be changed to common combinations like (9, 21, 55) or (50, 100, 200).
Visuals: Toggle lines or background colors on/off and adjust transparency to keep your chart readable.
---
Disclaimer: This script is for informational purposes only. Past performance of a trend following method does not guarantee future results. Always use proper risk management.
