Bull / Bear Market RegimeBull / Bear Market Regime
Instructions:
- A simple risk on or risk off indicator based on CBOE's Implied Correlation and VIX to highlight and indicate Bull / Bear Markets. To be used with the S&P500 index as that's the source from where the CBOE calculates and measures implied volatility & implied correlation. Can also be used with the other indices such as: Dow Jones, S&P 500, Nasdaq, & Nasdaq100, & Index ETF's such as DIA, SPY, QQQ, etc.
- Know the active regime, see the larger picture using the Daily or Weekly view, and visualize the current "Risk On (Bull) or Risk Off (Bear)" environment.
Description:
- Risk On and Risk Off simplified & visualized. Know if we are in a RISK ON or RISK OFF environment (Bull or Bear Market). (Absolute bottoms and tops will occur BEFORE a Risk On (Bull Market) or Risk Off (Bear Market) environment is confirmed!) This indicator is not meant to bottom tick or uptick market price action, but to show the active regime.
- Green: Bull Market, Risk On, low volatility, and low risk.
- Red: Bear Market, Risk Off, high volatility, and higher risk.
Buy & Sell Indicators (DAILY time frame)
- Nothing is 100% guaranteed! Can be used for short to medium term trades at the users discretion in BEAR MARKETS!!
- These signals are meant to be used during a RISK OFF / BEAR MARKET environment that tends to be accompanied with high volatility. A Risk on / Bull Market environment tends to have low volatility and endless rallies, so the signals will differ and in most instances not apply for Bull market / Risk on regime.
- The SELL signal will more often than not signal that a pullback is near in a BULL market and that a BMR-Bear Market Rally is almost over in a BEAR market.
- The BUY signal will have far more accuracy in a BEAR market-high volatility environment and can Identify short-term and major bottoms.
Always use proper sizing and risk management!
在腳本中搜尋"bear"

Bull/Bear Candle % Oscillator█ OVERVIEW
This script determines the proportion of bullish and bearish candles in a given sample size. It will produce an oscillator that fluctuates between 100 and -100, where values > 0 indicate more bullish candles in the sample and values < 0 indicate more bearish candles in the sample. Data produced by this oscillator is normalized around the 50% value, meaning that an even 50/50 split between bullish and bearish candles makes this oscillator produce 0; this oscillator indirectly represents the percent proportion of bullish and bearish candles in the sample (see HOW TO USE/INTERPRETATION OF DATA ).
It has two overarching settings: 'classic' and 'range'.
█ CONCEPTS
This script will cover concepts related to candlestick analysis, volumetric analysis, and lower timeframes.
Candlestick Analysis - The idea behind this script is to solely look at the candlesticks themselves and derive information from them in a given sample. It separates candles into two categories, bullish (close > open) and bearish (close < open).
If the indicator's setting is set to 'classic', the size of candles do not matter and all are assigned a value of 1 or 0.
If the indicator's setting is set to 'range', specific candle ranges modify the proportion of bullish/bearish values. Bullish candle values include all bullish candles in the set from their lows to the close, plus the lower wicks of all bearish candles. Bearish candle values include all bearish candles in the set from their highs to the close, plus the upper wicks of all bullish candles.
Volumetric Analysis - One of this script's features allows the user to modify the bullish and bearish candle proportions by its 'weight' determined by its volume compared to the sample set's total volume. Volumetric analysis for the 'range' setting are more complex than 'classic' as described below.
Lower Timeframes - For volumetric analysis to be done on candle wicks, there needed to be a way to determine how much volume had occurred in the wick by itself to find the weight of upper and lower wicks. To accomplish this, I employed PineScrypt's request.security_lower_tf function to grab OHLC values of lower timeframe candles (as well as volume) to determine how much volume had occurred in the wicks of the chart resolution's candle. The default OHLC values used here are the lows for upper wicks and highs for lower wicks. These OHLC values are then compared to the chart resolution candle's close to determine if the volume of that lower timeframe candle should be shifted to the wick weight or stay in the current weight of that candle. The reason 'low' and 'high' are used here is to guarantee that 100% of the volume of a lower timeframe candle had occurred in the wick of the candle at the current resolution (see LIMITATIONS ).
Bullish candles will exclude volume of all lower timeframe candles whose lows were greater than that candle's close. Bearish candles will exclude volume of all lower timeframe candles whose highs were less than that candle's close. These wick volumes are then divided by the volume of the sample set, and wick sizes are then multiplied by this weight before being added to their specific bullish/bearish sums (lower wicks to bullish and upper wicks to bearish).
█ FEATURES
There are 13 inputs for the user to modify the behavior/visual representation of this script.
Sample Length - This determines how many candles are in the sample set to find the proportion of bullish and bearish candles.
Colors and Invert Colors - There are three colors set by the user: a bullish color, neutral color, and bearish color. The oscillator plots two lines, one at 0 and another that represents the proportion of bullish or bearish candles in the sample set (we'll call this the 'signal line'). If the oscillator is above 0, bullish color is used, bearish otherwise. This script generates a gradient to color a filled area between the 0 line and the signal line based on the historical values of the oscillator itself and the signal line. For bullish values, the closer the signal line is to the max (or restricted max described below) that the oscillator has experienced, the more colored toward bullish color the shaded area will be, using the neutral color as a starting point. The same is applied to the bearish values using the bearish color.
There is an additional input to invert the colors so that the bearish color is associated with bullish values and vise-versa.
Calculation Type - This determines the overarching behavior of the oscillator and has two settings:
Classic - The weight of candles are either 1 if they occurred and 0 if not.
Range - The weight of candles is determined by the size of specific sections as described in CONCEPTS - Candlestick Analysis .
Volume Weighted - This enables modifying the weights of candles as described in CONCEPTS - Volumetric Analysis and Lower Timeframes based on which Calculation Type is used.
Wick Slice Resolution - This is the lower timeframe resolution that will be used to slice the chart resolution's candle when determining the volumetric weight of wicks. Lower timeframe resolutions like '1 minute' will yield more precise results as they will give more data points to go off of (see LIMITATIONS ).
Upper/Lower Wick Source - These two inputs allow the user to select which OHLC values to compare against the chart resolution's candle close when determining which lower timeframe candles will have their volumes associated with the wicks of candles being analyzed at the chart's resolution.
Restrict Min/Max Data and Restriction - This will restrict the maximum and minimum values that will be used for the signal line when comparing its value to previous oscillator values and change how the color gradient is generated for the indicator. Restriction is the number of candles back that will determine these maximum and minimum values.
Display Min/Max Guide - This will plot two lines that are colored the corresponding bullish and bearish colors which follow what the maximum and minimum values are currently for the oscillator.
█ HOW TO USE/INTERPRETATION OF DATA
As mentioned in the OVERVIEW section, this oscillator provides an indirect representation of the percent proportion of bullish or bearish candles in a given sample. If the oscillator reads 80, this does not mean that 80% of all candles in the sample were bullish . To find the percentage of candles that were bullish or bearish, the user needs to perform the following:
50% + ((|oscillator value| / 100) * 50)%
If the oscillator value is negative, the value from above will represent the percentage of bearish candles in the sample. If it is positive, this value represents the percentage of bullish candles in the sample.
Example 1 (oscillator value = 80):
50% + ((|80| / 100) * 50)%
50% + ((0.80) * 50)%
50% + 40% = 90%
90% of the candles in the sample were bullish.
Example 2 (oscillator value = -43):
50% + ((|-43| / 100) * 50)%
50% + ((0.43) * 50)%
50% + 21.5% = 71.5%
71.5% of the candles in the sample were bearish.
An example use of this indicator would be to put in a 'buy' order when its value shows a significant proportion of the sampled candles were bearish, and put in a 'sell' order when a significant proportion of candles were bullish. Potential divergences of this oscillator may also be used to plan trades accordingly such as bearish divergence - price continues higher as the oscillator decreases in value and vise-versa.*
* Nothing in this script constitutes any form of financial advice. The user is solely responsible for their trading decisions and I will not be held liable for any losses or gains incurred with the use of this script. Please proceed with caution when using this script to assist with trading decisions.
█ LIMITATIONS
Range Volumetric Weights :
Because of the conditions that must be met in order for volume to be considered part of wicks, it is possible that the default settings and their intended reasoning will not produce reliable results. If all lower timeframe candles have highs or lows that are within the body of the candle at the chart's resolution, the volume for the wicks will effectively be 0, which is not an accurate representation of those wicks. This is one of the reasons why I included the ability to change the source values used for these conditions as certain OHLC values may produce more reliable/intended results under these conditions.
Wick Slice Resolution :
PineScript restricts the number of intrabar references to 100,000 total. This script uses 3 separate request.security_lower_tf calls and has a default resolution of 1 minute. This means that if the user were to set the oscillator to the Range setting, enable volume weighted, and had the Wick Slice Resolution set to 1 minute, this script will exceed this 100,000 reference restriction within 24 days of data and will not produce any results beyond the previous 23.14 days.
Below are example uses of all the different settings of this script, these are done on the 1D chart of COINBASE:BTCUSD :
Default Settings:
Classic - Volume Weighted:
Range - no Volume Weight:
Range - Volume Weighted (1 min slices):
Range - Volume Weighted (1 hour slices):
Display Min/Max Guide - No Restriction:
Display Min/Max Guide - Restriction:
Invert Colors:

Bitcoin Bulls and Bears by @dbtrBitcoin 🔥 Bulls & Bears 🔥
v1.0
This free-of-charge BTC market analysis indicator helps you better understand what's going with Bitcoin from a high-level perspective. At a glance, it will give you an immediate understanding of Bitcoin’s historic price channel dating back to 2011, past and current market cycles, as well as current key support levels.
Usage
Use this indicator with any BTCUSD pairs , ideally with a long price history (such as BNC:BLX )
We recommend to use this indicator in log mode, combined with Weekly or Monthly timeframe.
Features
🕵🏻♂️ Historic price channel curve since 2011
🚨 Bull & bear market cycles (dynamic)
🔥 All-time highs (dynamic)
🌟 Weekly support (dynamic, based on 20 SMA )
💪 Long-term support (channel bottom)
🔝 Potential future price targets (dynamic)
❎ Overbought RSI coloring
📏 Log/non-log support
🌚 Dark mode support
Remarks
With exception of the price channel curve, anything in this indicator is calculated dynamically , including bull/bear market cycles (based on a tweaked 20SMA), ATHs, and so on. As a result, historic market cycles may not be 100% accurately reflected and may also differ slightly in between various time-frames (closest result: Monthly). The indicator may even consider periods of heavy ups/downs as their own market cycles, even though they weren’t. Due to its dynamic nature, this indicator can however adapt to the future and helps you quickly identify potential changes in market structure, even if the indicator is no longer updated.
On top of that bullmarket cycles (colored in green) feature an ingrained RSI: the darker the green color, the more the RSI is overbought and close to a correction (darkest color in the chart = 90 Weekly RSI). In comparison with past bull cycles, it helps you easily spot potential reversal zones.
Thanks
Thanks to @quantadelic and @mabonyi which both have worked on the BTC "growth zones" indicator including the price channel, of which I have used parts of the code as well as the actual price channel data.
Follow me
Follow me here on TradingView to be notified as soon as new free and premium indicators and trading strategies are published. Inquire me for any other requests.
Enjoy & happy trading!

Bitcoin Bulls & Bears @dbtr
Bitcoin Bulls & Bears
The "Bitcoin Bulls & Bears" indicator helps you better understand Bitcoin with a high-level view on Bitcoin’s historic price channel, past and current market cycles, as well as current key support levels.
Usage
Use this indicator with any BTCUSD pairs , ideally with a long price history (such as BNC:BLX )
We recommend to use this indicator in log mode, combined with Weekly or Monthly timeframe.
Features
🕵🏻♂️ Historic price channel curve since 2011
🚨 Bull & bear market cycles (dynamic)
🔥 All-time highs (dynamic)
🌟 Weekly support (dynamic, based on 20 SMA)
💪 Long-term support (channel bottom)
🔝 Potential future price targets (dynamic)
📏 Log/non-log support
🌚 Dark mode support
Remarks
Except for the historic price channel curve, all of this indicator is calculated dynamically , including bull/bear market cycles (based on a tweaked 20SMA). Due to this, the historic market cycles may not be 100% accurate and may also differ slightly between time-frames. It may also consider short times of ups/downs to be their own market cycles, even though they weren’t. This dynamic nature allows this indicator to adapt to the future and quickly help you identify changes in market structure.
On top of the that, the bullmarket cycles (green background) feature an ingrained RSI information: the darker the green, the more the RSI is overbought and close to a correction. In combination with past bull cycles, it is easier to spot potential reversal zones.
Thanks
Thanks to @quantadelic and @mabonyi for their pre-work on the price channel information, which I have taken over here

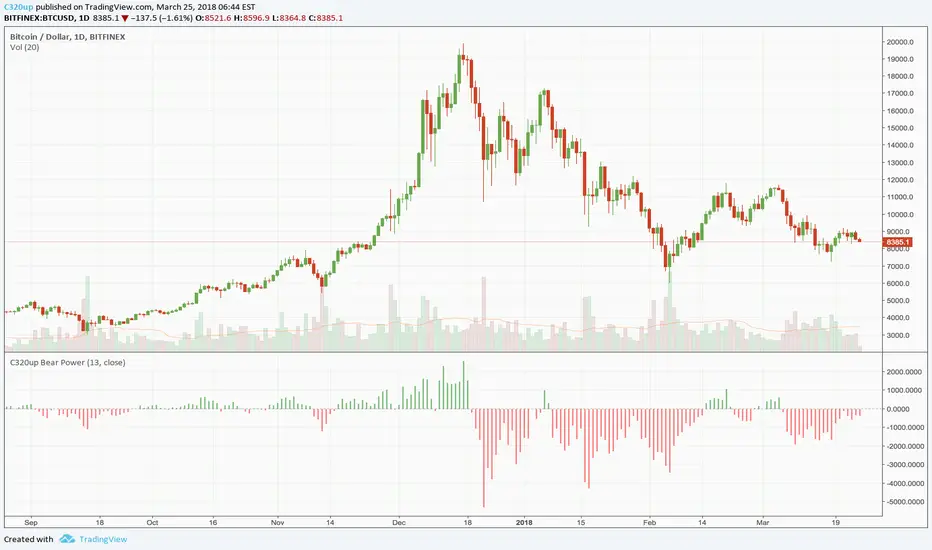
C320up Bear Power
C320up Bear Power
“The Bears Power oscillator was developed by Alexander Elder. It measures the difference between the lowest price and a 13-day Exponential Moving Average (EMA), plotted as a histogram. If the Bears Power indicator is below zero, it means sellers were able to drive price below the EMA. If the Bears Power indicator is above zero, it means buyers were able to keep the lowest price above the EMA. Bears Power is a fully unbounded oscillator with a base value of 0 and has no lower or upper limit. The indicator is often used in combination with other signals.” ~ TradingView
You can customise the colours of this indicator or change from histogram to area, line, etc., or a combination of these.
The default colours are Green (Bulls) for above zero, and Red (Bears) for below zero.
This indicator is not to be confused with Elder’s Force Index, which uses SMA and Volume.
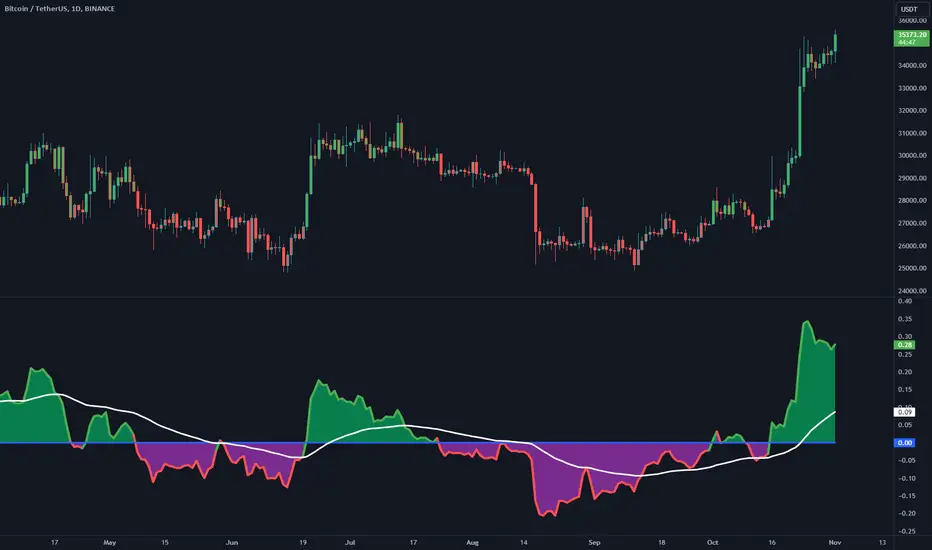
Bull Bear Power with Optional Normalization FunctionThis indicator is designed to provide traders with insights into market sentiment and potential trend reversals. This indicator enhances the traditional Bull Bear Power (BBP) by adding valuable visualizations and customization options to assist traders in making informed trading decisions.
Indicator Overview:
The NBBP indicator calculates Bull Bear Power, which measures the strength of bullish and bearish forces in the market. It does so by taking the difference between the high and the exponential moving average (EMA) of the closing price for a specified length. This raw BBP is represented on the chart as a line.
Key Features:
-- Zero Line : The NBBP indicator introduces a central reference line at zero. This line serves as a pivotal point for interpreting market sentiment. When the BBP line is above zero, it is colored green, indicating a predominance of bullish sentiment. Conversely, when the BBP line is below zero, it turns red, signaling a prevalence of bearish sentiment. This coloration helps traders quickly identify shifts in market sentiment.
-- OPTIONAL Normalization Function : One of the standout features of the NBBP indicator is its optional normalization function. When activated in the settings menu, this function scales the BBP values from -1 to +1. This means that BBP values are adjusted to fit within a standardized range, making it easier for traders to compare sentiment across different timeframes or assets. Normalization is particularly valuable for identifying extreme sentiment conditions and potential reversals.
-- Moving Average : To provide additional context and smooth out BBP fluctuations, the indicator includes an exponential moving average (EMA). The EMA of BBP is plotted on the chart as a white line. Traders can use this moving average to identify trends and potential trend reversals.
-- Fill Between Lines : The indicator visually enhances the BBP by filling the area between the BBP line and the zero line with a translucent color. This fill helps traders visualize the strength and duration of bullish or bearish sentiment.
Interpretation:
-- BBP Line : Traders can assess the raw BBP line for shifts in sentiment. When the line crosses above zero, it may suggest a shift from bearish to bullish sentiment, potentially indicating a buying opportunity. Conversely, when the line crosses below zero, it may signal a shift from bullish to bearish sentiment, suggesting a potential selling opportunity.
-- Normalization Function : The optional normalization function allows traders to gauge sentiment on a standardized scale. Values above 0 indicate bullish sentiment, while values below 0 suggest bearish sentiment. The closer the values are to their polar ends (-1 or +1), the stronger the sentiment.
-- Moving Average : The EMA of BBP helps identify trends. When BBP crosses above the EMA, it may indicate a strengthening bullish trend, while a crossover below the EMA may suggest a bearish trend.
Customization:
The NBBP indicator provides traders with flexibility through customizable settings. Users can adjust the BBP length, EMA length, and choose to activate or deactivate the normalization function based on their trading preferences and strategy.
Limitations:
The NBBP indicator is most effective when used in conjunction with other technical analysis tools and market context. Traders should consider multiple factors when making trading decisions.
Normalization function results may vary depending on the chosen length and market conditions. If the desired result is not achieved through default settings, try changing timeframes or toggling on/off the normalization function. Users should exercise caution and combine it with other indicators and analysis techniques.
In conclusion, the NBBP indicator is a versatile tool that empowers traders to assess market sentiment, identify potential reversals, and follow trends. Its intuitive visualizations, normalization function, and customizable settings make it a valuable addition to any trader's toolkit.
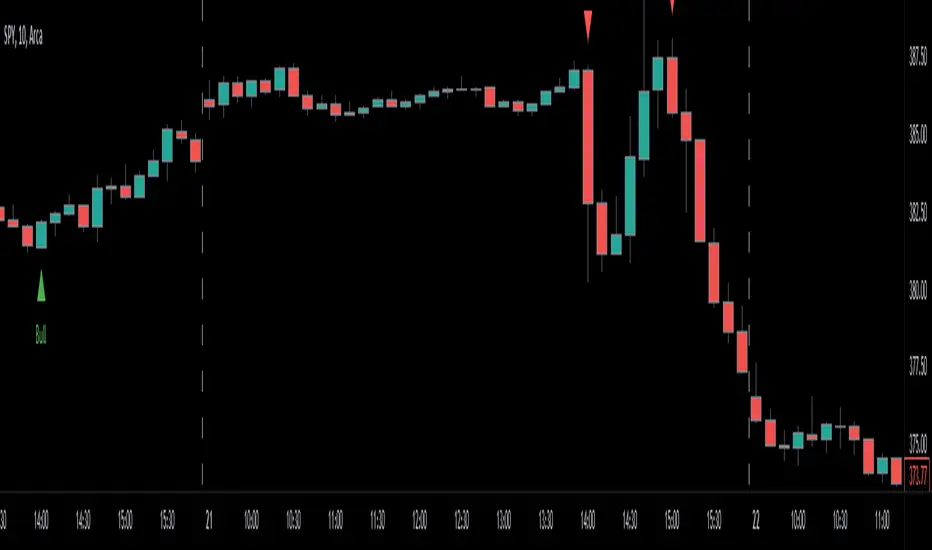
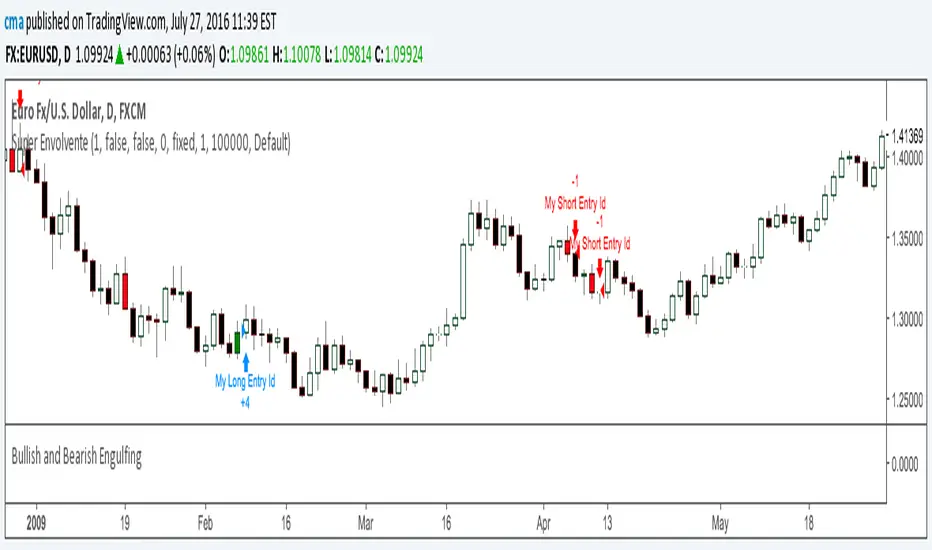
Engulfing Candles (Bullish and Bearish) + Trend | by Octopu$⛳ Engulfing Candles (Bullish and Bearish ) with Trend Recognition | by Octopu$
This Indicator identifies and plots Engulfing Candlestick Patterns.
Engulfing Candles are a combination of two bars on a price chart.
They are used to indicate/anticipate a market reversal.
The second candlestick must be bigger than the first, so it 'engulfs' the previous bar.
This indicator identifies both Price Movements:
Bullish stands for Upside
Bearish stands for Downside
These are NOT entry/exit signals to buy or sell securities*
(*The combination of your understanding and analysis as well as other Indicators and Factors as Confluence, you can improve your Charting Analysis.)
www.tradingview.com
SPY
ANY Ticker. ANY Timeframe.
( SPY 5m as an example only.)
Features:
• Engulfing Candles
• Bullish Setups
• Bearish Setups
• Symbol Signals
Options:
• Color Picker
• Symbol Selector
• Toggle On/Off
• Show name
• Trend Direction
Notes:
v1.0
Indicator release.
Changes and updates can come in the future for additional functionalities or per requests. Follow and Stay Tuned!
Did you like it? Please Support and Shoot me a message! I'd appreciate if you dropped by to say thanks! Thank you.
- Octopu$
🐙
Bears Bulls Impulse [Loxx]Bears Bulls Impulse, originally known as the the Elder-Ray Index, is a technical indicator developed by Dr. Alexander Elder that measures the amount of buying and selling pressure in a market. This indicator consists of two indicators known as "bull power" and "bear power," which are derived from a 13-period moving average.
Included:
- Various average modes to fine-tune the signal
This is an exact clone of the "Bears Bulls Impulse" MT4 indicator

RSI with Divergences, Reverse Formulas, and Bull/Bear ZonesRegular RSI indicator that can underline divergences, turn green or red specifying user specified bull/bear zones, and with a label showing the price needed to turn bull/bear!
Specify the inputs:
+ RSI Length
+ Bull Threshold
+ Bear Threshold
+ Panel Position Offset
Also with toggle-able:
+ Bullish Divergence
+ Bearish Divergence
+ Hidden Bullish Divergence
+ Hidden Bearish Divergence
The zones included in the indicator are default and not meant to be used for all markets. The goal is to alter the bull/bear zones to find good breakout points and selloff points for your chosen security. Does not currently support automatic zone creation, or saving zones for each security (if that is even possible, may just need to create different layouts for each security).
Thanks!

Bulls and BearsIntroduction to the Bulls and Bears Indicator
HAVE YOU EVER WANTED TO SEE VISUALLY WHO IS IN CONTROL, THE BULLS OR BEARS?
This indicator aspires to make it much easier for the trader to read the market in a clear and concise manner.
This is an easy to use Bulls and Bears indicator that works very simply:
If the closing price is greater than the 20, 50 or 200 moving average it indicates with a '+'.
If the closing price is less than the 20, 50 or 200 moving average it indicates with a '-'.
There are also some additional indicators that if all three above are flagged, then a 'B' symbol appears below the candle, to indicate it a highly Bullish.
If all three closing prices are below all of the moving averages a 'B' symbol appears above the candle to indicate high Bearish pressure.

Patreon Bull Bear OscillatorThe Patreon bull-bear oscillator (PBBO) was carefully designed to give as much information as possible to the user without sacrificing readability. With it, you can detect the direction of trends, detect whether the market is ranging or trending, tell if a given signal is false, and easily spot divergences, in fact, the PBBO is the only indicator of the trend trading tier that was designed to spot potential reversals.
The indicator comes with alerts.
Settings
Length: Control the sensitivity to price variations, with a higher value aiming to detect longer-term trends.
Control Line Divisor: Divisor of the control line
Src: Source input of the indicator
Pre-Smoothing: If true, smooth "Src" before calculating the PBBO
Smooth: Period of the moving average used for pre-smoothing
Pre-Smoothing Method: Determine the type of moving average to be used during the pre-smoothing step. Available options are: EMA, TMA (triangular moving average), HULL, LSMA (least squares moving average)
Filter Alerts Based On The Control Line: Add an additional condition for the alerts.
Detecting The Direction Of A Trend
The indicator display three lines, one bull line (in blue), one bear line (in red), and a control line (in green). A bullish market is detected when the bull line is over the bear line, while a bearish market is detected when the bear line is over the bull line.
When one of the lines is declining, it means that the current trend is weakening, showing the potential for a retracement or reversal.
Filter Out False Signals With The Control Line
The PBBO is still subject to all the price variations you will see on your chart, and as such can return false signals, it is important to tell if a bullish/bearish market is significant before making a move, and this is what the control line aims to do.
The control line divisor can provide a way to control the position of the control line, with lower values of the divisor requiring even more significant moves in order to trigger a signal. A value of 2 for the control line divisor is recommended in order to filter out false signals.
Detecting Whether Market Is Trending Or Ranging
Telling when the market is trending is primordial in trend trading, and many indicators that aim to return this information have been proposed. The PBBO is also able to give such information. First, you can look at the bull and bear lines, if both are equal to 0, it means the market is ranging.
You can also use the control line to tell whether the market is trending or not, with a bull/bear line above the control line telling the market is trending.
Spotting Divergences With The PBBO
Spotting divergences is a simple way to detect potential reversals, and it was important for me to start working on an indicator able to detect them while trying to make everything super simple for the user.
With the PBBO you don't need to look at both the price and oscillator lines in order to detect divergences, you can simply look at the peaks made by the bull or bear line, if a peak is lower than a previous one, then a reversal might occur.
Above, we can see that the bull line made several peaks during the up-trend, with the last peak being lower than the previous one, we thus detect a bearish divergence and could expect a reversal. If the same case scenario occur but with peaks made by the bearish line then we detected a bullish divergence.
It can be difficult to tell whether a divergence is significant or not, it can also be hard for beginners to tell which peaks they must look at. A good rule of thumb would be to check if both peaks are coming from two different movements, this is done by seeing if the first peak has reached 0 before the second one occurred.
The control line is also useful to tell when peaks are significant or not, with peaks that are higher than the control line being more significant.
Alerts
By default, a buy alert is given once the bull line is greater than the bear line, and vice versa for a sell alert, the setting "Filter Alerts Based On The Control Line" allows you to only have an alert when the bull/bear line is greater than the control line.
Gaining Access To The Indicator
Only my Patrons can get access to this indicator, you can go to my Patreon page by clicking on the link in my signature. Note that you will also have access to the Patreon trailing stop and Patreon moving average.

Bull/Bear Probability [Anan]Hello Friends,,,
===================================
This indicator is based on Bayes' Theorem and is fully based on probabilities.
===================================
Formula For Bayes' Theorem:
P(Bull|Bear) = P(Bear∣Bull) * P(Bull) / P(Bear)
where:
Bull and Bear are events and P is probability
P(Bull|Bear) is the posterior probability, the probability of Bull after taking into account Bear
P(Bear∣Bull) is the conditional probability or likelihood, the degree of belief in Bear given that proposition of Bull belief (Bull true)
P(Bull) is the prior probability, the probability of Bull belief
P(Bear) is the prior probability, the probability of Bear belief
===================================
The indicator output 2 trend lines and (Bull/Bear) Signal :
Bull/Bear Probability Trend :
when the price is above it = Up Trend
when the price is below it = Down Trend
Bull/Bear Probability Trend Moving Average :
when the price is above it = Up Trend
when the price is below it = Down Trend
(Bull/Bear) Signal :
when Probability Trend Moving Average crossover Probability Trend = Bull Signal
when Probability Trend Moving Average crossunder Probability Trend = Bear Signal
===================================
Disclaimer:
This script is for informational and educational purposes only.
Use of the script does not constitutes professional and/or financial advice.
You alone the sole responsibility of evaluating the script output and risks associated with the use of the script.
===================================
Thanks to my friends dgtrd because he inspired me about probability, take a look at his scripts.
===================================

Bullish and Bearish EngulfingIndicator that changes the bar's color to green if there is a Bullish Engulfing or Red if there a Bearish Engulfing Patterns.

Bullish and Bearish EngulfingIndicator that changes the bar's color to green if there is a Bullish Engulfing or Red if there a Bearish Engulfing Patterns.
Nooner's Heikin-Ashi/Bull-Bear CandlesCandles are colored red and green when Heikin-Ashi and Bull/Bear indicator agree. They are colored yellow when they disagree.

Bear Market Probability Model# Bear Market Probability Model: A Multi-Factor Risk Assessment Framework
The Bear Market Probability Model represents a comprehensive quantitative framework for assessing systemic market risk through the integration of 13 distinct risk factors across four analytical categories: macroeconomic indicators, technical analysis factors, market sentiment measures, and market breadth metrics. This indicator synthesizes established financial research methodologies to provide real-time probabilistic assessments of impending bear market conditions, offering institutional-grade risk management capabilities to retail and professional traders alike.
## Theoretical Foundation
### Historical Context of Bear Market Prediction
Bear market prediction has been a central focus of financial research since the seminal work of Dow (1901) and the subsequent development of technical analysis theory. The challenge of predicting market downturns gained renewed academic attention following the market crashes of 1929, 1987, 2000, and 2008, leading to the development of sophisticated multi-factor models.
Fama and French (1989) demonstrated that certain financial variables possess predictive power for stock returns, particularly during market stress periods. Their three-factor model laid the groundwork for multi-dimensional risk assessment, which this indicator extends through the incorporation of real-time market microstructure data.
### Methodological Framework
The model employs a weighted composite scoring methodology based on the theoretical framework established by Campbell and Shiller (1998) for market valuation assessment, extended through the incorporation of high-frequency sentiment and technical indicators as proposed by Baker and Wurgler (2006) in their seminal work on investor sentiment.
The mathematical foundation follows the general form:
Bear Market Probability = Σ(Wi × Ci) / ΣWi × 100
Where:
- Wi = Category weight (i = 1,2,3,4)
- Ci = Normalized category score
- Categories: Macroeconomic, Technical, Sentiment, Breadth
## Component Analysis
### 1. Macroeconomic Risk Factors
#### Yield Curve Analysis
The inclusion of yield curve inversion as a primary predictor follows extensive research by Estrella and Mishkin (1998), who demonstrated that the term spread between 3-month and 10-year Treasury securities has historically preceded all major recessions since 1969. The model incorporates both the 2Y-10Y and 3M-10Y spreads to capture different aspects of monetary policy expectations.
Implementation:
- 2Y-10Y Spread: Captures market expectations of monetary policy trajectory
- 3M-10Y Spread: Traditional recession predictor with 12-18 month lead time
Scientific Basis: Harvey (1988) and subsequent research by Ang, Piazzesi, and Wei (2006) established the theoretical foundation linking yield curve inversions to economic contractions through the expectations hypothesis of the term structure.
#### Credit Risk Premium Assessment
High-yield credit spreads serve as a real-time gauge of systemic risk, following the methodology established by Gilchrist and Zakrajšek (2012) in their excess bond premium research. The model incorporates the ICE BofA High Yield Master II Option-Adjusted Spread as a proxy for credit market stress.
Threshold Calibration:
- Normal conditions: < 350 basis points
- Elevated risk: 350-500 basis points
- Severe stress: > 500 basis points
#### Currency and Commodity Stress Indicators
The US Dollar Index (DXY) momentum serves as a risk-off indicator, while the Gold-to-Oil ratio captures commodity market stress dynamics. This approach follows the methodology of Akram (2009) and Beckmann, Berger, and Czudaj (2015) in analyzing commodity-currency relationships during market stress.
### 2. Technical Analysis Factors
#### Multi-Timeframe Moving Average Analysis
The technical component incorporates the well-established moving average convergence methodology, drawing from the work of Brock, Lakonishok, and LeBaron (1992), who provided empirical evidence for the profitability of technical trading rules.
Implementation:
- Price relative to 50-day and 200-day simple moving averages
- Moving average convergence/divergence analysis
- Multi-timeframe MACD assessment (daily and weekly)
#### Momentum and Volatility Analysis
The model integrates Relative Strength Index (RSI) analysis following Wilder's (1978) original methodology, combined with maximum drawdown analysis based on the work of Magdon-Ismail and Atiya (2004) on optimal drawdown measurement.
### 3. Market Sentiment Factors
#### Volatility Index Analysis
The VIX component follows the established research of Whaley (2009) and subsequent work by Bekaert and Hoerova (2014) on VIX as a predictor of market stress. The model incorporates both absolute VIX levels and relative VIX spikes compared to the 20-day moving average.
Calibration:
- Low volatility: VIX < 20
- Elevated concern: VIX 20-25
- High fear: VIX > 25
- Panic conditions: VIX > 30
#### Put-Call Ratio Analysis
Options flow analysis through put-call ratios provides insight into sophisticated investor positioning, following the methodology established by Pan and Poteshman (2006) in their analysis of informed trading in options markets.
### 4. Market Breadth Factors
#### Advance-Decline Analysis
Market breadth assessment follows the classic work of Fosback (1976) and subsequent research by Brown and Cliff (2004) on market breadth as a predictor of future returns.
Components:
- Daily advance-decline ratio
- Advance-decline line momentum
- McClellan Oscillator (Ema19 - Ema39 of A-D difference)
#### New Highs-New Lows Analysis
The new highs-new lows ratio serves as a market leadership indicator, based on the research of Zweig (1986) and validated in academic literature by Zarowin (1990).
## Dynamic Threshold Methodology
The model incorporates adaptive thresholds based on rolling volatility and trend analysis, following the methodology established by Pagan and Sossounov (2003) for business cycle dating. This approach allows the model to adjust sensitivity based on prevailing market conditions.
Dynamic Threshold Calculation:
- Warning Level: Base threshold ± (Volatility × 1.0)
- Danger Level: Base threshold ± (Volatility × 1.5)
- Bounds: ±10-20 points from base threshold
## Professional Implementation
### Institutional Usage Patterns
Professional risk managers typically employ multi-factor bear market models in several contexts:
#### 1. Portfolio Risk Management
- Tactical Asset Allocation: Reducing equity exposure when probability exceeds 60-70%
- Hedging Strategies: Implementing protective puts or VIX calls when warning thresholds are breached
- Sector Rotation: Shifting from growth to defensive sectors during elevated risk periods
#### 2. Risk Budgeting
- Value-at-Risk Adjustment: Incorporating bear market probability into VaR calculations
- Stress Testing: Using probability levels to calibrate stress test scenarios
- Capital Requirements: Adjusting regulatory capital based on systemic risk assessment
#### 3. Client Communication
- Risk Reporting: Quantifying market risk for client presentations
- Investment Committee Decisions: Providing objective risk metrics for strategic decisions
- Performance Attribution: Explaining defensive positioning during market stress
### Implementation Framework
Professional traders typically implement such models through:
#### Signal Hierarchy:
1. Probability < 30%: Normal risk positioning
2. Probability 30-50%: Increased hedging, reduced leverage
3. Probability 50-70%: Defensive positioning, cash building
4. Probability > 70%: Maximum defensive posture, short exposure consideration
#### Risk Management Integration:
- Position Sizing: Inverse relationship between probability and position size
- Stop-Loss Adjustment: Tighter stops during elevated risk periods
- Correlation Monitoring: Increased attention to cross-asset correlations
## Strengths and Advantages
### 1. Comprehensive Coverage
The model's primary strength lies in its multi-dimensional approach, avoiding the single-factor bias that has historically plagued market timing models. By incorporating macroeconomic, technical, sentiment, and breadth factors, the model provides robust risk assessment across different market regimes.
### 2. Dynamic Adaptability
The adaptive threshold mechanism allows the model to adjust sensitivity based on prevailing volatility conditions, reducing false signals during low-volatility periods and maintaining sensitivity during high-volatility regimes.
### 3. Real-Time Processing
Unlike traditional academic models that rely on monthly or quarterly data, this indicator processes daily market data, providing timely risk assessment for active portfolio management.
### 4. Transparency and Interpretability
The component-based structure allows users to understand which factors are driving risk assessment, enabling informed decision-making about model signals.
### 5. Historical Validation
Each component has been validated in academic literature, providing theoretical foundation for the model's predictive power.
## Limitations and Weaknesses
### 1. Data Dependencies
The model's effectiveness depends heavily on the availability and quality of real-time economic data. Federal Reserve Economic Data (FRED) updates may have lags that could impact model responsiveness during rapidly evolving market conditions.
### 2. Regime Change Sensitivity
Like most quantitative models, the indicator may struggle during unprecedented market conditions or structural regime changes where historical relationships break down (Taleb, 2007).
### 3. False Signal Risk
Multi-factor models inherently face the challenge of balancing sensitivity with specificity. The model may generate false positive signals during normal market volatility periods.
### 4. Currency and Geographic Bias
The model focuses primarily on US market indicators, potentially limiting its effectiveness for global portfolio management or non-USD denominated assets.
### 5. Correlation Breakdown
During extreme market stress, correlations between risk factors may increase dramatically, reducing the model's diversification benefits (Forbes and Rigobon, 2002).
## References
Akram, Q. F. (2009). Commodity prices, interest rates and the dollar. Energy Economics, 31(6), 838-851.
Ang, A., Piazzesi, M., & Wei, M. (2006). What does the yield curve tell us about GDP growth? Journal of Econometrics, 131(1-2), 359-403.
Baker, M., & Wurgler, J. (2006). Investor sentiment and the cross‐section of stock returns. The Journal of Finance, 61(4), 1645-1680.
Baker, S. R., Bloom, N., & Davis, S. J. (2016). Measuring economic policy uncertainty. The Quarterly Journal of Economics, 131(4), 1593-1636.
Barber, B. M., & Odean, T. (2001). Boys will be boys: Gender, overconfidence, and common stock investment. The Quarterly Journal of Economics, 116(1), 261-292.
Beckmann, J., Berger, T., & Czudaj, R. (2015). Does gold act as a hedge or a safe haven for stocks? A smooth transition approach. Economic Modelling, 48, 16-24.
Bekaert, G., & Hoerova, M. (2014). The VIX, the variance premium and stock market volatility. Journal of Econometrics, 183(2), 181-192.
Brock, W., Lakonishok, J., & LeBaron, B. (1992). Simple technical trading rules and the stochastic properties of stock returns. The Journal of Finance, 47(5), 1731-1764.
Brown, G. W., & Cliff, M. T. (2004). Investor sentiment and the near-term stock market. Journal of Empirical Finance, 11(1), 1-27.
Campbell, J. Y., & Shiller, R. J. (1998). Valuation ratios and the long-run stock market outlook. The Journal of Portfolio Management, 24(2), 11-26.
Dow, C. H. (1901). Scientific stock speculation. The Magazine of Wall Street.
Estrella, A., & Mishkin, F. S. (1998). Predicting US recessions: Financial variables as leading indicators. Review of Economics and Statistics, 80(1), 45-61.
Fama, E. F., & French, K. R. (1989). Business conditions and expected returns on stocks and bonds. Journal of Financial Economics, 25(1), 23-49.
Forbes, K. J., & Rigobon, R. (2002). No contagion, only interdependence: measuring stock market comovements. The Journal of Finance, 57(5), 2223-2261.
Fosback, N. G. (1976). Stock market logic: A sophisticated approach to profits on Wall Street. The Institute for Econometric Research.
Gilchrist, S., & Zakrajšek, E. (2012). Credit spreads and business cycle fluctuations. American Economic Review, 102(4), 1692-1720.
Harvey, C. R. (1988). The real term structure and consumption growth. Journal of Financial Economics, 22(2), 305-333.
Kahneman, D., & Tversky, A. (1979). Prospect theory: An analysis of decision under risk. Econometrica, 47(2), 263-291.
Magdon-Ismail, M., & Atiya, A. F. (2004). Maximum drawdown. Risk, 17(10), 99-102.
Nickerson, R. S. (1998). Confirmation bias: A ubiquitous phenomenon in many guises. Review of General Psychology, 2(2), 175-220.
Pagan, A. R., & Sossounov, K. A. (2003). A simple framework for analysing bull and bear markets. Journal of Applied Econometrics, 18(1), 23-46.
Pan, J., & Poteshman, A. M. (2006). The information in option volume for future stock prices. The Review of Financial Studies, 19(3), 871-908.
Taleb, N. N. (2007). The black swan: The impact of the highly improbable. Random House.
Whaley, R. E. (2009). Understanding the VIX. The Journal of Portfolio Management, 35(3), 98-105.
Wilder, J. W. (1978). New concepts in technical trading systems. Trend Research.
Zarowin, P. (1990). Size, seasonality, and stock market overreaction. Journal of Financial and Quantitative Analysis, 25(1), 113-125.
Zweig, M. E. (1986). Winning on Wall Street. Warner Books.

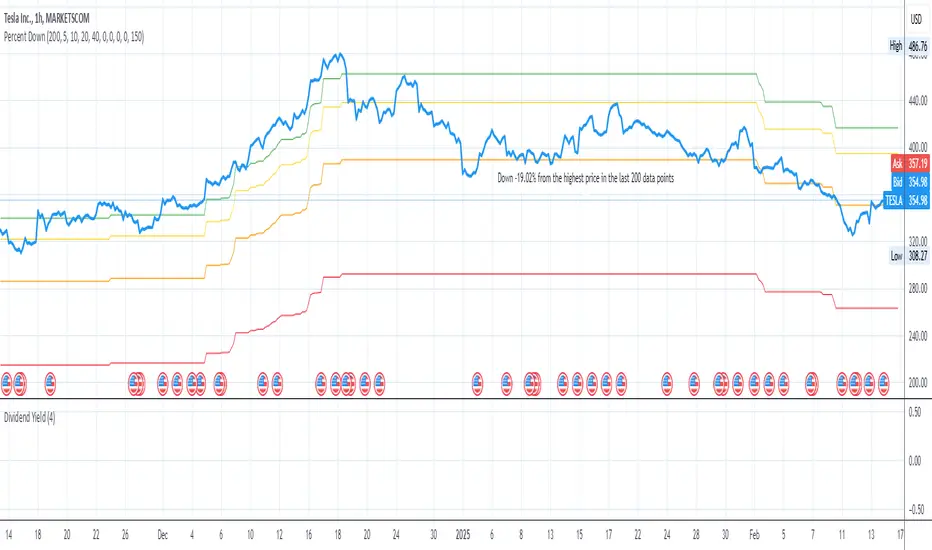
Price Target Pullback Correction or BearPrice Target percent drop is an indicator that allows you to set default percentage down from the 52 week high.
A pullback, correction, bear and a bear market is marked as a 5%, 10%, 20% or 40% drop from the 52 week highest price, so this will show the target price to buy at if these thresholds are hit.
You can change the default values of 5%, 10%, 20% and 40% to any percentage and the price will reflect the change of the default value. Furthermore, the default to use 52 weeks can be changed to find the highest price from the last 26 weeks or 104 weeks.
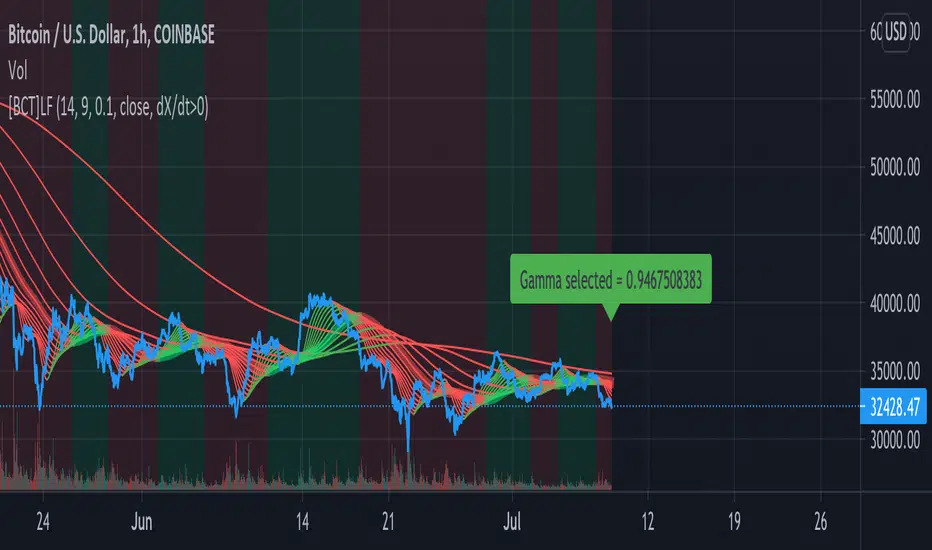
[BCT] Identify BULL / BEAR regimes - Laguerre FilterThe Adaptive Laguerre is based on the Laguerre filter, described by John Ehlers in his paper “Time Warp – Without Space Travel”
forex-station.com
MAs obtained using a Laguerre filter tend to have much lower lag than MAs obtained from an SMA or EMA.
Use cases:
- Identify market regime (BULL vs BEAR)
- Smooth out a noisy signal (e.g. apply to RSI, prices, log returns, variance, etc) without adding excessive lag
Highlight based on:
- Smoothed indicator > or < 0
- Derivative of the indicator ("speed") > or < 0
- Second derivative of the indicator ("acceleration" or "momentum") > or < 0
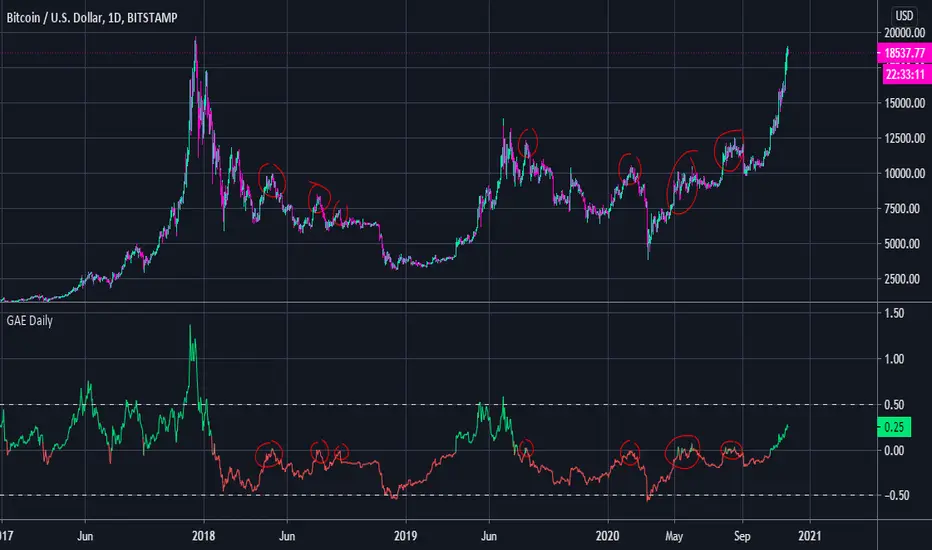
General Accumulation Evaluation BULL or BEAR Daily TrendGeneral Accumulation Evaluation by Lordchicken aka Chikun
This indicator is ONLY useful on the daily time frame and ONLY on BTC.
It will show you the general trend of BTC.
Basic:
X > 0 = Bullish trend
X < 0 = Bearish trend
X > 0.5 = Overbought
X < -0.5 = Oversold
Advanced:
If X < 0 and tries to go above 0 that's a good place to short
The end of a Bull/Bear trend is often shown with a strong reaction of X going above/beneath 0.
NSDT Background Bear Bull DayA very basic script that changes the background color of the chart to Green if the price closes over the previous day close, and to Red if the price closes under the previous day close. This allows you to easily see if it is currently a Bull or Bear market with a glance. Alerts added.
Bullish and Bearish by NicolErazoFThis indicator changes the color of the candlesticks when there’s a change in the trend to the rising or falling trend.
BEARISH ENGULFING: Yellow candlestick. It is an engulfing falling trend reversal; you must make a sell decision.
BEARISH HARAMI: White candlestick. Indicates a possible falling trend change, you must be alert for a possible sale.
BULLISH ENGULFING: Black candlestick. It is a change in the engulfing rising trend, you must make a purchase decision.
BULLISH HARAMI: Blue candlestick. Indicates a possible rising trend change, you should be alert for a possible purchase.
On the chart, you can see the 4 candles, on September 11 the black candle appears indicating a change in the uptrend. But today, the white candle is seen, which appears on September 8, indicating a rebound with a possible change in trend to bearish.
Previous days, on August 26, you see the blue candle with a possible change in the upward trend, which then, on August 28, a yellow candle appears with a change in the downward trend.
The Engulfing indicator (yellow and black) says that the candle has an engulfing change that is radical.
On the other hand, the Harami (blue and white) indicates a possible change in trend that must be previously analyzed.
Harami candles are smaller than Engulfing candles, since Harami in a Japanese term that means pregnancy, where the previous candle is the woman and the next candle is the baby.
___________________________________________________________________________
ESPAÑOL
Este indicador cambia las velas de color cuando ocurre un cambio de tendencia ALCISTA o BAJISTA
BEARISH ENGULFING: Vela de color amarillo. Es una cambio de tendencia bajista envolvente, debes tomar una decisión de venta.
BEARISH HARAMI: Vela de color blanco. Indica un posible cambio de tendencia bajista, debes estar alerta para una posible venta.
BULLISH ENGULFING: Vela de color negro. Es un cambio de tendencia alcista envolvente, debes tomar una decisión de compra.
BULLISH HARAMI: Vela de color azul. Indica un posible cambio de tendencia alcista, debes estar alerta para una posible compra.
En el gráfico, se pueden ver las 4 velas, el 11 de Septiembre aparece la vela negra que indica un cambio de tendencia alcista. Pero hoy, se ve la vela blanca, que aparece el 8 de septiembre, indicando un rebote con un posible cambio de tendencia a bajista.
Días anteriores, el 26 de Agosto, se ve la vela azul con un posible cambio de tendencia alcista, que luego, el 28 de agosto aparece una vela amarilla con cambio de tendencia bajista.
El indicador Engulfing (amarillo y negro) dice que la vela tiene un cambio envolvente que es radical.
En cambio, el Harami (azul y blanco) indica un posible cambio de tendencia que debe ser previamente analizado.
Las velas Harami son más pequeñas que las Engulfing , ya que Harami en un término japonés que significa embarazo, en donde la vela anterior es la mujer y la vela siguiente es el bebé.

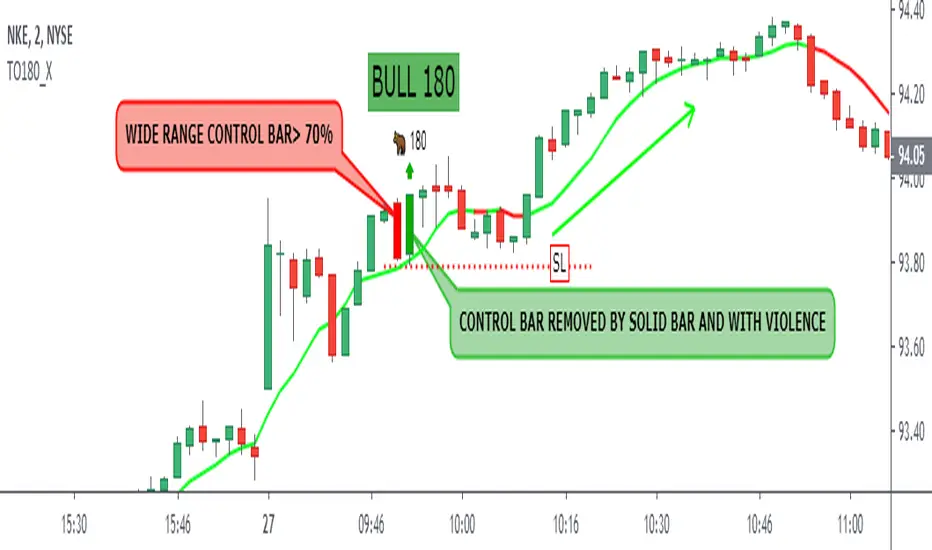
Bull Bear 180 by Oliver VelezThis script detects an event created by Oliver Velez is called Bull / Bear 180, in the following images the event is detailed:
- The size of the control bar can be set compared to a number of previous bars
- The minimum % of the control bar body can be set
- You can filter by trend
- Possibility of seeing fast and slow media with direction detection and color change
- Various graphic settings
- Event alerts
To enjoy!
A thumbs up if you like me!