在腳本中搜尋"bear"

Combo Strategy 123 Reversal & Bear Power This is combo strategies for get
a cumulative signal. Result signal will return 1 if two strategies
is long, -1 if all strategies is short and 0 if signals of strategies is not equal.
First strategy
This System was created from the Book "How I Tripled My Money In The
Futures Market" by Ulf Jensen, Page 183. This is reverse type of strategies.
The strategy buys at market, if close price is higher than the previous close
during 2 days and the meaning of 9-days Stochastic Slow Oscillator is lower than 50.
The strategy sells at market, if close price is lower than the previous close price
during 2 days and the meaning of 9-days Stochastic Fast Oscillator is higher than 50.
Second strategy
Bear Power Indicator
To get more information please see "Bull And Bear Balance Indicator"
by Vadim Gimelfarb.
WARNING:
- For purpose educate only
- This script to change bars colors.

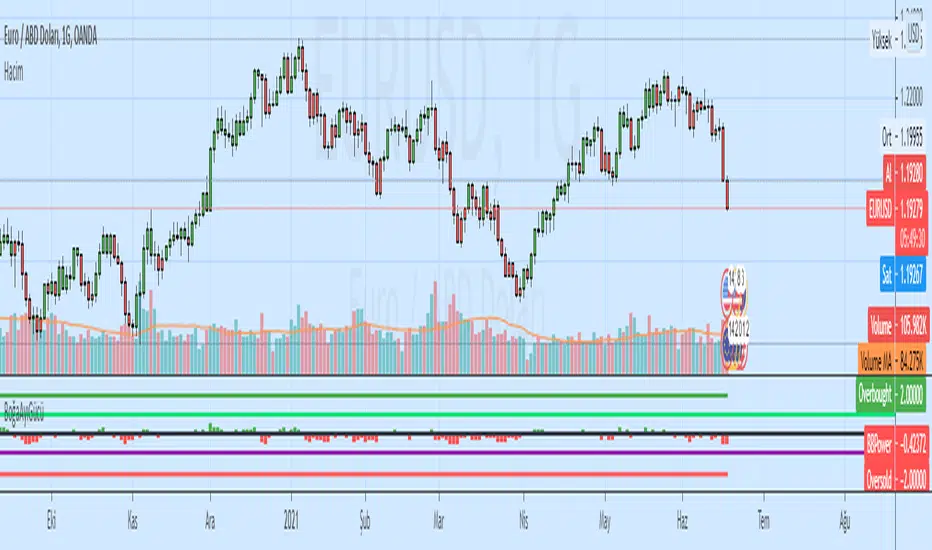
Bull&Bear Signals by uykusuzpenguenHow to use Bull&Bear Signals Script
Purpose: We developed this indicator for short and middle term buyer and seller small inverstor.
Scope of Script: This script should use stock markets and digital currency markets. We are not recommend this script for use in any other assets.
General Approaching: While this script creating, mostly take support, highest high price & lowest low price, volume and RSI . We strongly recommending to use 4h,1d,1w time frame on the graph.
Notation:
Purple Point: If a bar volume more than volume moving average four times
Grey Point : If a bar volume less than volume moving average four times
Turquois Bar Color : If a bar RSI level more than 75 ( Overbought areas )
Purple Bar Color : If a bar RSI level less than 25 ( Oversell areas )
Note: We don’t want all your graphs filling text and line etc. But generally spectacular price movement become after that points. That’s why we think this notation will be usefull.
Important Warning: Please do your risk management . This formula does not eliminate the possibility that it may mislead you in the next process.
Take risk and set a stop-loss
HIGH & LOW STRATEGY
This scripts calculate previous 3 bar from current bar to prev. 26 bar highest high and lowest lowe price and drawing on board. This lines just like a bollinger band but not. If price closing upper line , price wants to down and if price closing bottom line , price wants to up, like a bollinger band. But we will not to use this script like this
PRINCIPLE :
For safety buy point ; Price should fall bottom line and again rise over the bottom line completely.
For sell point ; Price should rise over the upper line and again fall the upper line completely.
For Detailed Description in English : drive.google.com
Detaylı Türkçe Anlatım için : drive.google.com

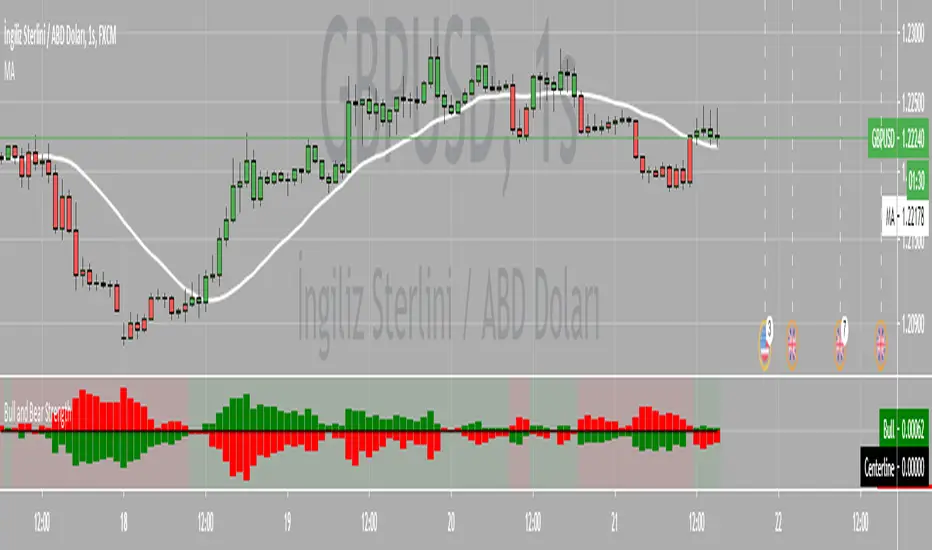
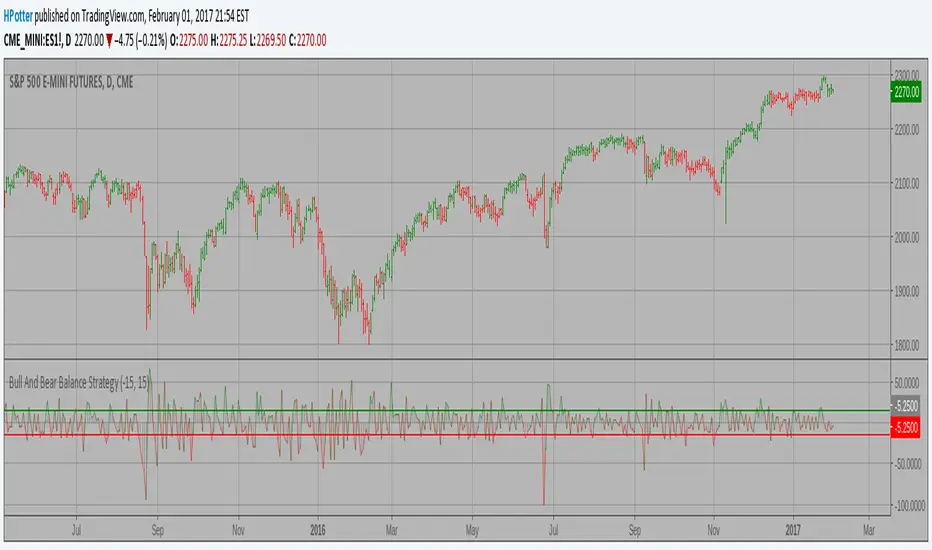
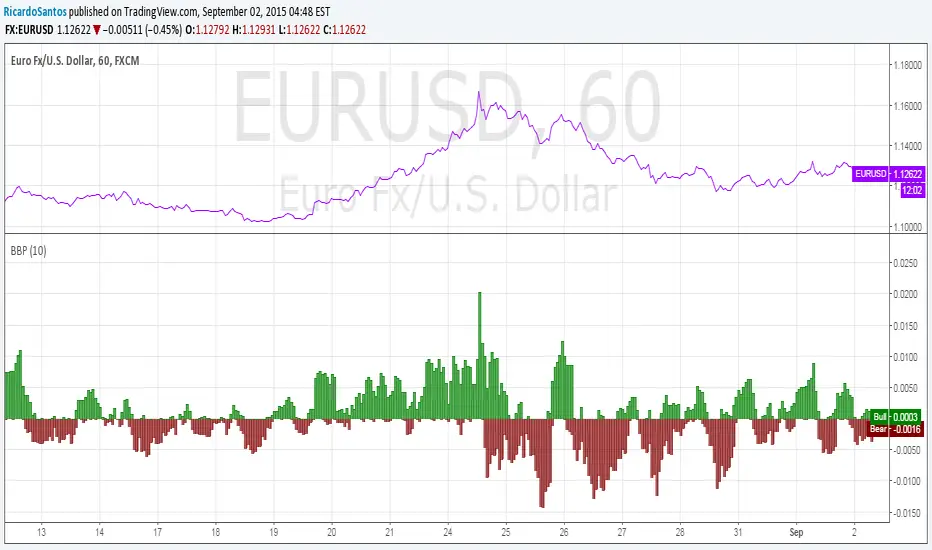
Bull And Bear Balance Strategy This new indicator analyzes the balance between bullish and
bearish sentiment.
One can cay that it is an improved analogue of Elder Ray indicator.
To get more information please see "Bull And Bear Balance Indicator"
by Vadim Gimelfarb.
[RS]Linear Regression Bull and Bear Power Accumulation V1EXPERIMENTAL:
Bull and Bear power based on linear regression (this is a non lagging oscillator, the parameter are for the lookup window for the donchian extremes)
this indicator can also be used for convergence/divergence.
(accidentjev2) added multi timeframe support (indicator may repaint values)

[RS]Linear Regression Bull and Bear Power V0EXPERIMENTAL:
Bull and Bear power based on linear regression (this is a non lagging oscillator, the parameter are for the lookup window for the donchian extremes)
this indicator can also be used for convergence/divergence.
Madrid Bull/Bear TerritoryThis study displays a background in four colors, lime, green, red, maroon, lime = Bull Territory, red = Bear Territory, green = possible reversal to Bear Territory, maroon = possible reversal to Bull Territory.
Trading with the basic rule, go long on a Bull Market and short a Bear Market.
This study can be used inside the main window, or by unmerging/merging it can be used as a standalone or in combination with other indicators.
The parameters defined by default reduce choppiness and false signals, but just like any other indicator, there is a trade off between fast response and choppiness. The smaller the parameters the faster response, but the more choppiness.
This indicator is built using three EMA's, two (the bigger ones) are used to define the trend direction, and the fastest one is used as a signal, when the signal breaks out the trend indicators to the downside we're in Bear Market, when the signal breaks out to the upside, we're in Bull Market, any thing in between is either a trend reversal or trend continuation.
Momentum indicators and price pattern analysis are recommended to determine the direction of the trend.

Elder Ray (Bear Power) Strategy Developed by Dr Alexander Elder, the Elder-ray indicator measures buying
and selling pressure in the market. The Elder-ray is often used as part
of the Triple Screen trading system but may also be used on its own.
Dr Elder uses a 13-day exponential moving average (EMA) to indicate the
market consensus of value. Bear Power measures the ability of sellers to
drive prices below the consensus of value. Bear Power reflects the ability
of sellers to drive prices below the average consensus of value.
Bull Power is calculated by subtracting the 13-day EMA from the day's High.
Bear power subtracts the 13-day EMA from the day's Low.
You can use in the xPrice any series: Open, High, Low, Close, HL2, HLC3, OHLC4 and ect...
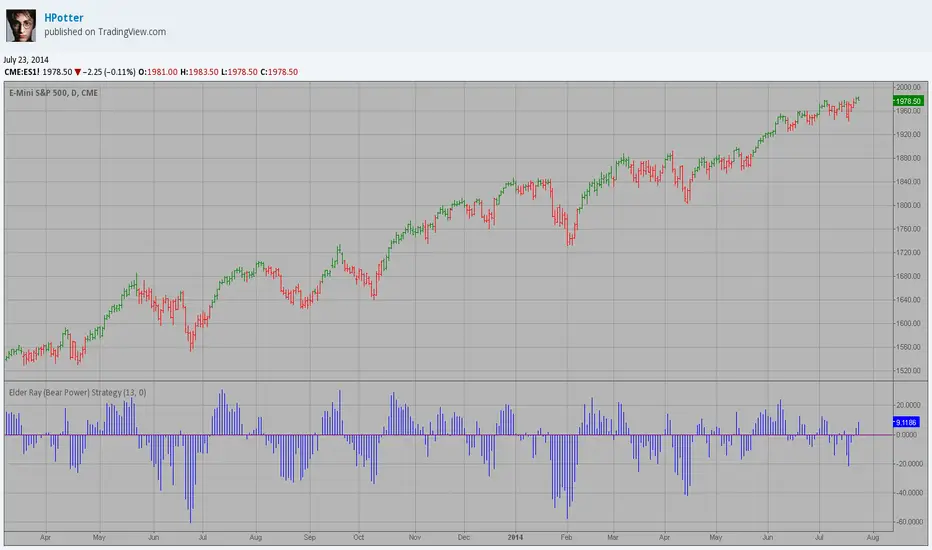
Elder Ray (Bear Power) Developed by Dr Alexander Elder, the Elder-ray indicator measures buying
and selling pressure in the market. The Elder-ray is often used as part
of the Triple Screen trading system but may also be used on its own.
Dr Elder uses a 13-day exponential moving average (EMA) to indicate the
market consensus of value. Bear Power measures the ability of sellers to
drive prices below the consensus of value. Bear Power reflects the ability
of sellers to drive prices below the average consensus of value.
Bull Power is calculated by subtracting the 13-day EMA from the day's High.
Bear power subtracts the 13-day EMA from the day's Low.
You can use in the xPrice any series: Open, High, Low, Close, HL2, HLC3, OHLC4 and ect...

Bull And Bear Balance Indicator Hi
Let me introduce my Bull And Bear Balance Indicator script.
This new indicator analyzes the balance between bullish and
bearish sentiment.
One can cay that it is an improved analogue of Elder Ray indicator.
To get more information please see "Bull And Bear Balance Indicator"
by Vadim Gimelfarb

Stacked Bullish vs Bearish VolumeThis indicator visually represents buying (bullish) and selling (bearish) pressure within each candle by stacking both portions inside a single volume bar. Unlike traditional volume indicators that use only one color per bar, this script splits each volume bar into two segments:
Green portion (Bullish Volume) → Represents the buying pressure when the price moves up.
Red portion (Bearish Volume) → Represents the selling pressure when the price moves down.
By stacking buy and sell volume inside the same column, traders can easily assess the balance of buying vs selling activity within each trading session.
Stacking the Bars:
The bullish portion (green) is plotted first.
The bearish portion (red) is plotted slightly offset to create a stacked effect.

Average Bullish & Bearish Percentage ChangeAverage Bullish & Bearish Percentage Change
Processes two key aspects of directional market movements relative to price levels. Unlike traditional momentum tools, it separately calculates the average of positive and negative percentage changes in price using user-defined independent counts of actual past bullish and bearish candles. This approach delivers comprehensive and precise view of average percentage changes.
FEATURES:
Count-Based Averages: Separate averaging of bullish and bearish %𝜟 based on their respective number of occurrences ensures reliable and precise momentum calculations.
Customizable Averaging: User-defined number of candle count sets number of past bullish and bearish candles used in independent averaging.
Two Methods of Candle Metrics:
1. Net Move: Focuses on the body range of the candle, emphasizing the net directional movement.
2. Full Capacity: Incorporates wicks and gaps to capture full potential of the bar.
The indicator classifies Doji candles contextually, ensuring they are appropriately factored into the bullish or bearish metrics to avoid mistakes in calculation:
1. Standard Doji - open equals close.
2. Flat Close Doji - Candles where the close matches the previous close.
Timeframe Flexibility:
The indicator can be applied across any desired timeframe, allowing for seamless multi-timeframe analysis.
HOW TO USE
Select Method of Bar Metrics:
Net Move: For analyzing markets where price changes are consistent and bars are close to each other.
Full Capacity: Incorporates wicks and gaps, providing relevant figures for markets like stocks
Set the number of past candles to average:
🟩 Average Past Bullish Candles (Default: 10)
🟥 Average Past Bullish Candles (Default: 10)
Why Percentage Change Is Important
Standardized Measurement Across Assets:
Percentage change normalizes price movements, making it easier to compare different assets with varying price levels. For example, a $1 move in a $10 stock is significant, but the same $1 move in a $1,000 stock is negligible.
Highlights Relative Impact:
By measuring the price change as a percentage of the close, traders can better understand the relative impact of a move on the asset’s overall value.
Volatility Insights:
A high percentage change indicates heightened volatility, which can be a signal of potential opportunities or risks, making it more actionable than raw price changes. Percents directly reflect the strength of buying or selling pressure, providing a clearer view of momentum compared to raw price moves, which may not account for the relative size of the move.
By focusing on percentage change, this indicator provides a normalized, actionable, and insightful measure of market momentum, which is critical for comparing, analyzing, and acting on price movements across various assets and conditions.

RCYC Bullish Bearish Indicator
Summary: The RCYC Bullish Bearish Indicator is a custom trading tool designed to help traders identify potential bullish and bearish conditions in the market using a combination of KDJ and RSI indicators. This indicator uses color-coded candles to visually represent bullish and bearish signals, making it easy to identify trend changes on the chart. The script is particularly useful for traders who prefer visual signals and want to incorporate both trend momentum (KDJ) and relative strength (RSI) in their analysis.
Description:
The RCYC Bullish Bearish Indicator is a unique mashup of the KDJ and RSI indicators, optimized to provide a clear visual representation of market conditions through color-coded candles. This indicator not only identifies the potential trend shifts but also provides alerts for significant crossover points, enhancing a trader's ability to make informed decisions.
How It Works:
KDJ Calculation:
The KDJ is a variation of the Stochastic Oscillator that includes the %J line, which can go beyond the typical 0-100 range of %K and %D.
The KDJ component of this indicator calculates the highest high and lowest low over a specified period (KDJ Length), using these values to derive the %K line.
The %D line is a smoothed version of %K, and the %J line is derived from %K and %D using the formula: J = 3 * %K - 2 * %D.
This indicator focuses on the behavior of the %J line in relation to a mid-point level (50), identifying crossovers and crossunders that signal potential shifts in market sentiment.
RSI Calculation:
The Relative Strength Index (RSI) is a momentum oscillator that measures the speed and change of price movements. It is widely used to identify overbought or oversold conditions.
In this indicator, RSI values are adjusted and plotted to align visually with the KDJ values, providing a complementary momentum analysis.
Crossover Logic and Candle Coloring:
The indicator tracks two main events:
CrossOver50: When the %J line crosses above the 50 level, indicating potential bullish momentum.
CrossUnder50: When the %J line crosses below the 50 level, indicating potential bearish momentum.
Depending on the crossover events, the script changes the color of the candles on the chart:
Red candles on the initial crossover above 50, followed by dark blue candles to maintain bullish sentiment.
Yellow candles on the initial crossover below 50, followed by light blue candles to maintain bearish sentiment.
Alerts:
The indicator includes alert conditions for both bullish and bearish signals:
Red Candle Alert: Notifies the trader when the %J line crosses above 50.
Yellow Candle Alert: Notifies the trader when the %J line crosses below 50.
These alerts allow traders to react promptly to key market signals without continuously monitoring the chart.
Usage and Benefits:
This indicator is designed for traders looking to combine momentum and trend analysis into a single visual tool. It is particularly useful for those trading in trending markets or looking for entry/exit signals based on momentum shifts.
The color-coded candles provide an intuitive way to assess market conditions at a glance, reducing the complexity associated with analyzing multiple indicators separately.
By integrating both KDJ and RSI, the RCYC Bullish Bearish Indicator offers a balanced approach to trend detection and momentum confirmation, making it versatile for various trading styles, including scalping, swing trading, and position trading.
Originality and Usefulness:
While the indicator builds upon the familiar concepts of KDJ and RSI, it uniquely merges them into a cohesive visual tool with distinct crossover-based alerts and candle coloring.
This approach makes the indicator original, as it simplifies the interpretation of complex signals into straightforward visual cues, enhancing the decision-making process for traders who prefer chart-based analysis.

Truly Bullish & Bearish CandleThis Pine Script indicator identifies and highlights truly bullish and bearish candles on your chart. Truly bullish candles are characterized by a strong bullish close significantly above the specific percentage, suggesting strong buying pressure. Conversely, truly bearish candles exhibit a strong bearish close significantly below the specific percentage, indicating strong selling pressure. By identifying these candles, traders can gain insights into potential shifts in market sentiment and make more informed trading decisions.
Key Features:
Identifies truly bullish and bearish candles based on strong open/close differentials.
Highlights these candles on the chart for easy visualization.
Helps traders identify potential reversals or continuations in market trends.
Customizable parameters for fine-tuning to suit individual trading strategies.
Compatible with various timeframes and trading instruments.
Usage Instructions:
Apply the indicator to your chart.
Configure the settings according to your preferences.
Look for highlighted truly bullish and bearish candles as potential entry or exit signals.
Consider additional analysis and risk management strategies to confirm trading decisions.
Disclaimer: This indicator is provided for informational and educational purposes only. It is not intended as financial advice or trading recommendations. Trading involves risks, and it's essential to conduct thorough research and practice proper risk management techniques.

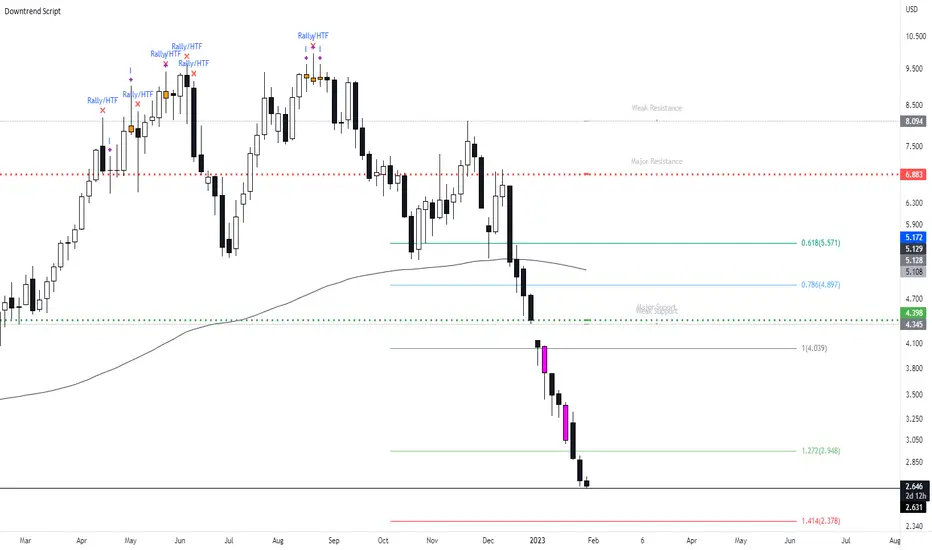
New Bearish Downtrend Script - Perfect for Short SellingIts been a while since i last uploaded a script, what i have for you today is a script which works very efficiently for downtrends and spotting reversals. This is a script i use on a weekly basis when looking to short sell.
This script includes :
Updated** Rally Candles for HTF and LTF ( End of Impulsive move signal) - The psychology of the candle when used with market information can be viewed as a end or near to the end of a big impulsive leg - when this candle occurs in BEARISH CONDITIONS, we can assume price is likely to move away short term.
Major and Minor Support Levels HTF (Areas of interest)
The Psychology on these levels is price will do something at these key levels - it takes in the last quarter price action of High Open Low Close to generate the price levels and when price comes into these areas we are likely to see a bounce or rejection from this area.
Bearish Breakout Volume Candle - This candle will paint a Purple colour bar when volume breaks above the 7day average - this shows strong momentum in the market and will usually be seen when price is in a downtrend with strong momentum.. However when this does occur we can expect a short term bounce or base so don't trade the volume bar alone.
Indecision Candles - Psychology of this candle is to show exhaustion in the trend and ideally what to see this candle appear with Rally Candles at key areas for stronger set up. When the trend is moving up, the bearish doji can appear - i tend to look at this situation as a pause in the trend.
200 EMA
Everything in this script has alert conditions to provide an edge in the markets
This is an example of how the script will look on the HTF I'm using the Daily Timeframe for reference on TSLA
This is an example of how the script looks like on the LTF, price hit the Major Resistance twice and failed to hit the 3rd time and on each leg of the impulse, the chart portrayed the LTF Rally Candles
Heres an example on how to use both Major Resistance ( Area of Interest) Rally Candle and Volume Breakout as a trade set up idea - This setup idea was on Crude Oil last week and into this week.
When added to confluences such as Supply Zones, Mitigation Levels, Quasimodo patterns etc... this will enhance the script.
I will answer any questions if i haven't made the script clear or take any requests to improve the script.
Also will be uploading the Bullish Uptrend Script soon.
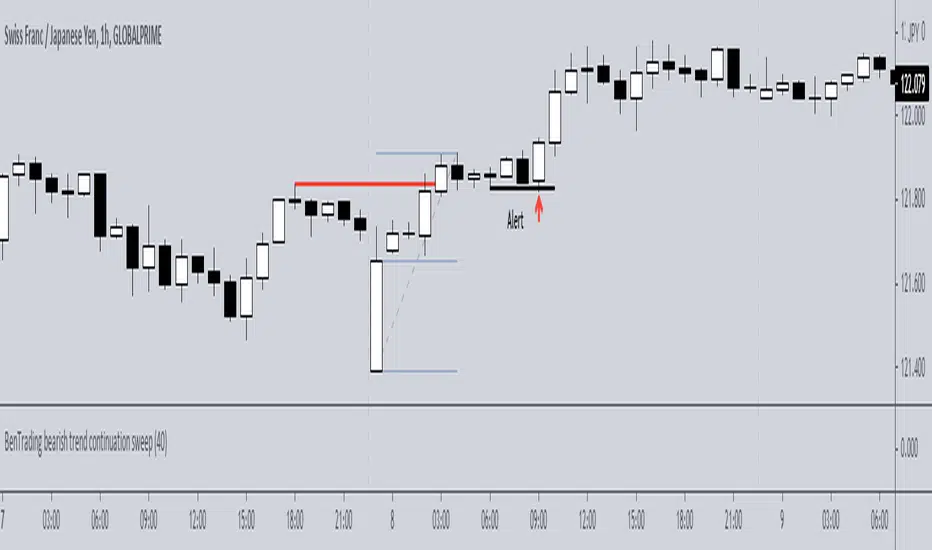
BenTrading bearish trend continuation sweepThis script uses simple features to indicate where a trend may continue.
It uses market structures and monitors breaks of swing highs and swing lows.
If there is a break downwards, the alert will give signal when there is a sweep that forms in the biased direction (see chart - alert will trigger on candle close).
For it to send alerts you must right click the indicator and apply alert - "once per bar".
This indicator only shows bearish signals, while there is another indicator that can be used alongside it to indicate bullish trend continuation with the same features.
Bullish-Bearish OscillatorThis is my attemption to create oscillator that will show when the market is bullish and when its bearish . Fight between those two forces will be shown on the chart.
It is based on price action versus two moving averages.
* You can choose from 4 different MAs in settings: McGinley , SMA , EMA and VWAP .
* You can set up 2 Moving Averages (fast and slow)
* Amount of bars back from PriceAction versus MAs is calculated
ps. This script is invite-only for the members of our trading group (info in signature, group is free of charge).
Bullish/Bearish Candle Series DistributionThe tool counts the number of consecutive bullish or bearish candles in a row and build a distribution of those series lengths. The entire history of an instrument is used.
Available modes:
Strict Bullish ( close > open )
Bullish ( close >= open )
Strict Bearish ( close <= open )
Bearish ( close < open )
Different chart types have different distributions:
Renko
Line Break

[astropark] Bullish Bearish Divergences for all OscillatorsDear Followers,
today a new great Scalper Tool , which works excellent on all timeframes and charts , both FOREX and Cryptocurrencies!
It alerts you when a new divergence has been spotted on the chart based on your preferred oscillator or set of oscillators ( yes, you can combine them! )
Here the list of currently supported oscillators (more in the future):
RSI (Relative Strength Index)
MACD
MACD Histogram
Stochastic
Stochastic RSI
CCI (Commodity Channel Index)
Momentum
Volume Oscillator
OBV (On Balance Volume)
VWmacd
Bollinger Bands %B
William %R
Chaikin Money Flow
Chaikin Oscillator
AO (Awesome Oscillator)
DPO (Detrended Price Oscillator)
Ultimate Oscillator
RVI (Relative Volatility Index)
Klinger Oscillator
This script will let you set all notifications you may need in order to be alerted on each triggered divergence (both regular and hidden).
This script:
works on all timeframes , starting from 1 minute: so you can enjoy high-frequency trading by using a 24/7 running bot and a proper money and risk management strategy if you like
shows you both bullish and bearish divergences, both regular and hidden , with a triangle up or down respectively
lets you activate more than one oscillator at the same time
lets you choose to be alerted only if all active oscillators agree on spotted divergence , so you will get only stronger and more secure ones (you can set both all or at least a configurable number of enabled oscillators)
lets you edit basic configuration settings of each oscillator
lets you disable or enable hidden divergences on chart
This is a premium indicator , so send me a private message in order to get access to this script.


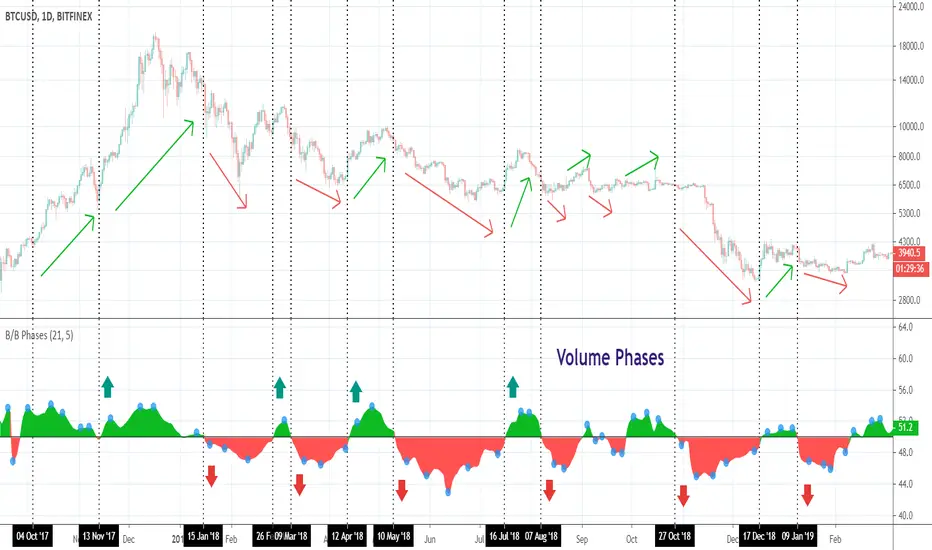
Bullish/Bearish PhasesHello traders!
This indicator shows you bullish or bearish dominance during the specified period and is based on the volume calculations. Why? Volume acts as an excellent confirmation tool of the price movements and is used to determine if an instrument is gaining or losing momentum.
Bullish/Bearish Phases can be used to find out divergences with the price. It will work on ANY instrument that has available volume data.
NOTE : The blue circles appear on the local peaks.
I attached some screenshots to show you how it works with other instruments.
Happy Trading!