Trend Volume RSI AnalysisHOW'S THIS INDICATOR DIFFERENT ?
If you are familiar with my work, then you would know that I am into creating indicators with tons of parameters, almost all of which are left for you to configure. While this gives you an incredible level of customization, the feedback I received was that some of you felt a bit overwhelmed by them.
As such, I decided to create an incredibly simple, yet effective indicator that can give you a better overview of what's going on with the security you are trading/investing in without you needing to tweak a dozen parameters. So, the first and most obvious difference you will notice with Trend Volume RSI Analysis is that you have only 1 parameter to configure (length), one checkbox to tick (highlight buy/sell zones), and one dropdown menu to choose from (the type of analysis). All unnecessary features are stripped away and all calculations are done on the backend. Now let's see if this simplicity affects the efficiency of the indicator.
HOW DOES THE INDICATOR WORK?
1. Trend Analysis
The first type of analysis, selected by default, is the Trend. It shows the balance between bulls and bears and their respective strength. In order to filter out the noise and smooth out the graph, a moving average is applied twice - once from left to right, and once from right to left. Although this causes a minor delay, it is justified since the common moving averages lag is significantly reduced. The screenshot below shows an example of a small bull run on the 1h chart.
The indicator also performs very well in spotting divergences. Two divergences (bearish and bullish respectively) are illustrated in the screenshot below.
2. Volume Analysis
Volume Analysis doesn't just sum the standard volume of the trend. Rather, it calculates the effective volume - the one responsible for moving the price up or down and seeks the relationship between total volume and price movement. Thus, you get a smooth volume trendline that should prevent you from opening a position against the trend. As logic dictates, if the buying volume is growing, then the trendline will go up and it will be in green. If, however, the selling volume is growing, the trendline will decline and it will be in red. This analysis is better used on a bigger time frame, such as on a 4h chart.
Note: For those of you who have used my other indicator Multi Time Frame Effective Volume Profile, the formula used here is slightly different. The one used there is optimized for volume bars, while the modifications here deliver a slightly better trendline with less noise.
3. RSI Analysis
Contrary to the standard RSI which derives its results from price movement, this RSI is calculated based on the modified volume. So it's fair to say that it's a Volume RSI. This makes it a bit jerkier, almost something in between an RSI and Stochastics. However, it is much better in identifying divergences and will quickly indicate potential trends as it will start climbing up sooner. The screenshot below is on a 4h chart, but that's only because I want to show more examples. It works equally well on the 1h or even on a minute chart.
In the first example, the divergence is pretty obvious on all three indicators. However, in example 2 you would be able to spot it only on Trend Volume RSI Analysis and somewhat in Stochastics. RSI makes a double bottom there. Similar is the case with example 3, where this indicator is long gone on the way up in comparison to the other two. The difference in reaction comes from the supply and demand relationship, not just from the price movement. When bears are losing steam, the indicator detects this as a low supply level, thus printing the divergence or even climbing up to indicate the start of a new mini-trend.
I must note, however, that this part of the indicator must be used in accordance with the main trend (this is where the other two analyses come into play). You go long on a pullback when there's an established bull trend and you go short on a pullback when there's an established bear trend.
4. Additional Settings
I know, for an indicator with just one parameter this description is getting pretty long. There's only one thing left to cover - highlighting the buy/sell zones. It is fairly simple - when it's ON, the zones where bulls are stronger than bears will be highlighted in green. When the opposite is true, the background will be red. You can switch it OFF if it intervenes with your analysis, but I prefer having it as it shows a confluence of bull/bear force and the indicator itself. Here's an example below:
HOW MUCH DOES THIS INDICATOR COST ?
Although Trend Volume RSI Analysis may look like an incredibly simple indicator, I can assure you that a great deal of time, testing, and optimizing have gone into creating an indicator that does almost everything for you. The initial version was much more complex and a few dozen iterations were required to reach that level of simplicity and practicality. Furthermore, I will continue to update this indicator as well as introduce user-requested features if they will improve its overall performance. To find out more about how to gain access to this indicator, please use the provided information below or just message me . Thank you for your time.
Disclaimer: The purpose of all indicators is to indicate potential setups, which may lead to profitable results. No indicator is perfect and certainly, no indicator has a 100% success rate. They are subject to flaws, wrongful interpretation, bugs, etc. This indicator makes no exception. It must be used with a sound money management plan that puts the main emphasis on protecting your capital. Please, do not rely solely on any single indicator to make trading decisions instead of you. Indicators are storytellers, not fortune tellers. They help you see the bigger picture, not the future.
在腳本中搜尋"bear"

[blackcat] L1 Composite RSI Trend OscillatorLevel: 1
Background
The Relative Strength Index (RSI) is a technical indicator for analyzing financial markets. It is intended to represent the current and historical strength or weakness of a trading pair or a market based on the closing prices of a last trading period.
Function
L1 Composite RSI Trend Oscillator utilizes candles to indicate trend. E.g. yellow candles for bull and fuchsia candles for bear. NOTE: it is inverted to RSI from bull bear perspective. Colorful RSI with yellow indicating bull and fuchsia indicating bear.
Key Signal
lwr1 --> trend oscillator fast line (lwr1 >= lwr2 for bear)
lwr2 --> trend oscillator slow line (lwr1 < lwr2 for bull)
botzone --> bottom zone indicates oversold with green
topzone --> top zone indicates overbought with red
longentry --> long entry signal
shortentry --> short entry signal
Pros and Cons
Pros:
1. combines both the benefit of RSI response and trend oscillator candles
2. divergence can be observed easily
Cons:
1. It may satruate for extreme conditions of long and short.
2. Not accurate for long and short entries and need filtering out noise and fake signal.
Remarks
NA
Readme
In real life, I am a prolific inventor. I have successfully applied for more than 60 international and regional patents in the past 12 years. But in the past two years or so, I have tried to transfer my creativity to the development of trading strategies. Tradingview is the ideal platform for me. I am selecting and contributing some of the hundreds of scripts to publish in Tradingview community. Welcome everyone to interact with me to discuss these interesting pine scripts.
The scripts posted are categorized into 5 levels according to my efforts or manhours put into these works.
Level 1 : interesting script snippets or distinctive improvement from classic indicators or strategy. Level 1 scripts can usually appear in more complex indicators as a function module or element.
Level 2 : composite indicator/strategy. By selecting or combining several independent or dependent functions or sub indicators in proper way, the composite script exhibits a resonance phenomenon which can filter out noise or fake trading signal to enhance trading confidence level.
Level 3 : comprehensive indicator/strategy. They are simple trading systems based on my strategies. They are commonly containing several or all of entry signal, close signal, stop loss, take profit, re-entry, risk management, and position sizing techniques. Even some interesting fundamental and mass psychological aspects are incorporated.
Level 4 : script snippets or functions that do not disclose source code. Interesting element that can reveal market laws and work as raw material for indicators and strategies. If you find Level 1~2 scripts are helpful, Level 4 is a private version that took me far more efforts to develop.
Level 5 : indicator/strategy that do not disclose source code. private version of Level 3 script with my accumulated script processing skills or a large number of custom functions. I had a private function library built in past two years. Level 5 scripts use many of them to achieve private trading strategy.

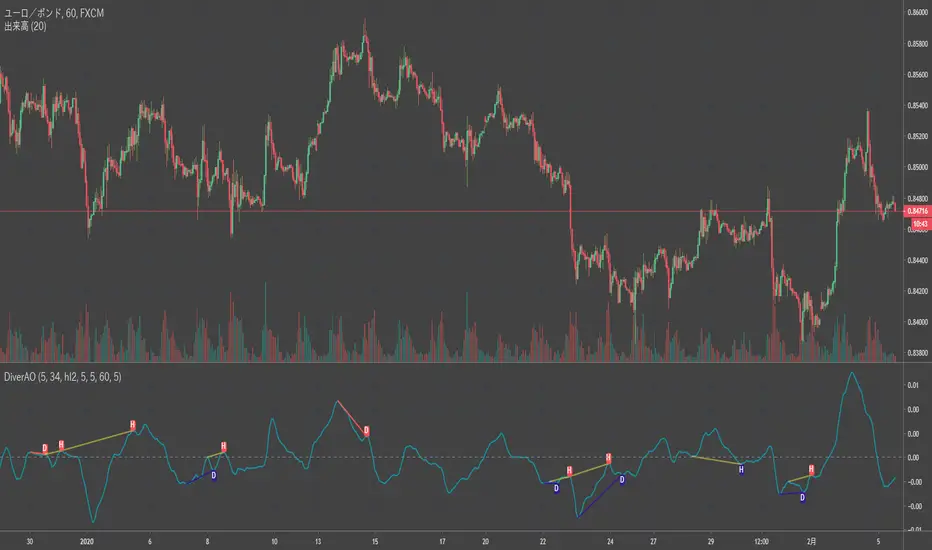
Divergence RSI [mado]Divergence screener for OBV RSI
Regular Bullish: "D" navy label
Hidden Bullish: "H" navy label
Regular Bearish: "D" red label
Hidden Bearish: "H" red label

Divergence Stoch RSI[mado]Divergence screener for Stoch RSI
Regular Bullish: "D" navy label
Hidden Bullish: "H" navy label
Regular Bearish: "D" red label
Hidden Bearish: "H" red label

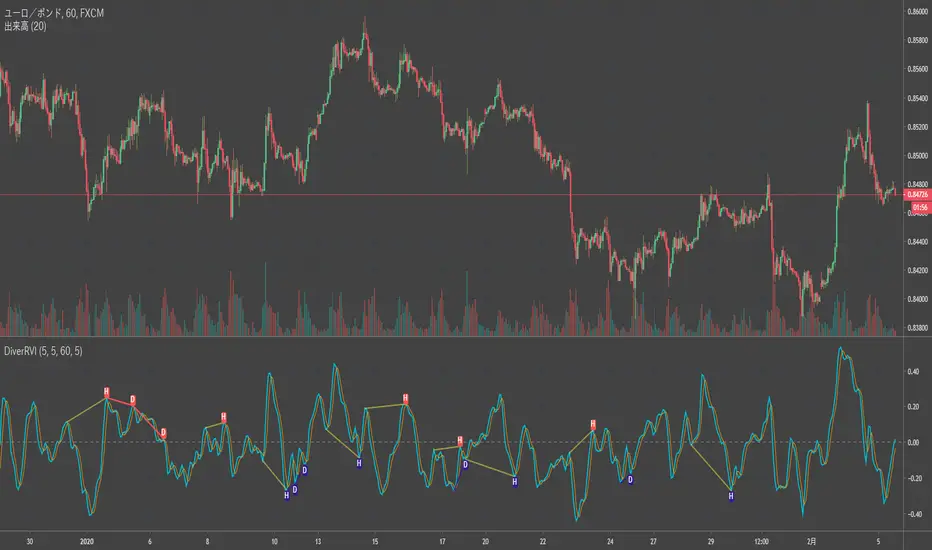
Divergence RVI[mado]Divergence screener for RVI
Regular Bullish: "D" navy label
Hidden Bullish: "H" navy label
Regular Bearish: "D" red label
Hidden Bearish: "H" red label
Divergence OBV RSI[mado]Divergence screener for OBV RSI
Regular Bullish: "D" navy label
Hidden Bullish: "H" navy label
Regular Bearish: "D" red label
Hidden Bearish: "H" red label

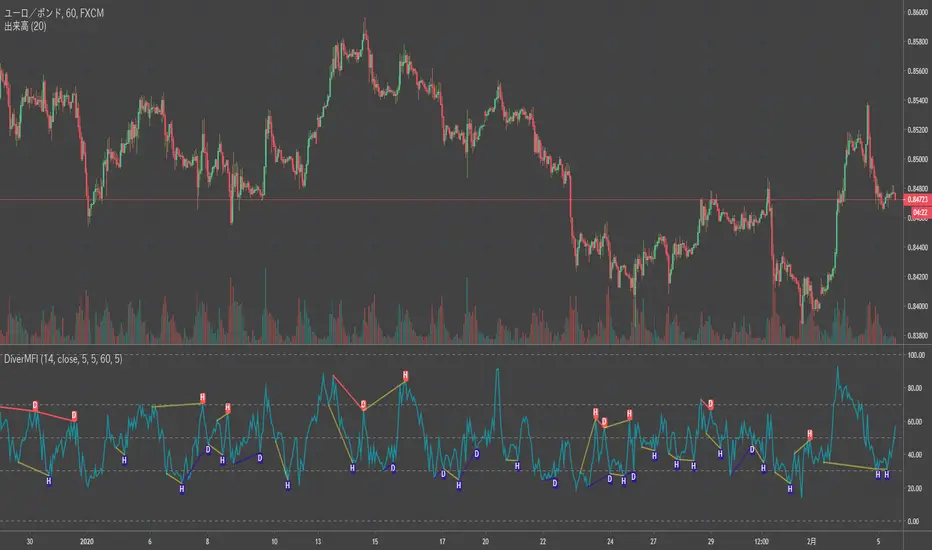
Divergence MFI[mado]Divergence screener for MFI
Regular Bullish: "D" navy label
Hidden Bullish: "H" navy label
Regular Bearish: "D" red label
Hidden Bearish: "H" red label
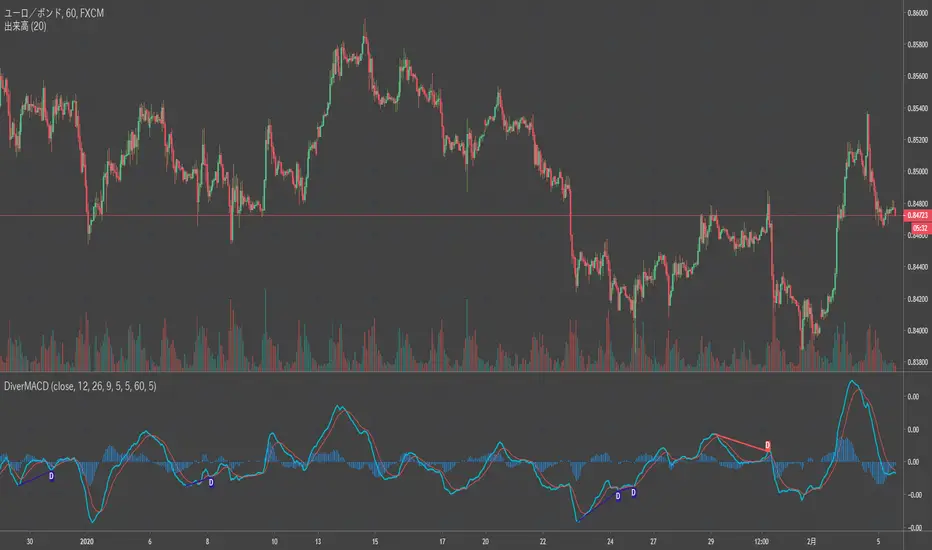
Divergence MACD [mado]Divergence screener for MACD
Regular Bullish: "D" navy label
Hidden Bullish: "H" navy label
Regular Bearish: "D" red label
Hidden Bearish: "H" red label
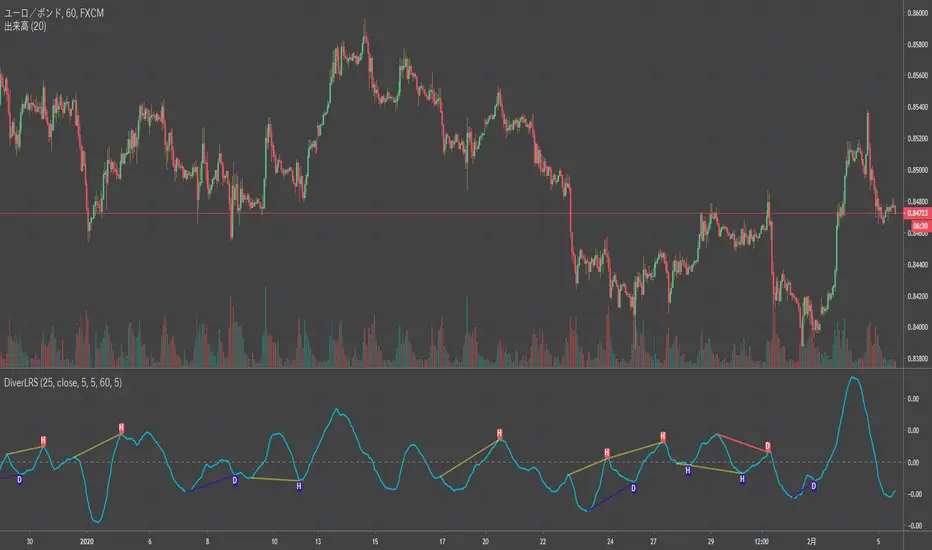
Divergence LinerRegressionSlope[mado]Divergence screener for LinerRegressionSlope
Regular Bullish: "D" navy label
Hidden Bullish: "H" navy label
Regular Bearish: "D" red label
Hidden Bearish: "H" red label
Divergence KlingerVolumeOscillator [mado]Divergence screener for KVO
Regular Bullish: "D" navy label
Hidden Bullish: "H" navy label
Regular Bearish: "D" red label
Hidden Bearish: "H" red label

Divergence CCI [mado]Divergence screener for CCI
Regular Bullish: "D" navy label
Hidden Bullish: "H" navy label
Regular Bearish: "D" red label
Hidden Bearish: "H" red label

Divergence Awesome Oscillator [mado]Divergence screener for Awesome Oscillator
Regular Bullish: "D" navy label
Hidden Bullish: "H" navy label
Regular Bearish: "D" red label
Hidden Bearish: "H" red label
Elder impulse system with double exponential moving average dema
This version of impulse uses the double exponential moving average instead of the typical ema both to calculate macd and the moving slow and fast moving average that are plotted.
The impulse system :
The Impulse System combines two simple but powerful indicators.
One measures market inertia, the other its momentum. When both
point in the same direction, they identify an impulse worth following.
We get an entry signal when both indicators get in gear.
The Impulse System uses an exponential moving average to find
uptrends and downtrends. When the EMA rises, it shows that inertia
favors the bulls. When EMA falls, inertia works for the bears. The sec-
ond component is MACD-Histogram, an oscillator whose slope reflects
changes of power among bulls or bears. When MACD-Histogram rises,
it shows that bulls are becoming stronger. When it falls, it shows that
bears are growing stronger.
The Impulse System flags those bars where both the inertia and the
momentum point in the same direction. When both the EMA and
MACD-Histogram rise, they show that bulls are roaring and the uptrend
is accelerating.
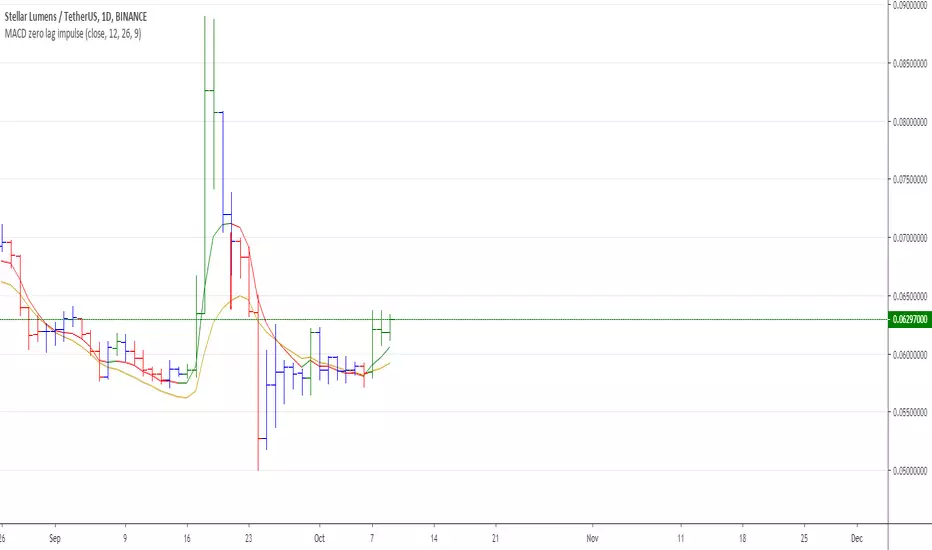
MACD Zero lag impulse systemThis version of impulse uses the double exponential moving average instead of the typical ema.
The impulse system :
The Impulse System combines two simple but powerful indicators.
One measures market inertia, the other its momentum. When both
point in the same direction, they identify an impulse worth following.
We get an entry signal when both indicators get in gear.
The Impulse System uses an exponential moving average to find
uptrends and downtrends. When the EMA rises, it shows that inertia
favors the bulls. When EMA falls, inertia works for the bears. The sec-
ond component is MACD-Histogram, an oscillator whose slope reflects
changes of power among bulls or bears. When MACD-Histogram rises,
it shows that bulls are becoming stronger. When it falls, it shows that
bears are growing stronger.
The Impulse System flags those bars where both the inertia and the
momentum point in the same direction. When both the EMA and
MACD-Histogram rise, they show that bulls are roaring and the uptrend
is accelerating.

Elder impulse system with barcolor + Safezone stops + emasThe impulse system :
The Impulse System combines two simple but powerful indicators.
One measures market inertia, the other its momentum. When both
point in the same direction, they identify an impulse worth following.
We get an entry signal when both indicators get in gear.
The Impulse System uses an exponential moving average to find
uptrends and downtrends. When the EMA rises, it shows that inertia
favors the bulls. When EMA falls, inertia works for the bears. The sec-
ond component is MACD-Histogram, an oscillator whose slope reflects
changes of power among bulls or bears. When MACD-Histogram rises,
it shows that bulls are becoming stronger. When it falls, it shows that
bears are growing stronger.
The Impulse System flags those bars where both the inertia and the
momentum point in the same direction. When both the EMA and
MACD-Histogram rise, they show that bulls are roaring and the uptrend
is accelerating.
The SafeZone Stop :
Once in a trade, where should you put your stop? This is one of the
hardest questions in technical analysis. After answering it, you’ll face
an even harder one—when and where to move that stop with the pas-
sage of time. Put a stop too close and it’ll get whacked by some mean-
ingless intraday swing. Put it too far, and you’ll have very skimpy
protection.
The Parabolic System, described in Trading for a Living, tried to
tackle this problem by moving stops closer to the market each day,
accelerating whenever a stock or a commodity reached a new extreme.
The trouble with Parabolic was that it kept moving even if the market
stayed flat and often got hit by meaningless noise.
SafeZone trails prices with stops tight enough to protect
capital but remote enough to keep clear of most random fluctuations.
Engineers design filters to suppress noise and allow the signal to come
through. If the trend is the signal, then the countertrend motion is the
noise. When the trend is up, we can define noise as that part of each
day’s range that protrudes below the previous day’s low. When the trend
is down, we can define noise as that part of each day’s range that pro-
trudes above the previous day’s high. SafeZone measures market noise
and places stops at a multiple of noise level away from the market.
We can make our lookback period 100 days or so if we want to aver-
age long-term market behavior.
SafeZone offers an original approach to placing stops. It monitors
changes in prices and adapts stops to the current levels of activity. It
places stops at individually tailored distances rather than at obvious
support and resistance levels.

DBT MoMo v.4DBT MOMO
Introduction: The MoMo is a TradingView indicator designed to evaluate momentum and give the user signals according to momentum shifts, strength, extensions, traps, and divergence. It’s an all in one oscillator that will make reading price action near term and long term much easier.
Part One: Strength
The MoMo consist of two major parts. A 3-candle back formula and a 24-candle back formula. The 3-candle back is called the Price Line (the histogram on the MoMo). The 24-candle back is called the Trend Line (the line on the MoMo). Both lines are placed into a range from 20 to -20. It can go higher than 20 or lower than -20, but this is extremely rare and short lived.
A positive number indicates a bullish bias, a negative number indicates a bearish bias. When the Price or Trend line are ascending while below 0 this indicates that the bearish momentum is weakening. When the Price or Trend line are descending while above 0 this indicates that the bullish momentum is weakening.
In a strong trend the Trend Line will likely flatten out around 15 or -15. While the Trend Line is flat the Price Line will likely shift rapidly, this can lead to bull and bear traps, we will discuss this in the Trap section.
A rare, but powerful signal from the MoMo is when the Price and Trend Lines “pinch” and begin to move in the same direction. If this is happening the trader should be looking to follow the direction of these lines.
Part Two: Extensions
When both Price and Trend Lines are above 10 or below -10 this will begin to signal an extension.
Purple: Indicates the bears are extended to the downside and a pullback or trend reversal upward is likely.
Gold: Indicates the bulls are extended to the upside and a pullback or trend reversal downward is likely.
When only the Trend Line is above 10 the MoMo will shade the upper range red. This indicates the Trend is becoming bullish or entering an extension. If the Trend Line cannot maintain above 10 for long and breaks below 10 this indicates it’s an extension and trend will most likely continue downward.
When only the Trend Line is below -10 the MoMo will shade the upper range green. This indicates the Trend is becoming bearish or entering an extension. If the Trend Line cannot maintain below -10 for long and breaks above -10 this indicates it’s an extension and trend will most likely continue upward.
When the green or purple shading have turned off take the lowest point, this is considered a support level or a local bottom.
When the red or gold shading have turned off take the highest point, this is considered a resistance level or a local top.
The trader can preemptively trade the purple or gold warnings but be warned these warnings can go on for a long time if the trend is very strong. It is the same mentality of an overbought or oversold RSI, except the MoMo extensions have a much higher strike rate.
To avoid preemptively trading these extensions the trader should wait for confirmation on the Price Line and on price action. The Price Line (histogram) should be moving upward during a purple extension to begin showing a bottom. The Price Line (histogram) should be moving downward during the gold extension to begin showing a top.
Part Three: Traps
The relation between the Price Line and Trend Line can create trading signals for bull and bear traps. When the Trend Line is flattened out around 15 or -15, indicating a strong trend is in place, and the Price Line is rapidly moving towards the midline this may indicate a trap is forming.
When the Trend Line is flat around 15 and the Price Line begins moving towards 0, if the Price Line reaches 0 or close to 0 and the Trend Line is still flat, a trap has begone. Once the Price Line shifts from decreasing (red) to increasing (green) the trap is playing out. Therefore, the trader should look to exit short positions or enter long positions.
When the Trend Line is flat around -15 and the Price Line begins moving towards 0, if the Price Line reaches 0 or close to 0 and the Trend Line is still flat, a trap has begone. Once the Price Line shifts from increasing (green) to decreasing (red) the trap is playing out. Therefore, the trader should look to exit long positions or enter short positions.
Part Four: Divergences
The MoMo is exceptional at finding divergences with the Price Line and occasionally the Trend Line.
To find a divergence with the MoMo the trader must look for when the histogram is not following price action completely.
Bullish Divergence: Price makes a lower low, MoMo makes a higher low.
Bearish Divergence: Price makes a higher high, MoMo makes a lower high.
Hidden Bull Divergence: Price makes a higher low, MoMo makes a lower low.
Hidden Bear Divergence: Price makes a lower high, MoMo makes a higher high.
For Access or Questions: Private message us. Thank you.

Absolute Strength MTF IndicatorIntroduction
The non-signal version of the absolute strength indicator from fxcodebase.com requested by ernie76 . This indicator originally from mt4 aim to estimate the bullish/bearish force of the market by using various methods.
The Indicator
Two lines are plotted, a bull line (blue) representing the bullish/buying force and a bear one (red) representing the bearish/selling force, when the bull line is greater than the bear line the market is considered to be strongly bullish, else strongly bearish.
The indicator use various method, Rsi, stochastic, adx. The Rsi method is the one by default.
The stochastic method is less reactive but smoother
The Adx method is way different, while the other two methods make the bull and bear lines somewhat uncorrelated, the adx method focus more on the overall market strength than individual buyer/seller strength.
The smoothing method use 3 different filters, SMA, EMA and LSMA, LSMA is more reactive than the two previous one while EMA is just more computer efficient.
It is possible to use price data of different time frames for the calculation of the indicator.
Stochastic method with 4 hour price close as source.
Conclusion
A classic indicator who can be derived into a lot of ways using a more adaptive architecture or recursion. Hope you find it a use :)
A big thanks to ernie76 for the request and the support/testing of the indicator
Feel free to pm me for any request.

fiercebitraderEl indicador fiercebitrader, es un indicador basado en el Índice Medio de Movimiento Direccional (ADX) es una herramienta de análisis técnico usada para medir la fuerza de la tendencia. El indicador direccional positivo ( DI) y el indicador direccional negativo (-DI) acompañan a la línea ADX. realzando la dirección de la tendencia.
Usados en conjunto forman un sistema de trading que es capaz de determinar tanto la dirección como la fuerza de la tendencia. El indicador consiste en tres líneas: la propia ADX (línea azul), una línea DI (línea verde), y una línea -DI (línea roja). El DI mide la fuerza de la tendencia alcista, mientras que el -DI mide la intensidad del movimiento bajista. La línea ADX muestra la fuerza de la tendencia en general creciendo tanto en las tendencias alcistas como bajistas.
Cuando el DI está por encima del -DI, se dice que los alcistas tienen el dominio direccional. De forma alternativa, cuando el -DI es más alto que el DI, el dominio direccional pertenece a los bajistas.
Es importante entender que el ADX (línea azul) muestra solo la fuerza de la tendencia y no la dirección de la tendencia. La dirección de la tendencia puede en cambio determinarse mirando al DI y el -DI (líneas roja y verde).
¿Cómo usarlo en el trading?
Operar con la tendencia reduce los riesgos e incrementa los beneficios potenciales. Es por esto que muchos traders prefieren consultar la fuerza de la tendencia con ayuda del ADX antes de invertir su dinero. Hay dos formas principales de usar el indicador:
El Cruce de DI
Cuando las líneas direccionales del positivo y negativo se cruzan, normalmente significa que la tendencia está cambiando. Esta información puede usarse para determinar puntos de entrada óptimos. Para los inversores que utilicen este sistema de trading, las señales son las siguientes:
(Compra) cuando el DI cruce el -DI , es mas efectivo, mas fuerte cuando toca o cruza la linea amarilla solida en el nivel de 27 y la tendencia general sea alcista.
El disparo se da en la linea de 20 punteada.
(Venta) cuando el -DI cruce el DI , es mas efectivo, más fuerte cuando toca o cruza la linea amarilla solida en el nivel de 27 y la tendencia sea bajista general sea bajista.
Valor de Fuerza Tendencia ADX
0-20 Tendencia Ausente o Débil
21-26 Disparo
27-50 Tendencia Fuerte
50-75 Tendencia muy Fuerte
75-100 Tendencia Extremadamente Fuerte
El fiercebitrader es un indicador de análisis técnico verdaderamente único, que combinado con otros indicadores, puede convertirse en la estrategia de trading definitiva en manos de un trader.
Recomendado para scalping en temporalidad de 5 min
swing day 1hora. Esta configurado para una operacion optima.
Acompañelo con el indicador bitradertracker.
Con mucho cariño Bitrader4.0
_________________________________
The fiercebitrader indicator, is an indicator based on the Mean Directional Movement Index (ADX) is a technical analysis tool used to measure the strength of the trend. The positive directional indicator (DI) and the negative directional indicator (-DI) accompany the ADX line. enhancing the direction of the trend.
Used together they form a trading system that is able to determine both the direction and strength of the trend. The indicator consists of three lines: the ADX itself (blue line), a DI line (green line), and a -DI line (red line). The DI measures the strength of the uptrend, while the -DI measures the intensity of the bearish movement. The ADX line shows the strength of the overall trend growing in both bullish and bearish trends.
When the DI is above the -DI, it is said that the bulls have the directional domain. Alternatively, when the -DI is higher than the DI, the directional domain belongs to the bears.
It is important to understand that the ADX (blue line) shows only the strength of the trend and not the direction of the trend. The direction of the trend can instead be determined by looking at the DI and the -DI (red and green lines).
How to use it in trading?
Operating with the trend reduces the risks and increases the potential benefits. This is why many traders prefer to consult the strength of the trend with the help of the ADX before investing their money. There are two main ways to use the indicator:
1) The Cross of DI
When the directional lines of the positive and negative intersect, it usually means that the trend is changing. This information can be used to determine optimal entry points. For investors who use this trading system, the signals are the following:
(Buy) when the DI crosses the -DI, it is more effective, stronger when it touches or crosses the solid yellow line at the level of 27 and the general trend is bullish.
The shot is given in the line of 20 dashed.
(Sale) when the -DI crosses the DI, it is more effective, stronger when it touches or crosses the solid yellow line at the level of 27 and the general bearish trend is bearish.
Strength Value ADX Trend
0-20 Absent or Weak Trend
21-26 Shot
27-50 Strong Trend
50-75 Very Strong Trend
75-100 Extremely Strong Trend
The fiercebitrader is a truly unique indicator of technical analysis, which combined with other indicators, can become the definitive trading strategy in the hands of a trader.
Recommended for scalping 5-minute and 1 hour.
It is configured for an optimal operation.
Accompany it with the bitradertracker indicator.
With love Bitrader4.0

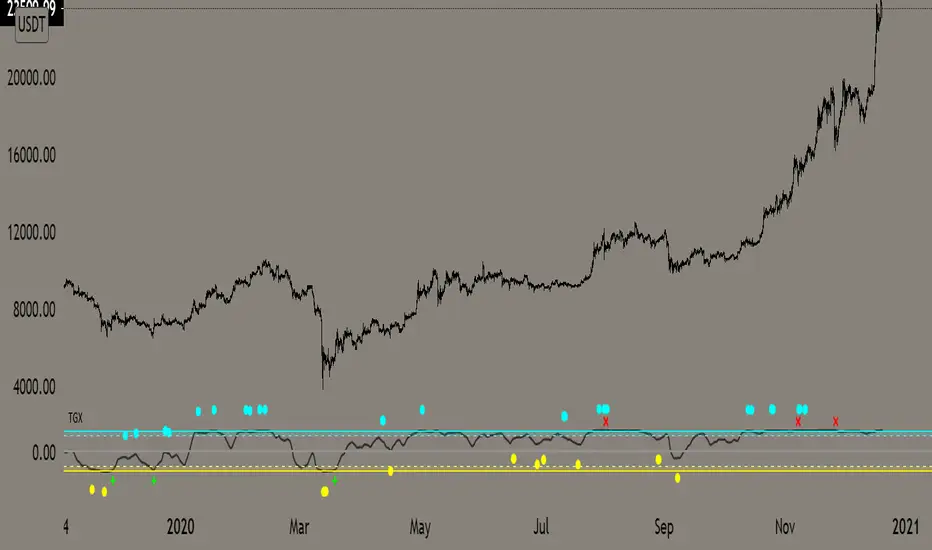
Top Goon X
Momentum based indicator
various signals for various parameters
bull/bear divergence will be seen as the dots with blue being bearish and yellow being bullish
the red X and green + are top and bottom signals per TGX
white flag appears respectably on top and bottom when all parameters are met bullshly or bearishly
Watch for TGX to reset while it rest just under resistance for a bullish set up
or
for TGX to run while sitting on top of support for bearish set up
TGX will trend in the upper parallel when bullish and bottom when bearish
towards the end of the trend is when you will see TGX "reset" for one last push up, albeit that push can run as long as it the market wants
@satoshiiheavy
Technical Analysis for www.cryptocurrentlyvip.com
Extremely Powerful Libra [Eric]This Indicator helps understand the Power shift between Bulls and Bears:
1. The volume is separated into bulls and bears power. For example, when we see a doji, we can check it for more inner information about who actually control the market.
2. The background is a prediction algo that predict the trending direction.
If you guys meet the:
Extremely Powerful Libra (3): Internal server study error
or Loop error,
Just check this button then switch my TF to 5 or bigger, normally 3 works well, but sometime the data is way too much that the server will reject to compile it.
prnt.sc

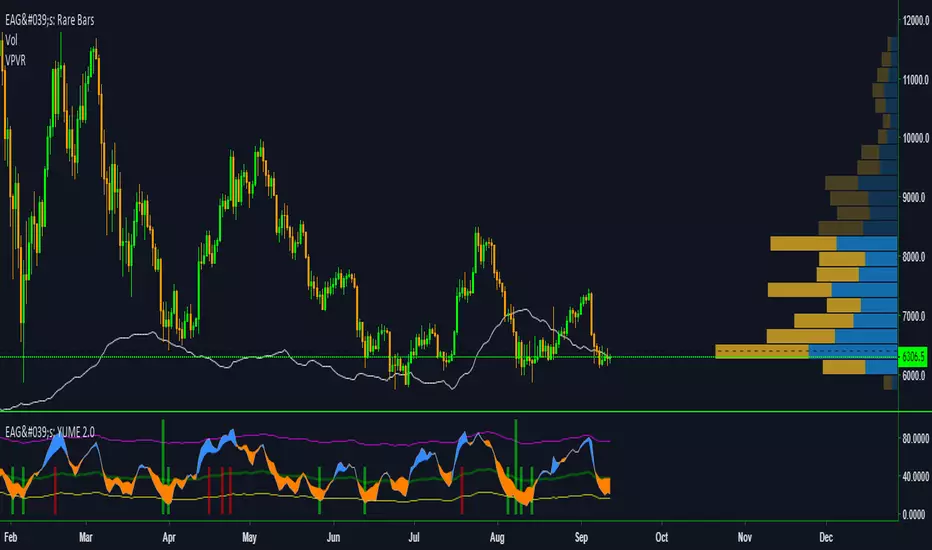
EdgeAnalysisGroup: Yume Wave 2.0This is a upgraded version of the wave with modified parameters for a higher success rate. 3 New Lengths and 75 more lines of code added to the overall algorithm. Also included are 2 sublevel signals based on the Fib MA and pattern trading.
The Wave:
+ The Yume is the Fast length
+ The Akume is the Slow length
+ The Miaku is a median weighted length
+ The Upper Limit is an overbought asset indication
+ The Lower Limit is an oversold asset indication
+ The Wave is the spread between Yume and Miaku
Bullish Indications:
+ The Yume is above the Akume
+ The Yume is above the Miaku
+ The Yume is below the Lower Limit
Bearish Indications:
+ The Yume is below the Akume
+ The Yume is below the Miaku
+ The Yume is above the Upper Limit
Signal Strength Weights:
+ 50 = Yume Wave crossed a Limit Line
+ 100 = Yume Wave crossed a Limit Line + Close to a Fib Moving Average
+ 100 = Edge's Market Bottom/Top Algorithm is marked 'True'
Setting up Signals (Based on a 100 Signal Height):
+ Set the "Bull Signal" to be at 50 or 100
+ Set the "Bear Signal" to be at 50 or 100
+ 50 is Agressive, 100 is Conservative.
+ Bull/Bear are separate so you can play conservative bull with aggressive bear.
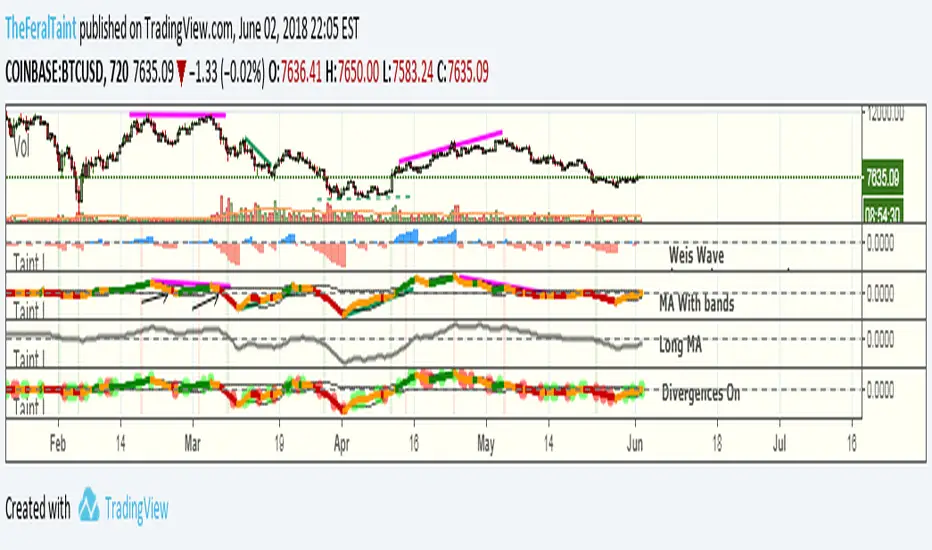
Taintalicious IndicatorThis indicator gathers data from the Weis Wave indicator (thanks to @LazyBear for the original code), and coverts it to something like a VPCI or a Chaikin Oscillator. This indicator is quite versatile. It can be ran with Weis Wave turned on and the Bands + MA turned on together, though I find the scaling becomes an issue. If it is the only indicator you're using, scaling isn't a problem as long as you enlarge it. I prefer to run the Bands + MA + Long MA as one setup, and flip to Weis Wave when I need to see the raw data underneath. You can use this indicator to spot momentum shifts, the strength of bullish or bearish moves, bull/bear divergences, trend reversals, consolidation/squeezes, and even Wyckoff springs. It will take some getting used to though.
Tips for interpretation:
--Bearish/Bearish Divergence: TI diverges from price. TI is making lower highs or higher lows while price is making higher highers or higher lows. You can turn on the setting to highlight some of these divergences, but I find it easier to simply look for them.
--As an Oscillator: TI crossing zero can indicate a shift in momentum. The deeper the initial rise or fall past zero, the stronger the momentum shift.
--Overbought/Oversold: When TI breaches the bands while they are wide--indicating high volatility in the same way Bollinger Bands do--this can be viewed as an overbought or oversold signal. Begin looking for an entry once TI forms a "v" shape, and begins moving back towards the bands. The best entry is typically when TI breaks back into the bands. These breaches are highlighted with either green or red.
--Long MA: This can be used for bull/bear divergence as well as a leading indicator for trend reversals or momentum shifts. TI crossing above or below the Long MA is one signal. Whether the Long MA is above or below zero indicates the market sentiment/trend over the last 100 periods--above zero being bullish and below zero being bearish.
Best setting for Trend Detection Length is 4
Feel free to contact me on Twitter if you have questions: @TheFeralTaint
420_Jpn_PatternsMy first iteration of a script that ID's japanese candlestick patterns including:
bullish_engulfing www.investopedia.com
bearish_engulfing www.investopedia.com
bullish_harami www.investopedia.com
bearish_harami www.investopedia.com
piercing_line (bullish) www.investopedia.com
dark_cloud_cover (bearish) www.investopedia.com
morning_star (bullish) www.investopedia.com
evening_star (bearish) www.investopedia.com
bullish_belt www.investopedia.com
bearish_belt www.investopedia.com
aka_sanpei (bullish) www.investopedia.com
sanba_garasu (bearish) www.investopedia.com
three_stars_south (bullish) www.investopedia.com
stick_sandwich www.investopedia.com
bullish_meeting_line www.thepatternsite.com
bearish_meeting_line www.thepatternsite.com
bullish_kicking www.thepatternsite.com
bearish_kicking thepatternsite.com
ladder_bottom (bullish) www.thepatternsite.com
inverted_hammer www.thepatternsite.com
shooting_star www.thepatternsite.com www.thepatternsite.com
hanging_man (bearish) www.thepatternsite.com
hammer (bullish) www.thepatternsite.com
xoxo
sn00p
