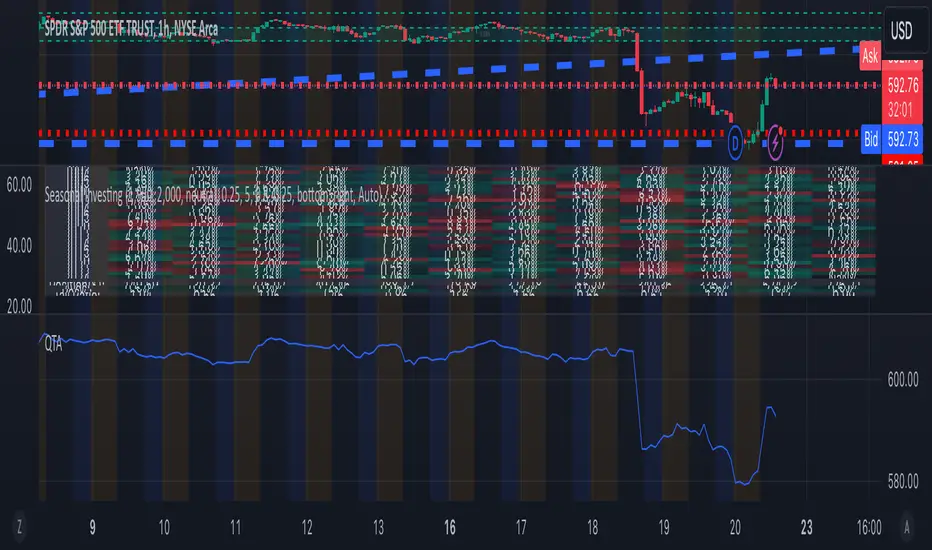
Prometheus TTM SqueezeThe TTM indicator is an indicator used to better understand an underlying’s direction and volatility. Positive values indicate a rising price, negative falling. There is also an element of the underlying's volatility, explained below.
When, in this particular indicator, the zero line is the aqua color, that means that the volatility has picked up. In literal terms, it means that the upper Keltner Channel is above the upper Bollinger Band and the lower Keltner Channel is below the lower Bollinger Band. The range of the Keltner Channels is greater than the range of the Bollinger bands. What this is supposed to correlate to with price action is a more volatile choppier area. See below.
This is an example of volatility picking up being shown as the speed of the underlying. When the line turns aqua the move following tends to be sharp in the respective direction. Not a smooth delivery of price.
Regarding why this script is different from the others, with this script you do not need to input a bar's back value if you do not want to. Bars back being the amount of bars used in the indicator calculation. This is because of the use of Sum of Squared Errors, or SSE. How we do it is we calculate a Simple Moving Average or SMA and the indicator using a lot of different bars back values. Then if there is an event, characterized by the oscillator crossing over or under the 0 line, we subtract the close by the SMA and square it. If there is no event we return a big value, we want the error to be as small as possible. Because we loop over every value for bars back, we get the value with the smallest error. Or the SMA closest to the price ensuring we are following it as close as we can. This also becomes the value used as the multiplier for the Keltner Channels and Bollinger Bands, we simply divide them by 10 to normalize it. This leads to ease of use. A user does not need to worry about finding the best bars back for each ticker and time frame. We have you covered! SSE is not to be regarded to be the best given values for a pocket of the market, simply an estimation.
Of course we have the option for users to enter their own bars back or multipliers. Here is a comparison of the SSE at work and a 20 period bar’s back with 2 as the multiplier on a 4 hour $QQQ.
The top one is the SSE, the bottom is 20. I turned off showing the SMA, and alerts for better visibility. We see the SSE version does not cross above 0 again until the trend totally reverses. I would much rather overestimate risk than underestimate it.
The BULL and BEAR plotted on the chart is a result of the following conditions. A BULL if the price is above our auto optimized SMA and the oscillator crosses over 0. BEAR is the opposite, price below the SMA and an oscillator cross below 0. Here is the Daily NYSE:PLTR chart to show some.
Users have the options to toggle on and off the BULL and BEAR plots, SMA, as well as input their own lookback and multipliers.
We encourage traders to not follow indicators blindly, none are 100% accurate. SSE does not guarantee that the values generated will be the best for a given moment in time. Please comment on any desired updates, all criticism is welcome!
在腳本中搜尋"bear"
Negroni Opening Range StrategyStrategy Summary:
This tool can be used to help identify breakouts from a range during a time-zone of your choosing. It plots a pre-market range, an opening range, it also includes moving average levels that can be used as confluence, as well as plotting previous day SESSION highs and lows.
There are several options on how you wish to close out the trades, all described in more detail below.
Back-testing Inputs:
You define your timezone.
You define how many trades to open on any given day.
You decide to go: long only, short only, or long & short (CAREFUL: "Long & Short" can open trades that effectively closes-out existing ones, for better AND worse!)
You define between which times the strategy will open trades.
You define when it closes any open trades (preventing overnight trades, or leaving trades open into US data times!!).
This hopefully helps make back-testing reflect YOUR trading hours.
NOTE: Renko or Heikin-Ashi charts
For ALL strategies, don’t use Renko or Heikin-Ashi charts unless you know EXACTLY the implications.
Specific to my strategy, using a renko chart can make this 85-90% profitable (I wish it was!!) Although they can be useful, renko charts don’t always capture real wicks, so the renko chart may show your trade up-only but your broker (who is not using renko!!) will have likely stopped you out on a wick somewhere along the line.
NOTE: TradingView ‘Deep backtesting’
For ALL strategies, be cynical of all backtesting (e.g. repainting issues etc) as well as ‘Deep backtesting’ results.
Specific to this strategy, the default settings here SHOULD BE OK, but unfortunately at the time of writing, we can’t see on the chart what exactly ‘deep backtesting’ is calculating. In the past I have noted a number of trades that were not closed at the end of the day, despite my ‘end of day’ trade closing being enabled, so there were big winners and losers that would not have materialized otherwise. As I say, this seems ok at these settings but just always be cynical!!
Opening Range Inputs
You define a pre-market range (example: 08:00 - 09:00).
You define an opening range (example: 09:00 - 09:30).
The strategy will give an update at the close of the opening range to let you know if the opening range has broken out the pre-market range (OR Breakout), or if it has remained inside (OR Inside). The label appears at the end of the opening range NOT at the bar that ‘broke-out’.
This is just a visual cue for you, it has no bearing on what the strategy will do.
The strategy default will trade off the pre-market range, but you can untick this if you prefer to trade off the opening range.
Opening Trades:
Strategy goes long when the bar (CLOSE) crosses-over the ‘pre-market’ high (not the ‘opening range’ high); and the time is within your trading session, and you have not maxed out your number of trades for the day!
Strategy goes short when the bar (CLOSE) crosses-under the ‘pre-market’ low (not the ‘opening range low); and the time is within your trading session, and you have not maxed out your number of trades for the day!
Remember, you can untick this if you prefer to trade off the opening range instead.
NOTES:
Using momentum indicators can help (RSI and MACD): especially to trade range plays in failed breakouts, when momentum shifts… but the strategy won’t do this for you!
Using an anchored vwap at the session open can also provide nice confluence, as well as take-profit levels at the upper/lower of 3x standard deviation.
CLOSING TRADES:
You have 6 take-profit (TP) options:
1) Full TP: uses ATR Multiplier - Full TP at the ATR parameters as defined in inputs.
2) Take Partial profits: ATR Multiplier - Takes partial profits based on parameters as defined in inputs (i.e close 40% of original trade at TP1, close another 40% of original trade at TP2, then the remainder at Full TP as set in option 1.).
3) Full TP: Trailing Stop - Applies a Trailing Stop at the number of points, as defined in inputs.
4) Full TP: MA cross - Takes profit when price crosses ‘Trend MA’ as defined in inputs.
5) Scalp: Points - closes at a set number of points, as defined in inputs.
6) Full TP: PMKT Multiplier - places a SL at opposite pre-market Hi/Low (we go long at a break-out of the pre-market high, 50% would place a SL at the pre-market range mid-point; 100% would place a SL at the pre-market low)'. This takes profit at the input set in option 1).
Support ResistanceThis indicator was written in pine script code, inspired by the L3 Banker Fund Flow Trend Oscillator indicator whose link I gave below.
This indicator is designed to track the flow of banker funds in the market by analyzing price movements and generating entry signals based on specific criteria. It uses a combination of custom functions and moving averages to identify potential points where bankers might be entering the market.
Key Features:
Fund Flow Trend Calculation:
The indicator calculates the fund flow trend using a combination of weighted moving averages. This helps in identifying the overall trend and potential reversals.
Bull Bear Line:
A key component of the indicator is the Bull Bear Line, which is derived from the typical price, lowest low, and highest high over a specified period. This line helps in determining the strength and direction of the market trend.
Banker Entry Signal:
The indicator generates a banker entry signal when the fund flow trend crosses above the Bull Bear Line, and the Bull Bear Line is below 25. This condition is indicative of a potential entry point for bankers.
Visual Representation:
Entry prices and indices for the last five banker entry signals are stored and used to draw dashed lines on the chart, representing these significant levels.
A dynamic rectangle is drawn between the last two entry prices, which extends to the right until the specified conditions are met. The rectangle's color changes from red to green if the price crosses above it by at least one bar, indicating a potential support zone.
Usage:
Trend Identification:
Use the fund flow trend and Bull Bear Line to identify the prevailing market trend and potential reversal points.
Entry Signals:
Pay attention to the banker entry signals as potential points of entry based on institutional fund flow.
Support and Resistance:
The dynamic rectangle can act as a support zone. Monitor price action relative to this rectangle for potential trading opportunities.
This indicator is a powerful tool for traders looking to align their trades with the movements of large institutional players. By understanding and tracking the flow of banker funds, traders can gain valuable insights into market dynamics and make more informed trading decisions.
Brooks Always In [KintsugiTrading]Brooks Always In
Overview:
The "Brooks Always In Indicator" by KintsugiTrading is a tool designed for traders who follow price action methodologies inspired by Al Brooks. This indicator identifies key bar patterns and breakouts, plots an Exponential Moving Average (EMA), and highlights consecutive bullish and bearish bars. It is intended to assist traders in making informed decisions based on price action dynamics.
Features:
Consecutive Bar Patterns:
Identifies and highlights consecutive bullish and bearish bars.
Differentiates between bars that are above/below the EMA and those that are not.
Customizable EMA:
Option to display an Exponential Moving Average (EMA) with user-defined length and offset.
The EMA can be smoothed using various methods such as SMA, EMA, SMMA (RMA), WMA, and VWMA.
Breakout Patterns:
Recognizes bullish and bearish breakout bars and outside bars.
Tracks inside bars and prior bar conditions to better understand the market context.
Customizable Display:
Users can display or hide the EMA, consecutive bar patterns, and consecutive bars relative to the moving average.
How to Use:
Customize Settings:
First, I like to navigate to the top right corner of the chart (bolt icon), and change both the bull and bear body color to match the background (white/black) - this helps the user visualize the indicator far better.
Next, Toggle to display EMA, consecutive bar patterns, and consecutive bars relative to the moving average using the provided input options.
Adjust the EMA length, source, and offset as per your trading strategy.
Select the smoothing method and length for the EMA if desired.
Analyze Key Patterns:
Observe the highlighted bars on the chart to identify consecutive bullish and bearish patterns.
Use the plotted EMA to gauge the general trend and analyze the relationship between price bars and the moving average.
Informed Decision Making:
Utilize the identified bar patterns and breakouts to make informed trading decisions, such as identifying potential entry and exit points based on price action dynamics.
Good luck with your trading!
Parabolic SAR Waves [MMA]Parabolic SAR Waves
Description:
The "Parabolic SAR Waves " is an advanced version of the traditional Parabolic SAR indicator, customized for TradingView. This script incorporates dynamic acceleration factors and optional gradient coloration to enhance visual interpretation and utility for traders aiming to accurately capture trends and predict potential reversals.
Features:
- Dynamic Acceleration: Adjust the initial, incremental, and maximum values of the acceleration factor to suit various market conditions and trading preferences.
- Gradient Coloring: Use gradient colors to indicate the strength and stability of the trend, providing visual cues that are easy to interpret.
- Trend Visibility: The SAR dots are plotted directly on the price chart, making it easy to spot trend changes and maintain situational awareness.
- Overlay Feature: Designed to overlay directly on the price charts, allowing for seamless integration with other technical analysis tools.
Benefits:
- Trend Detection: Helps in identifying the beginning and potential reversal of trends, aiding in timely decision-making.
- Stop-Loss Management: Utilizes the positions of the SAR dots as dynamic stop-loss points, which helps in risk management.
- Visual Simplicity: Enhances the decision-making process through a straightforward visual representation of trend data.
Parameters:
- Acceleration Start (accel_start): The initial value for the acceleration, set to 0.02 by default.
- Acceleration Increment (accel_inc): The amount by which the acceleration increases, set to 0.005 by default.
- Acceleration Maximum (accel_max): The maximum limit of the acceleration factor, set to 0.1 by default.
- Use Gradient Colors (use_gradient): A boolean toggle to enable or disable gradient coloring, enabled by default.
Indicator Usage:
1. To apply, select this indicator from TradingView's indicator library.
2. Adjust the acceleration parameters based on your specific trading strategy and market analysis.
3. Interpret the indicator signals:
- Green SAR dots below the price bars indicate a bullish trend.
- Red SAR dots above the price bars signify a bearish trend.
- Gradient colors, if enabled, provide insights into the acceleration factor's intensity relative to trend strength.
Alerts:
- Bullish Reversal Alert: Issues a notification if there is a potential upward reversal when the trend shifts to bullish.
- Bearish Reversal Alert: Alerts when there's potential for a downward move as the trend turns bearish.
The "Parabolic SAR Waves " is a robust tool, ideal for traders who need precise, customizable trend-following capabilities that integrate seamlessly with other market analysis strategies. Enhance your trading with detailed trend insights and adaptive parameter controls.
Internal Bar Strength IBS [Anan]This indicator calculates and displays the Internal Bar Strength (IBS) along with its moving average. The IBS is a measure that represents where the closing price is relative to the high-low range of a given period.
█ Main Formula
The core of this indicator is the Internal Bar Strength (IBS) calculation. The basic IBS formula is:
ibs = (close - low) / (high - low)
I enhanced the original formula by incorporating a user-defined length parameter. This modification allows for greater flexibility in analysis and interpretation. The extended version enables users to adjust the indicator's length according to their specific needs or market conditions. Notably, setting the length parameter to 1 reproduces the behavior of the original formula, maintaining backward compatibility while offering expanded functionality:
ibs = (close - ta.lowest(low, ibs_length)) / (ta.highest(high, ibs_length) - ta.lowest(low, ibs_length))
Where:
- `close` is the closing price of the current bar
- `lowest low` is the lowest low price over the specified IBS length
- `highest high` is the highest high price over the specified IBS length
█ Key Features
- Calculates IBS using a user-defined length
- Applies a moving average to the IBS values
- Offers multiple moving average types
- Includes optional Bollinger Bands or Donchian Channel overlays
- Visualizes bull and bear areas
█ Inputs
- IBS Length: The period used for IBS calculation
- MA Type: The type of moving average applied to IBS (options: SMA, EMA, SMMA, WMA, VWMA, Bollinger Bands, Donchian)
- MA Length: The period used for the moving average calculation
- BB StdDev: Standard deviation multiplier for Bollinger Bands
█ How to Use and Interpret
1. IBS Line Interpretation:
- IBS values range from 0 to 1
- Values close to 1 indicate the close was near the high, suggesting a bullish sentiment
- Values close to 0 indicate the close was near the low, suggesting a bearish sentiment
- Values around 0.5 suggest the close was near the middle of the range
2. Overbought/Oversold Conditions:
- IBS values above 0.8 (teal zone) may indicate overbought conditions
- IBS values below 0.2 (red zone) may indicate oversold conditions
- These zones can be used to identify potential reversal points
3. Trend Identification:
- Consistent IBS values above 0.5 may indicate an uptrend
- Consistent IBS values below 0.5 may indicate a downtrend
4. Using Moving Averages:
- The yellow MA line can help smooth out IBS fluctuations
- Crossovers between the IBS and its MA can signal potential trend changes
5. Bollinger Bands/Donchian Channel:
- When enabled, these can provide additional context for overbought/oversold conditions
- IBS touching or exceeding the upper band may indicate overbought conditions
- IBS touching or falling below the lower band may indicate oversold conditions
Remember that no single indicator should be used in isolation. Always combine IBS analysis with other technical indicators, price action analysis, and broader market context for more reliable trading decisions.
Unfilled Gaps TrackerIndicator Description: Unfilled Gaps Tracker
Overview:
The Unfilled Gaps Tracker is a powerful TradingView indicator designed to identify and visualize unfilled gaps on a price chart. This indicator highlights bullish and bearish gaps with continuous horizontal bars, helping traders quickly identify potential areas of support and resistance.
Features:
Gap Detection: Automatically detects bullish gaps (where the current low is higher than the previous close) and bearish gaps (where the current high is lower than the previous close).
Continuous Visualization: Displays gaps as horizontal bars extending to the most recent candle. Bullish gaps are filled with green, and bearish gaps are filled with red.
Single Label per Gap: Each gap is labeled once, ensuring a clean and uncluttered chart. Labels move with the gap's right edge as new bars are added.
Dynamic Updates: Gaps are dynamically updated, and the visualization adjusts as new bars are added. Gaps are removed from the chart once they are filled by subsequent price action.
Multiple Gaps: Tracks multiple gaps simultaneously, providing a comprehensive view of unfilled gaps over time.
Usage:
Adding the Indicator:
To add the Unfilled Gaps Tracker to your chart, search for "Unfilled Gaps Tracker" in the TradingView indicators menu and apply it to your desired chart.
Interpreting the Indicator:
Bullish Gaps: Represented by green horizontal bars with the label "Bull Gap." These indicate areas where the price gapped up, potentially acting as future support levels.
Bearish Gaps: Represented by red horizontal bars with the label "Bear Gap." These indicate areas where the price gapped down, potentially acting as future resistance levels.
Trading Strategy:
Use the identified gaps to inform your trading strategy. Unfilled bullish gaps can be potential buy zones, while unfilled bearish gaps can be potential sell zones.
Monitor how the price interacts with these gaps. A gap fill (where the price moves back to close the gap) can provide valuable trading signals.
Moving Average CyclesMoving Average Cycles Indicator
Description:
The Moving Average Cycles indicator is a versatile tool designed to help traders identify and analyze bullish and bearish cycles based on price movements relative to a moving average. This indicator offers valuable insights into market trends and potential reversal points.
Key Features:
Customizable Moving Average: Users can adjust the MA period and resolution (Daily, Weekly, Monthly) to suit their trading style.
Cycle Identification: The indicator tracks bull and bear cycles, providing visual cues through color-coded histograms.
Comprehensive Metrics: A detailed table displays crucial cycle statistics, including:
Current cycle information (candles and % distance from MA)
Maximum and average cycle lengths (in candles)
Maximum and average percentage distances from the MA
How to Use:
Apply the indicator to your chart and adjust the MA period and resolution as needed.
Green histograms represent bullish cycles, while red histograms indicate bearish cycles.
Use the metrics table to gain insights into historical cycle behavior and current market positioning.
This indicator is designed to complement your existing trading strategy by providing a clear visual representation of market cycles and detailed statistical information. It can be particularly useful for identifying potential trend reversals and gauging the strength of current trends compared to the past.
Note: Past performance does not guarantee future results. This indicator is meant for informational purposes only and should not be considered as financial advice. Always combine multiple analysis tools and conduct your own research before making trading decisions.
This script is published as open-source under the Mozilla Public License 2.0. Feel free to use and modify it, but please provide appropriate credit if you build upon this work.
I hope you find this Moving Average Cycles indicator helpful in your trading journey. If you have any questions or suggestions for improvement, please feel free to leave a comment below.
Zero Lag Exponential Moving Average ForLoop [InvestorUnknown]Overview
The Zero Lag Exponential Moving Average (ZLEMA) ForLoop indicator is designed for traders seeking a responsive and adaptive tool to identify trend changes. By leveraging a range of lengths and different moving average (MA) types, this indicator helps smooth out price data and provides timely signals for market entry and exit.
User Inputs
Start and End Lengths: Define the range of lengths over which the IIRF values are calculated.
Moving Average Type: Choose from EMA, SMA, WMA, VWMA, or TMA for trend smoothing.
Moving Average Length: Specify the length for the chosen MA type.
Calculation Source: Select the price data used for calculations.
Signal Calculation
Signal Mode (sigmode): Determines the type of signal generated by the indicator. Options are "Fast", "Slow", "Thresholds Crossing", and "Fast Threshold".
1. Slow: is a simple crossing of the midline (0).
2. Fast: positive signal depends if the current MA > MA or MA is above 0.99, negative signals comes if MA < MA or MA is below -0.99.
3. Thresholds Crossing: simple ta.crossover and ta.crossunder of the user defined threshold for Long and Short.
4. Fast Threshold: signal changes if the value of MA changes by more than user defined threshold against the current signal
col1 = MA > 0 ? colup : coldn
var color col2 = na
if MA > MA or MA > 0.99
col2 := colup
if MA < MA or MA < -0.99
col2 := coldn
var color col3 = na
if ta.crossover(MA,longth)
col3 := colup
if ta.crossunder(MA,shortth)
col3 := coldn
var color col4 = na
if (MA > MA + fastth)
col4 := colup
if (MA < MA - fastth)
col4 := coldn
color col = switch sigmode
"Slow" => col1
"Fast" => col2
"Thresholds Crossing" => col3
"Fast Threshold" => col4
Visualization Settings
Bull Color (colup): The color used to indicate bullish signals.
Bear Color (coldn): The color used to indicate bearish signals.
Color Bars (barcol): Option to color the bars based on the signal.
Custom function
// Function to calculate an array of ZLEMA values over a range of lengths
ZLEMAForLoop(a, b, c, s) =>
// Initialize an array to hold ZLEMA trend values
var Array = array.new_float(b - a + 1, 0.0)
// Loop through the range from 'a' to 'b'
for x = 0 to (b - a)
// Calculate the current length
len = a + x
// Calculate the lag based on the length
lag = math.floor((len - 1) / 2)
// Calculate the smoothing factor alpha
alpha = 2 / (len + 1)
// Initialize the ZLEMA variable
zlema = 0.0
// Compute the ZLEMA value
zlema := na(zlema ) ? (s + s - s ) : alpha * (s + s - s ) + (1 - alpha) * nz(zlema )
// Determine the trend based on ZLEMA value
trend = zlema > zlema ? 1 : -1
// Store the trend in the array
array.set(Array, x, trend)
// Calculate the average of the trend values
Avg = array.avg(Array)
// Apply the selected moving average type to the average trend value
float MA = switch maType
"EMA" => ta.ema(Avg, c) // Exponential Moving Average
"SMA" => ta.sma(Avg, c) // Simple Moving Average
"WMA" => ta.wma(Avg, c) // Weighted Moving Average
"VWMA" => ta.vwma(Avg, c) // Volume-Weighted Moving Average
"TMA" => ta.trima(Avg, c) // Triangular Moving Average
=>
runtime.error("No matching MA type found.") // Error handling for unsupported MA type
float(na)
// Return the array of trends, the average trend, and the moving average
Important Considerations
Speed vs. Stability: The ZLEMA ForLoop is designed for fast response times, making it ideal for short-term trading strategies. However, its sensitivity also means it may generate more signals, some of which could be false positives.
Use with Other Indicators: To improve the reliability of the signals, it is recommended to use the ZLEMA ForLoop in conjunction with other technical indicators.
Customization: Tailor the settings to match your trading style and risk tolerance. Adjusting the lengths, MA type, and thresholds can significantly impact the indicator's performance.
Conclusion
The ZLEMA ForLoop indicator offers a flexible tool for traders looking to capture trend changes quickly. By providing multiple modes and customization options, it allows traders to fine-tune their analysis and make informed decisions. For best results, use this indicator alongside other analytical tools to confirm signals and avoid potential false entries.
Infinite Impulse Response Filter ForLoop [InvestorUnknown]Overview
The Infinite Impulse Response Filter ForLoop indicator is designed for seeking quick and accurate trend identification. Leveraging the Infinite Impulse Response (IIR) filter technique, this indicator provides fast and responsive signals to aid in market timing and trend following.
User Inputs
Start and End Lengths: Define the range of lengths over which the IIRF values are calculated.
Moving Average Type: Choose from EMA, SMA, WMA, VWMA, or TMA for trend smoothing.
Moving Average Length: Specify the length for the chosen MA type.
Calculation Source: Select the price data used for calculations (default is close price).
Signal Calculation
Signal Mode (sigmode): Determines the type of signal generated by the indicator. Options are "Fast", "Slow", "Thresholds Crossing", and "Fast Threshold".
1. Slow: is a simple crossing of the midline (0).
2. Fast: positive signal depends if the current MA > MA or MA is above 0.99, negative signals comes if MA < MA or MA is below -0.99.
3. Thresholds Crossing: simple ta.crossover and ta.crossunder of the user defined threshold for Long and Short.
4. Fast Threshold: signal changes if the value of MA changes by more than user defined threshold against the current signal
col1 = MA > 0 ? colup : coldn
var color col2 = na
if MA > MA or MA > 0.99
col2 := colup
if MA < MA or MA < -0.99
col2 := coldn
var color col3 = na
if ta.crossover(MA,longth)
col3 := colup
if ta.crossunder(MA,shortth)
col3 := coldn
var color col4 = na
if (MA > MA + fastth)
col4 := colup
if (MA < MA - fastth)
col4 := coldn
color col = switch sigmode
"Slow" => col1
"Fast" => col2
"Thresholds Crossing" => col3
"Fast Threshold" => col4
Visualization Settings
Bull Color (colup): The color used to indicate bullish signals.
Bear Color (coldn): The color used to indicate bearish signals.
Color Bars (barcol): Option to color the bars based on the signal.
Custom function
// Function to calculate an array of IIRF values over a range of lengths
IIRFforLoop(a, b, c, s) =>
// Initialize an array to store IIRF values
var Array = array.new_float(b - a + 1, 0.0)
// Loop over the range from 'a' to 'b'
for x = 0 to (b - a)
// Calculate the length for the current iteration
len = a + x
// Calculate the IIRF alpha parameter
iirfAlpha = 2 / (len + 1)
// Calculate the lag for the IIRF calculation
iirfLag = math.round(1 / iirfAlpha - 1)
// Initialize the IIRF value
iirf = 0.0
// Update the IIRF value using the IIR filter formula
iirf := iirfAlpha * (s + ta.change(s, iirfLag)) + (1 - iirfAlpha) * nz(iirf )
// Determine the trend based on the current and previous IIRF values
trend = iirf > iirf ? 1 : -1
// Store the trend value in the array
array.set(Array, x, trend)
// Calculate the average of the IIRF values in the array
Avg = array.avg(Array)
// Calculate the moving average of the average IIRF values based on the selected MA type
float MA = switch maType
"EMA" => ta.ema(Avg, c) // Exponential Moving Average
"SMA" => ta.sma(Avg, c) // Simple Moving Average
"WMA" => ta.wma(Avg, c) // Weighted Moving Average
"VWMA" => ta.vwma(Avg, c) // Volume Weighted Moving Average
"TMA" => ta.trima(Avg, c) // Triangular Moving Average
=>
runtime.error("No matching MA type found.") // Error handling for invalid MA type
float(na)
// Return the array of IIRF values, their average, and the moving average
Important Considerations
Rapid Signal Response: The IIRF ForLoop is designed to provide very fast trend signals, making it suitable for short-term trading and quick decision-making.
Complementary Tool: While powerful, the IIRF ForLoop should be used in conjunction with other indicators and market analysis techniques to confirm signals and improve trading accuracy.
Conclusion
The Infinite Impulse Response Filter ForLoop indicator is a highly responsive and flexible tool that can significantly enhance your trading strategy. Its ability to quickly identify trends and generate signals based on various moving average types and customizable thresholds makes it invaluable for active traders. For the best results, use this indicator alongside other technical analysis tools to confirm signals and ensure robust trading decisions.
Aroon ForLoop [InvestorUnknown]Overview
The Aroon ForLoop indicator is designed to calculate an array of Aroon values over a range of lengths, providing trend signals based on various moving averages. It offers flexibility with different signal modes and visual customizations.
User Input
Start Length (a) and End Length (b): Defines the range for calculating Aroon values.
MA Type (maType) and MA Length (c): Selects the moving average type (EMA, SMA, WMA, VWMA, TMA) and its length.
Calculation Source (s): Specifies the data source for calculations.
Signal Mode (sigmode): Offers options like Fast, Slow, Thresholds Crossing, and Fast Threshold to generate signals.
Thresholds: Configures long and short thresholds for signal generation.
Visualization Options: Customizes bull and bear colors, and enables/disables bar coloring.
Alert Settings: Chooses whether to wait for bar close for alert confirmation.
Signal Calculation
Signal Mode (sigmode): Determines the type of signal generated by the indicator. Options are "Fast", "Slow", "Thresholds Crossing", and "Fast Threshold".
1. Slow: is a simple crossing of the midline (0).
2. Fast: positive signal depends if the current MA > MA or MA is above 0.99, negative signals comes if MA < MA or MA is below -0.99.
3. Thresholds Crossing: simple ta.crossover and ta.crossunder of the user defined threshold for Long and Short.
4. Fast Threshold: signal changes if the value of Aroon MA changes by more than user defined threshold against the current signal
col1 = MA > 0 ? colup : coldn
var color col2 = na
if MA > MA or MA > 0.99
col2 := colup
if MA < MA or MA < -0.99
col2 := coldn
var color col3 = na
if ta.crossover(MA,longth)
col3 := colup
if ta.crossunder(MA,shortth)
col3 := coldn
var color col4 = na
if (MA > MA + fastth)
col4 := colup
if (MA < MA - fastth)
col4 := coldn
color col = na
if sigmode == "Slow"
col := col1
if sigmode == "Fast"
col := col2
if sigmode == "Thresholds Crossing"
col := col3
if sigmode == "Fast Threshold"
col := col4
else
na
Visualization Settings
Bull Color (colup): The color used to indicate bullish signals.
Bear Color (coldn): The color used to indicate bearish signals.
Color Bars (barcol): Option to color the bars based on the signal.
Custom Function
AroonForLoop: Calculates Aroon values over the specified range, determines the trend, and averages the results using the chosen moving average type.
AroonForLoop(a, b, c) =>
var SignalArray = array.new_float(b - a + 1, 0.0)
for x = 0 to (b - a)
len = a + x
upper = 100 * (ta.highestbars(high, len + 1) + len)/len
lower = 100 * (ta.lowestbars(low, len + 1) + len)/len
trend = upper > lower ? 1 : -1
array.set(SignalArray, x, trend)
Avg = array.avg(SignalArray)
float MA = switch maType
"EMA" => ta.ema(Avg, c)
"SMA" => ta.sma(Avg, c)
"WMA" => ta.wma(Avg, c)
"VWMA" => ta.vwma(Avg, c)
"TMA" => ta.trima(Avg, c)
=>
runtime.error("No matching MA type found.")
float(na)
Important Considerations
Fast Responses: The Aroon ForLoop indicator is designed for quick identification of trend changes, making it ideal for fast-paced trading environments.
Moving Average Types: Supports various MA types (EMA, SMA, WMA, VWMA, TMA) for adaptable smoothing of trend signals.
Combination with Other Indicators: For more reliable signals, use this indicator in conjunction with other technical indicators.
Fisher ForLoop [InvestorUnknown]Overview
The Fisher ForLoop indicator is designed to apply the Fisher Transform over a range of lengths and signal modes. It calculates an array of Fisher values, averages them, and then applies an EMA to these values to derive a trend signal. This indicator can be customized with various settings to suit different trading strategies.
User Inputs
Start Length (a): The initial length for the Fisher Transform calculation (inclusive).
End Length (b): The final length for the Fisher Transform calculation (inclusive).
EMA Length (c): The length of the EMA applied to the average Fisher values.
Calculation Source (s): The price source used for calculations (e.g., ohlc4).
Signal Calculation
Signal Mode (sigmode): Determines the type of signal generated by the indicator. Options are "Fast", "Slow", "Thresholds Crossing", and "Fast Threshold".
1. Slow: is a simple crossing of the midline (0).
2. Fast: positive signal depends if the current Fisher EMA is above Fisher EMA or above 0.99, otherwise the signal is negative.
3. Thresholds Crossing: simple ta.crossover and ta.crossunder of the user defined threshold for Long and Short.
4. Fast Threshold: signal changes if the value of Fisher EMA changes by more than user defined threshold against the current signal
// Determine the color based on the EMA value
// If EMA is greater than 0, use the bullish color, otherwise use the bearish color
col1 = EMA > 0 ? colup : coldn
// Determine the color based on the EMA trend
// If the current EMA is greater than the previous EMA or greater than 0.99, use the bullish color, otherwise use the bearish color
col2 = EMA > EMA or EMA > 0.99 ? colup : coldn
// Initialize a variable for the color based on threshold crossings
var color col3 = na
// If the EMA crosses over the long threshold, set the color to bullish
if ta.crossover(EMA, longth)
col3 := colup
// If the EMA crosses under the short threshold, set the color to bearish
if ta.crossunder(EMA, shortth)
col3 := coldn
// Initialize a variable for the color based on fast threshold changes
var color col4 = na
// If the EMA increases by more than the fast threshold, set the color to bullish
if (EMA > EMA + fastth)
col4 := colup
// If the EMA decreases by more than the fast threshold, set the color to bearish
if (EMA < EMA - fastth)
col4 := coldn
// Initialize the final color variable
color col = na
// Set the color based on the selected signal mode
if sigmode == "Slow"
col := col1 // Use slow mode color
if sigmode == "Fast"
col := col2 // Use fast mode color
if sigmode == "Thresholds Crossing"
col := col3 // Use thresholds crossing color
if sigmode == "Fast Threshold"
col := col4 // Use fast threshold color
else
na // If no valid signal mode is selected, set color to na
Visualization Settings
Bull Color (colup): The color used to indicate bullish signals.
Bear Color (coldn): The color used to indicate bearish signals.
Color Bars (barcol): Option to color the bars based on the signal.
Custom Function: FisherForLoop
This function calculates an array of Fisher values over a specified range of lengths (from a to b). It then computes the average of these values and applies an EMA to derive the final trend signal.
// Function to calculate an array of Fisher values over a range of lengths
FisherForLoop(a, b, c, s) =>
// Initialize an array to store Fisher values for each length
var FisherArray = array.new_float(b - a + 1, 0.0)
// Loop through each length from 'a' to 'b'
for x = 0 to (b - a)
// Calculate the current length
len = a + x
// Calculate the highest and lowest values over the current length
high_ = ta.highest(s, len)
low_ = ta.lowest(s, len)
// Initialize the value variable
value = 0.0
// Update the value using the Fisher Transform formula
// The formula normalizes the price to a range between -0.5 and 0.5, then smooths it
value := .66 * ((s - low_) / (high_ - low_) - .5) + .67 * nz(value )
// Clamp the value to be within -0.999 to 0.999 to avoid math errors
val = value > .99 ? .999 : value < -.99 ? -.999 : value
// Initialize the fish1 variable
fish1 = 0.0
// Apply the Fisher Transform to the normalized value
// This converts the value to a Fisher value, which emphasizes extreme changes in price
fish1 := .5 * math.log((1 + val) / (1 - val)) + .5 * nz(fish1 )
// Store the previous Fisher value for comparison
fish2 = fish1
// Determine the trend based on the Fisher values
// If the current Fisher value is greater than the previous, the trend is up (1)
// Otherwise, the trend is down (-1)
trend = fish1 > fish2 ? 1 : -1
// Store the trend in the FisherArray at the current index
array.set(FisherArray, x, trend)
// Calculate the average of the FisherArray
Avg = array.avg(FisherArray)
// Apply an EMA to the average Fisher values to smooth the result
EMA = ta.ema(Avg, c)
// Return the FisherArray, the average, and the EMA
// Call the FisherForLoop function with the user-defined inputs
= FisherForLoop(a, b, c, s)
Important Considerations
Speed: This indicator is very fast and can provide rapid signals for potential entries. However, this speed also means it may generate false signals if used in isolation.
Complementary Use: It is recommended to use this indicator in conjunction with other indicators and analysis methods to confirm signals and enhance the reliability of your trading strategy.
Strength: The main strength of the Fisher ForLoop indicator is its ability to identify very fast entries and prevent entries against the current (short-term) market trend.
This indicator is useful for identifying trends and potential reversal points in the market, providing flexibility through its customizable settings. However, due to its sensitivity and speed, it should be used as part of a broader trading strategy rather than as a standalone tool.
ET's FlagsPurpose:
This Pine Script is designed for the TradingView platform to identify and visually highlight specific technical chart patterns known as "Bull Flags" and "Bear Flags" on financial charts. These patterns are significant in trading as they can indicate potential continuation trends after a brief consolidation. The script includes mechanisms to manage signal frequency through a cooldown period, ensuring that the trading signals are not excessively frequent and are easier to interpret.
Functionality:
Input Parameters:
flagpole_length: Defines the number of bars to consider when identifying the initial surge in price, known as the flagpole.
flag_length: Determines the number of bars over which the flag itself is identified, representing a period of consolidation.
percent_change: Sets the minimum percentage change required to validate the presence of a flagpole.
cooldown_period: Specifies the number of bars to wait before another flag can be identified, reducing the risk of overlapping signals.
Percentage Change Calculation:
The script calculates the percentage change between two price points using a helper function percentChange(start, end). This function is crucial for determining whether the price movement within the specified flagpole_length meets the threshold set by percent_change, thus qualifying as a potential flagpole.
Flagpole Identification:
Bull Flagpole: Identified by finding the lowest close price over the flagpole_length and determining if the subsequent price rise meets or exceeds the specified percent_change.
Bear Flagpole: Identified by finding the highest close price over the flagpole_length and checking if the subsequent price drop is sufficient as per the percent_change.
Flag Identification:
After identifying a flagpole, the script assesses if the price action within the next flag_length bars consolidates in a manner that fits a flag pattern. This involves checking if the price fluctuation stays within the bounds set by the percent_change.
Signal Plotting:
If a bull or bear flag pattern is confirmed, and the cooldown period has passed since the last flag of the same type was identified, the script plots a visual shape on the chart:
Green shapes below the price bar for Bull Flags.
Red shapes above the price bar for Bear Flags.
Line Drawing:
For enhanced visualization, the script draws lines at the high and low prices of the flag during its formation period. This visually represents the consolidation phase of the flag pattern.
Debugging Labels:
The script optionally displays labels at the flag formation points, showing the exact percentage change achieved during the flagpole formation. This feature aids users in understanding why a particular segment of the price chart was identified as a flag.
Compliance and Usage:
This script does not automate trading but provides visual aids and potential signals based on historical price analysis. It adheres to TradingView's scripting policies by only accessing publicly available price data and user-defined parameters without executing trades or accessing any external data.
Conclusion:
This Pine Script is a powerful tool for traders who follow technical analysis, offering a clear, automated way to spot potential continuation patterns in the markets they monitor. By emphasizing visual clarity and reducing signal redundancy through cooldown periods, the script enhances decision-making processes for chart analysis on TradingView.
Support and Resistance [CryptoSea]The Support and Resistance Indicator is a powerful tool developed by CryptoSea for traders seeking to identify key market levels with precision. This script leverages advanced pivot and volume analysis to highlight support and resistance zones on the price chart.
Key Features
Multi-Source Pivot Analysis: Choose between wicks or body prices for calculating pivot points, providing flexibility in market analysis.
Volume Spike Detection: Automatically identifies volume spikes using a customizable threshold multiplier, enhancing the accuracy of support and resistance levels.
Dynamic Box Display: Configurable options for extending and graying out boxes based on price interaction, ensuring a clear visual representation of active and invalidated zones.
In the example below, we see a resistance box formed based on wick highs and a volume spike. The box extends to where we see price rejecting from it. In the settings you can change this so the box will stop if price touches it if you prefer.
How it Works
Pivot Point Calculation: The script determines pivot highs and lows using either wicks or body prices over a specified term (Short, Medium, Long), corresponding to 5, 15, or 30 bars.
Volume Analysis: Calculates average volume over twice the pivot length and identifies volume spikes exceeding the user-defined threshold, crucial for confirming support and resistance levels.
Box Management: Maintains arrays of support and resistance boxes, limiting the number based on user settings (All, Recent Few, Recent Several).
Settings Explained
Source: Choose between 'Wicks' or 'Bodies' to determine whether pivot points are calculated using candle wicks or body prices.
Pivot Term: Select 'Short' (5 bars), 'Medium' (15 bars), or 'Long' (30 bars) to adjust the distance for pivot calculation. Longer terms take more bars to confirm support/resistance.
Volume Threshold (multiplier): Set a multiplier of average volume to detect volume spikes, essential for validating support/resistance levels.
Extend Until Price Hits: Enable this to extend support/resistance boxes until the price touches them, providing dynamic levels.
Gray Out Boxes Once Hit: Enable this to gray out the boxes once the price interacts with them, indicating that they are no longer active.
Max Boxes Displayed: Choose 'All', 'Recent Few' (up to 3 boxes each for bull and bear), or 'Recent Several' (up to 10 boxes each for bull and bear) to control the number of visible boxes.
Invalidate Condition: Select 'Touch' to invalidate a box when the price touches it or 'Through' to invalidate when the price passes entirely through the box.
Candle Colors: Option to color candles based on neutral, bullish, or bearish conditions for easier visual analysis.
Application
Strategic Planning: Assists traders in pinpointing potential entry and exit points by marking significant support and resistance zones.
Trend Confirmation: Validates trend strength and potential reversals with volume-based analysis of support and resistance levels.
Customizable Settings: Tailors analysis to various trading strategies with extensive input settings for pivot source, term, volume threshold, and display preferences.
The Support and Resistance Indicator by is an essential addition to any trader’s toolkit, offering robust and customizable market level analysis for improved trading decisions.
Cumulative Volume Delta (MTF)Cumulative Volume Delta (CVD) Indicator
The Cumulative Volume Delta (CVD) indicator is a powerful analytical tool used to understand the behavior and dynamics of market participants through volume analysis. It tracks the net difference between buying and selling pressure, providing insights into market trends and potential reversals. Here's a detailed description of this indicator and its components:
The Cumulative Volume Delta (CVD) indicator calculates the cumulative net difference between buying and selling volume over a specified period. By analyzing this net difference, traders can gain insights into the underlying strength or weakness of a price movement, helping to identify trends, reversals, and potential breakout points.
Key Components:
Bull & Bear Power Calculation:
Bull Power: Represents the strength of buyers in the market. It is calculated based on the relationship between the current and previous price bars. A higher Bull Power indicates stronger buying pressure.
Bear Power: Represents the strength of sellers in the market. It is also calculated based on the relationship between the current and previous price bars. A higher Bear Power indicates stronger selling pressure.
Bull & Bear Volume Calculation:
Bull Volume: The volume attributed to buying pressure. It is calculated by taking the proportion of Bull Power relative to the total of Bull Power and Bear Power, multiplied by the total volume.
Bear Volume: The volume attributed to selling pressure. It is calculated similarly to Bull Volume but using Bear Power.
Delta Calculation:
Delta: The net difference between Bull Volume and Bear Volume for each bar. A positive Delta indicates more buying pressure, while a negative Delta indicates more selling pressure.
Cumulative Volume Delta (CVD):
CVD: The running total of the Delta values over time. It accumulates the net buying and selling pressure to provide a visual representation of the market's cumulative sentiment.
Moving Average of CVD (CVD MA):
CVD MA: A simple moving average of the CVD, used to smooth out fluctuations and help identify the overall trend. It provides a baseline to compare the current CVD value against, highlighting divergences or convergences.
Multi-Timeframe Functionality:
The enhanced version of the CVD indicator includes multi-timeframe (MTF) capabilities, allowing users to select and analyze data from different timeframes. This feature enhances the versatility of the indicator by providing a broader perspective on market dynamics across various time intervals.
Practical Applications:
Trend Identification: By tracking the CVD and its moving average, traders can identify the prevailing trend. An upward-sloping CVD indicates sustained buying pressure, while a downward-sloping CVD indicates sustained selling pressure.
Divergences: Divergences between the CVD and price can signal potential reversals. For example, if the price is making new highs but the CVD is not, it may indicate weakening buying pressure and a potential reversal.
Breakout Confirmation: Significant changes in the CVD can confirm breakouts. A sharp increase in the CVD during a price breakout indicates strong buying support, adding confidence to the breakout.
Support and Resistance Levels: The CVD can help identify significant support and resistance levels based on changes in volume dynamics. For instance, a notable increase in buying volume at a support level can reinforce its strength.
Market Sentiment Technicals [LuxAlgo]The Market Sentiment Technicals indicator synthesizes insights from diverse technical analysis techniques, including price action market structures, trend indicators, volatility indicators, momentum oscillators, and more.
The indicator consolidates the evaluated outputs from these techniques into a singular value and presents the combined data through an oscillator format, technical rating, and a histogram panel featuring the sentiment of each component alongside the overall sentiment.
🔶 USAGE
The Market Sentiment Technicals indicator is a tool able to swiftly and easily gauge market sentiment by consolidating the individual sentiment from multiple technical analysis techniques applied to market data into a single value, allowing users to asses if the market is uptrending, consolidating, or downtrending.
The tool includes various components and presentation formats, each described in the sub-sections below.
🔹Indicators Sentiment Panel
The indicators sentiment panel provides normalized sentiment scores for each supported indicator, along with a synthesized representation derived from the average of all individual normalized sentiments.
🔹Market Sentiment Meter
The market sentiment meter is obtained from the synthesized representation derived from the average of all individual normalized sentiments. It allows users to quickly and easily gauge the overall market sentiment.
🔹Market Sentiment Oscillator
The market sentiment oscillator provides a visual means to monitor the current and historical strength of the market. It assists in identifying the trend direction, trend momentum, and overbought and oversold conditions, aiding in the anticipation of potential trend reversals.
Divergence occurs when there is a difference between what the price action is indicating and what the market sentiment oscillator is indicating, helping traders assess changes in the price trend.
🔶 DETAILS
The indicator employs a range of technical analysis techniques to interpret market data. Each group of indicators provides valuable insights into different aspects of market behavior.
🔹Momentum Indicators
Momentum indicators assess the speed and change of price movements, often indicating whether a trend is strengthening or weakening.
Relative Strength Index (RSI): Measures the magnitude of recent price changes to evaluate overbought or oversold conditions.
Stochastic %K: Compares the closing price to the range over a specified period to identify potential reversal points.
Stochastic RSI Fast: Combines features of Stochastic oscillators and RSI to gauge both momentum and overbought/oversold levels efficiently.
Commodity Channel Index (CCI): Measures the deviation of an asset's price from its statistical average to determine trend strength and overbought and oversold conditions.
Bull Bear Power: Evaluates the strength of buying and selling pressure in the market.
🔹Trend Indicators
Trend indicators help traders identify the direction of a market trend.
Moving Averages: Provides a smoothed representation of the underlying price data, aiding in trend identification and analysis.
Bollinger Bands: Consists of a middle band (typically a simple moving average) and upper and lower bands, which represent volatility levels of the market.
Supertrend: A trailing stop able to identify the current direction of the trend.
Linear Regression: Fits a straight line to past data points to predict future price movements and identify trend direction.
🔹Market Structures
Market Structures: Analyzes the overall pattern of price movements, including Break of Structure (BOS), Market Structure Shifts (MSS), also referred to as Change of Character (CHoCH), aiding in identifying potential market turning and continuation points.
🔹The Normalization Technique
The normalization technique employed for trend indicators relies on buy-sell signals. The script tracks price movements and normalizes them based on these signals.
normalize(buy, sell, smooth)=>
var os = 0
var float max = na
var float min = na
os := buy ? 1 : sell ? -1 : os
max := os > os ? close : os < os ? max : math.max(close, max)
min := os < os ? close : os > os ? min : math.min(close, min)
ta.sma((close - min)/(max - min), smooth) * 100
In this Pine Script snippet:
The variable os tracks market sentiment, taking a value of 1 for buy signals and -1 for sell signals, indicating bullish and bearish sentiments, respectively.
max and min are used to identify extremes in sentiment and are updated based on changes in os . When market sentiment shifts from buying to selling (or vice versa), max and min adjust accordingly.
Normalization is achieved by comparing current price levels to historical extremes in sentiment. The result is smoothed by default using a 3-period simple moving average. Users have the option to customize the smoothing period via the script settings input menu.
🔶 SETTINGS
🔹Generic Settings
Timeframe: This option selects the timeframe for calculating sentiment. If a timeframe lower than the chart's is chosen, calculations will be based on the chart's timeframe.
Horizontal Offset: Determines the distance at which the visual components of the indicator will be displayed from the primary chart.
Gradient Colors: Allows customization of gradient colors.
🔹Indicators Sentiment Panel
Indicators Sentiment Panel: Toggle the visibility of the indicators sentiment panel.
Panel Height: Determines the height of the panel.
🔹Market Sentiment Meter
Market Sentiment Meter: Toggle the visibility of the market sentiment meter (technical ratings in the shape of a speedometer).
🔹Market Sentiment Oscillator
Market Sentiment Oscillator: Toggle the visibility of the market sentiment oscillator.
Show Divergence: Enables detection of divergences based on the selected option.
Oscillator Line Width: Customization option for the line width.
Oscillator Height: Determines the height of the oscillator.
🔹Settings for Individual Components
In general,
Source: Determines the data source for calculations.
Length: The period to be used in calculations.
Smoothing: Degree of smoothness of the evaluated values.
🔹Normalization Settings - Trend Indicators
Smoothing: The period used in smoothing normalized values, where normalization is applied to moving averages, Bollinger Bands, Supertrend, VWAP bands, and market structures.
🔶 LIMITATIONS
Like any technical analysis tool, the Market Sentiment Technicals indicator has limitations. It's based on historical data and patterns, which may not always accurately predict future market movements. Additionally, market sentiment can be influenced by various factors, including economic news, geopolitical events, and market psychology, which may not be fully captured by technical analysis alone.
signalLib_yashgode9Signal Generation Library = "signalLib_yashgode9"
This library, named "signalLib_yashgode9", is designed to generate buy and sell signals based on the price action of a financial instrument. It utilizes various technical indicators and parameters to determine the market direction and provide actionable signals for traders.
Key Features:-
1.Trend Direction Identification: The library calculates the trend direction by comparing the number of bars since the highest and lowest prices within a specified depth. This allows the library to determine the overall market direction, whether it's bullish or bearish.
2.Dynamic Price Tracking: The library maintains two chart points, zee1 and zee2, which dynamically track the price levels based on the identified market direction. These points serve as reference levels for generating buy and sell signals.
3.Customizable Parameters: The library allows users to adjust several parameters, including the depth of the price analysis, the deviation threshold, and the number of bars to consider for the trend direction. This flexibility enables users to fine-tune the library's behavior to suit their trading strategies.
4.Visual Representation: The library provides a visual representation of the buy and sell signals by drawing a line between the zee1 and zee2 chart points. The line's color changes based on the identified market direction, with red indicating a bearish signal and green indicating a bullish signal.
Usage and Integration:
To use this library, you can call the "signalLib_yashgode9" function and pass in the necessary parameters, such as the lower and higher prices, the depth of the analysis, the deviation threshold, and the number of bars to consider for the trend direction. The function will return the direction of the market (1 for bullish, -1 for bearish), as well as the zee1 and zee2 chart points.You can then use these values to generate buy and sell signals in your trading strategy. For example, you could use the direction value to determine when to enter or exit a trade, and the zee1 and zee2 chart points to set stop-loss or take-profit levels.
Potential Use Cases:
This library can be particularly useful for traders who:
1.Trend-following Strategies: The library's ability to identify the market direction can be beneficial for traders who employ trend-following strategies, as it can help them identify the dominant trend and time their entries and exits accordingly.
2.Swing Trading: The dynamic price tracking provided by the zee1 and zee2 chart points can be useful for swing traders, who aim to capture medium-term price movements.
3.Automated Trading Systems: The library's functionality can be integrated into automated trading systems, allowing for the development of more sophisticated and rule-based trading strategies.
4.Educational Purposes: The library can also be used for educational purposes, as it provides a clear and concise way to demonstrate the application of technical analysis concepts in a trading context.
Important Notice:- This library effectively work on timeframe of 5-minute and 15-minute.
Multi-Timeframe Trend Cloud (EMA13/21) with Alerts Purpose:
This indicator combines trend analysis across multiple timeframes with alerts to help identify general trends and market shifts. It visualizes trends by creating EMA clouds (The area between EMA13 & EMA21), detects confirmed EMA crossovers, and can alert users when the price re-enters the cloud or interacts with the EMA200.
Input Parameters:
Lower Timeframe (LTF): Allows you to select the lower timeframe for trend analysis (e.g., 1 hour, 4 hours).
Higher Timeframe (HTF): Allows you to select the higher timeframe for the main trend reference (e.g., 4 hours, 1 day).
Fill Colors: You can customize the colors used to fill the areas between the EMA lines in both the higher and lower timeframes. Note: The LTF cloud defaults to transparent white so if you have a light background change the color in style settings.
The EMA's default to transparent but can be turned on in the style settings.
Calculating & Plotting EMAs:
The indicator calculates two Exponential Moving Averages (EMAs) on both the LTF and HTF: a faster 13-period EMA and a slower 21-period EMA.
Additionally, it calculates a 200-period EMA on the HTF.
These EMAs are plotted on your chart, providing a visual representation of the trend.
Identifying Trend States:
The script uses the relationships between the price and the 13-period and 21-period EMAs on the Higher Time Frame (HTF) to identify four distinct trend states, each depicted by a specific color to create the "Trend Cloud":
Strong Bull Trend: The 13-period EMA is above the 21-period EMA, and the price is above both EMAs. --- "Color 0" in HTF Trend style settings.
Broken Bullish Trend: The 13-period EMA is above the 21-period EMA but price has broken below both EMA's. --- "Color 3" in HTF Trend style settings.
Strong Bear Trend: The 13-period EMA is below the 21-period EMA, and the price is below both EMAs. --- "Color 2" in HTF Trend style settings.
Broken Bearish Trend: The 13-period EMA is below the 21-period EMA but price has broken above both EMA's. --- "Color 1" in HTF Trend style settings.
Important Note: The 200-period EMA is plotted for reference but is not directly used in determining the current trend state within this script.
Confirmed Crossover Signals:
The indicator plots upward or downward triangles to signal confirmed crossovers of the EMA13 and EMA21 on the HTF. A crossover is considered "confirmed" when it's followed by a candle closing on the same side of the crossing point, adding an extra layer of confidence to the signal.
Cloud Re-entry Alerts:
Receive alerts whenever the price re-enters the HTF cloud - aka "Trend".
EMA200 Retest Alerts:
Get alerts when the price touches the 200 EMA on the HTF. These alerts can be valuable for identifying potential trend reversals or trend continuation scenarios.
Benefits:
Clear Visual Representation: Easily visualize trends on both the lower and higher timeframes.
Confirmed Signals: Filter out false signals by focusing on confirmed crossovers.
Timely Alerts: Get instant notifications for important price actions, allowing you to react quickly to market opportunities.
Customizable: Tailor the indicator's appearance and alert settings to your preferences.
How to Use:
Add the indicator to your chart.
Select your desired LTF and HTF in the Inputs tab.
Customize the fill colors (and optional EMA line colors) in the Style tab.
Enable the alerts you want to receive in the Alerts tab.
Note: This indicator is a great tool for trend analysis, but it should be used with other forms of analysis and risk management techniques to make informed trading decisions.
Ichimoku Theories [LuxAlgo]The Ichimoku Theories indicator is the most complete Ichimoku tool you will ever need. Four tools combined into one to harness all the power of Ichimoku Kinkō Hyō.
This tool features the following concepts based on the work of Goichi Hosoda:
Ichimoku Kinkō Hyō: Original Ichimoku indicator with its five main lines and kumo.
Time Theory: automatic time cycle identification and forecasting to understand market timing.
Wave Theory: automatic wave identification to understand market structure.
Price Theory: automatic identification of developing N waves and possible price targets to understand future price behavior.
🔶 ICHIMOKU KINKŌ HYŌ
Ichimoku with lines only, Kumo only and both together
Let us start with the basics: the Ichimoku original indicator is a tool to understand the market, not to predict it, it is a trend-following tool, so it is best used in trending markets.
Ichimoku tells us what is happening in the market and what may happen next, the aim of the tool is to provide market understanding, not trading signals.
The tool is based on calculating the mid-point between the high and low of three pre-defined ranges as the equilibrium price for short (9 periods), medium (26 periods), and long (52 periods) time horizons:
Tenkan sen: middle point of the range of the last 9 candles
Kinjun sen: middle point of the range of the last 26 candles
Senkou span A: middle point between Tankan Sen and Kijun Sen, plotted 26 candles into the future
Senkou span B: midpoint of the range of the last 52 candles, plotted 26 candles into the future
Chikou span: closing price plotted 26 candles into the past
Kumo: area between Senkou pans A and B (kumo means cloud in Japanese)
The most basic use of the tool is to use the Kumo as an area of possible support or resistance.
🔶 TIME THEORY
Current cycles and forecast
Time theory is a critical concept used to identify historical and current market cycles, and use these to forecast the next ones. This concept is based on the Kihon Suchi (translating to "Basic Numbers" in Japanese), these are 9 and 26, and from their combinations we obtain the following sequence:
9, 17, 26, 33, 42, 51, 65, 76, 129, 172, 200, 257
The main idea is that the market moves in cycles with periods set by the Kihon Suchi sequence.
When the cycle has the same exact periods, we obtain the Taito Suchi (translating to "Same Number" in Japanese).
This tool allows traders to identify historical and current market cycles and forecast the next one.
🔹 Time Cycle Identification
Presentation of 4 different modes: SWINGS, HIGHS, KINJUN, and WAVES .
The tool draws a horizontal line at the bottom of the chart showing the cycles detected and their size.
The following settings are used:
Time Cycle Mode: up to 7 different modes
Wave Cycle: Which wave to use when WAVE mode is selected, only active waves in the Wave Theory settings will be used.
Show Time Cycles: keep a cleaner chart by disabling cycles visualisation
Show last X time cycles: how many cycles to display
🔹 Time Cycle Forecast
Showcasing the two forecasting patterns: Kihon Suchi and Taito Suchi
The tool plots horizontal lines, a solid anchor line, and several dotted forecast lines.
The following settings are used:
Show time cycle forecast: to keep things clean
Forecast Pattern: comes in two flavors
Kihon Suchi plots a line from the anchor at each number in the Kihon Suchi sequence.
Taito Suchi plot lines from the anchor with the same size detected in the anchored cycle
Anchor forecast on last X time cycle: traders can place the anchor in any detected cycle
🔶 WAVE THEORY
All waves activated with overlapping
The main idea behind this theory is that markets move like waves in the sea, back and forth (making swing lows and highs). Understanding the current market structure is key to having realistic expectations of what the market may do next. The waves are divided into Simple and Complex.
The following settings are used:
Basic Waves: allows traders to activate waves I, V and N
Complex Waves: allows traders to activate waves P, Y and W
Overlapping waves: to avoid missing out on any of the waves activated
Show last X waves: how many waves will be displayed
🔹 Basic Waves
The three basic waves
The basic waves from which all waves are made are I, V, and N
I wave: one leg moves
V wave: two legs move, one against the other
N wave: Three legs move, push, pull back, and another push
🔹 Complex Waves
Three complex waves
There are other waves like
P wave: contracting market
Y wave: expanding market
W wave: double top or double bottom
🔶 PRICE THEORY
All targets for the current N wave with their calculations
This theory is based on identifying developing N waves and predicting potential price targets based on that developing wave.
The tool displays 4 basic targets (V, E, N, and NT) and 3 extended targets (2E and 3E) according to the calculations shown in the chart above. Traders can enable or disable each target in the settings panel.
🔶 USING EVERYTHING TOGETHER
Please DON'T do this. This is not how you use it
Now the real example:
Daily chart of Nasdaq 100 futures (NQ1!) with our Ichimoku analysis
Time, waves, and price theories go together as one:
First, we identify the current time cycles and wave structure.
Then we forecast the next cycle and possible key price levels.
We identify a Taito Suchi with both legs of exactly 41 candles on each I wave, both together forming a V wave, the last two I waves are part of a developing N wave, and the time cycle of the first one is 191 candles. We forecast this cycle into the future and get 22nd April as a key date, so in 6 trading days (as of this writing) the market would have completed another Taito Suchi pattern if a new wave and time cycle starts. As we have a developing N wave we can see the potential price targets, the price is actually between the NT and V targets. We have a bullish Kumo and the price is touching it, if this Kumo provides enough support for the price to go further, the market could reach N or E targets.
So we have identified the cycle and wave, our expectations are that the current cycle is another Taito Suchi and the current wave is an N wave, the first I wave went for 191 candles, and we expect the second and third I waves together to amount to 191 candles, so in theory the N wave would complete in the next 6 trading days making a swing high. If this is indeed the case, the price could reach the V target (it is almost there) or even the N target if the bulls have the necessary strength.
We do not predict the future, we can only aim to understand the current market conditions and have future expectations of when (time), how (wave), and where (price) the market will make the next turning point where one side of the market overcomes the other (bulls vs bears).
To generate this chart, we change the following settings from the default ones:
Swing length: 64
Show lines: disabled
Forecast pattern: TAITO SUCHI
Anchor forecast: 2
Show last time cycles: 5
I WAVE: enabled
N WAVE: disabled
Show last waves: 5
🔶 SETTINGS
Show Swing Highs & Lows: Enable/Disable points on swing highs and swing lows.
Swing Length: Number of candles to confirm a swing high or swing low. A higher number detects larger swings.
🔹 Ichimoku Kinkō Hyō
Show Lines: Enable/Disable the 5 Ichimoku lines: Kijun sen, Tenkan sen, Senkou span A & B and Chikou Span.
Show Kumo: Enable/Disable the Kumo (cloud). The Kumo is formed by 2 lines: Senkou Span A and Senkou Span B.
Tenkan Sen Length: Number of candles for Tenkan Sen calculation.
Kinjun Sen Length: Number of candles for the Kijun Sen calculation.
Senkou Span B Length: Number of candles for Senkou Span B calculation.
Chikou & Senkou Offset: Number of candles for Chikou and Senkou Span calculation. Chikou Span is plotted in the past, and Senkou Span A & B in the future.
🔹 Time Theory
Show Time Cycle Forecast: Enable/Disable time cycle forecast vertical lines. Disable for better performance.
Forecast Pattern: Choose between two patterns: Kihon Suchi (basic numbers) or Taito Suchi (equal numbers).
Anchor forecast on last X time cycle: Number of time cycles in the past to anchor the time cycle forecast. The larger the number, the deeper in the past the anchor will be.
Time Cycle Mode: Choose from 7 time cycle detection modes: Tenkan Sen cross, Kijun Sen cross, Kumo change between bullish & bearish, swing highs only, swing lows only, both swing highs & lows and wave detection.
Wave Cycle: Choose which type of wave to detect from 6 different wave types when the time cycle mode is set to WAVES.
Show Time Cycles: Enable/Disable time cycle horizontal lines. Disable for better performance.
how last X time cycles: Maximum number of time cycles to display.
🔹 Wave Theory
Basic Waves: Enable/Disable the display of basic waves, all at once or one at a time. Disable for better performance.
Complex Waves: Enable/Disable complex wave display, all at once or one by one. Disable for better performance.
Overlapping Waves: Enable/Disable the display of waves ending on the same swing point.
Show last X waves: 'Maximum number of waves to display.
🔹 Price Theory
Basic Targets: Enable/Disable horizontal price target lines. Disable for better performance.
Extended Targets: Enable/Disable extended price target horizontal lines. Disable for better performance.
Net Buying/Selling Flows Toolkit [AlgoAlpha]🌟📊 Introducing the Net Buying/Selling Flows Toolkit by AlgoAlpha 📈🚀
🔍 Explore the intricate dynamics of market movements with the Net Buying/Selling Flows Toolkit designed for precision and effectiveness in visualizing money inflows and outflows and their impact on asset prices.
🔀 Multiple Display Modes : Choose from "Flow Comparison", "Net Flow", or "Sum of Flows" to view the data in the most relevant way for your analysis.
📏 Adjustable Unit Display : Easily manage the magnitude of the values displayed with options like "1 Billion", "1 Million", "1 Thousand", or "None".
🔧 Lookback Period Customization : Tailor the sum calculation window with a configurable lookback period, applicable in "Sum of Flows" mode.
📊 Deviation Thresholds : Set up lower and upper deviation thresholds to identify significant changes in flow data.
🔄 Reversal Signals and Deviation Bands : Enable signals for potential reversals and visualize deviation bands for comparative analysis.
🎨 Color-coded Visualization : Distinct colors for upward and downward movements make it easy to distinguish between buying and selling pressures.
🚀 Quick Guide to Using the Net Buying/Selling Flows Toolkit :
🔍 Add the Indicator : Add the indicator to you favorites. Customize the settings to fit your trading requirements.
👁️🗨️ Data Analysis : Compare the trend of Buying and Selling to help indicate whether bulls or bears are in control of the market. Utilize the different display modes to present the data in different form to suite your analysis style.
🔔 Set Alerts : Activate alerts for reversal conditions to keep abreast of significant market movements without having to monitor the charts constantly.
🌐 How It Works :
The toolkit processes volume data on a lower timeframe to distinguish between buying and selling pressures based on intra-bar price closing higher or lower than it opened. It aggregates these transactions and finds the net selling and buying that took place during that bar, offering a clearer view of market fundamentals. The indicator then plots this data visually with multiple modes including comparisons between buying/selling and the net flow of the asset. Deviation thresholds help in identifying significant changes, allowing traders to spot potential buying or selling opportunities based on the money flow dynamics. The "Sum of Flows" mode is unique from other trend following indicators as it does not determine trend based on price action, but rather based on the net buying/selling. Therefore in some cases the "Sum of Flows" mode can be a leading indicator showing bullish/bearish net flows even before the prices move significantly.
Embark on a more informed trading journey with this dynamic and insightful tool, tailor-made for those who demand precision and clarity in their trading strategies. 🌟📉📈
RSI w/Hann WindowingThis RSI by John Ehlers of "Yet Another" Improved RSI. Taking advantage of the Hann windowing. As seen on PRC and published by John Ehlers, it has a zero mean and appears smoother than the classic RSI. In his own words " I prefer oscillator-type indicators to have a zero mean. We can achieve this simply by multiplying the classic RSI by 2 so it swings from 0 to 2, and then subtract 1 from the product so the indicator swings from -1 to +1." Ehlers goes on to say " Bear in mind 14 may not be the best length to analysis. So, the best length to use for the RSIH indicator is on the order of the dominant cycle period of the data."
This indicator works well with both bullish and bearish divergences. It also works well with oversold and overbought indications. Shown by the Red zone on top (Overbought) and the green zone on the bottom(oversold). Each which have an adjustable buffer zone. You may need to adjust the length of the RSIH to suit your asset. There are also multiply signal line's to choose from. Also take note of when the RSIH crosses up or down on the signal line.
None of this is financial advice.
Dynamic Cycle Oscillator [Quantigenics]This script is designed to navigate through the ebbs and flows of financial markets. At its core, this script is a sophisticated yet user-friendly tool that helps you identify potential market turning points and trend continuations.
How It Works:
The script operates by plotting two distinct lines and a central histogram that collectively form a band structure: a center line and two outer boundaries, indicating overbought and oversold conditions. The lines are calculated based on a blend of exponential moving averages, which are then refined by a root mean square (RMS) over a specified number of bars to establish the cyclic envelope.
The input parameters:
Fast and Slow Periods:
These determine the sensitivity of the script. Shorter periods react quicker to price changes, while longer periods offer a smoother view.
RMS Length:
This parameter controls the range of the cyclic envelope, influencing the trigger levels for trading signals.
Using the Script:
On your chart, you’ll notice how the Dynamic Cycle Oscillator’s lines and histogram weave through the price action. Here’s how to interpret the movements.
Breakouts and Continuations:
Buy Signal: Consider a long position when the histogram crosses above the upper boundary. This suggests a possible strong bullish run.
Sell Signal: Consider a short position when the histogram crosses below the lower boundary. This suggests a possible strong bearish run.
Reversals:
Buy Signal: Consider a long position when the histogram crosses above the lower boundary. This suggests an oversold market turning bullish.
Sell Signal: Consider a short position when the histogram crosses below the upper boundary. This implies an overbought market turning bearish.
The script’s real-time analysis can serve as a robust addition to your trading strategy, offering clarity in choppy markets and an edge in trend-following systems.
Thanks! Hope you enjoy!
CandleInsightsLibrary "CandleInsights"
CandleInsights provides a set of utility functions to facilitate identifying certain types of individual candles and candle patterns.
isBullish()
Returns true if candle is bullish.
Returns: bool
isBearish()
Returns true if candle is bearish.
Returns: bool
isHammer()
Returns true if candle is a hammer. TODO: Allow params
Returns: bool
isShootingStar()
Returns true if candle is a shooting star. TODO: Allow params
Returns: bool
isBearishToppingTail()
Returns true if candle is bearish with a top wick over half the range of the candle. TODO: Allow params
Returns: bool
isHanging()
Returns true if candle is considering a hanging candle (aka hanging man). TODO: Allow params
Returns: bool
isLongBullish(pctChg)
Parameters:
pctChg (float)
isBullishEngulfing()