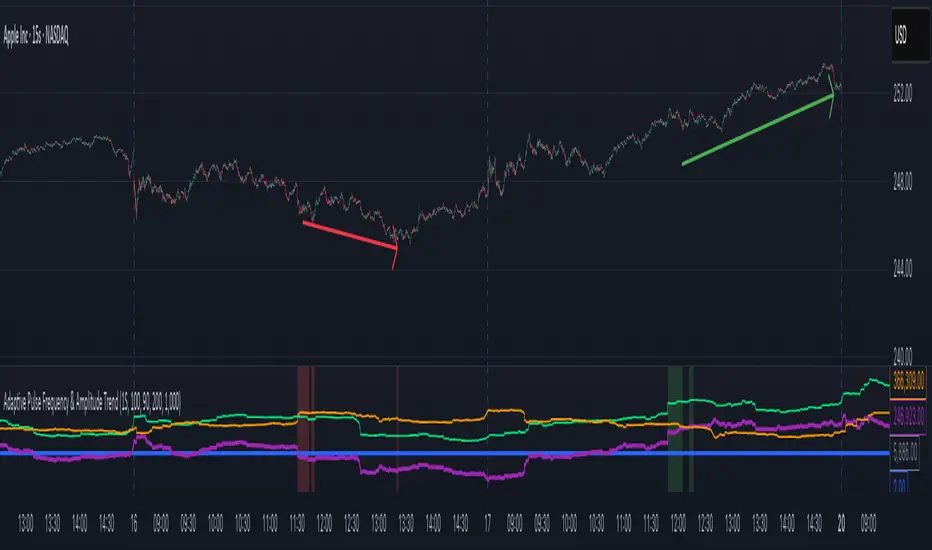
Adaptive Pulse Frequency & Amplitude TrendAdaptive Pulse Frequency & Amplitude Trend Indicator
This Pine Script indicator is designed to identify strong bullish or bearish trends by analyzing volume dynamics on a lower timeframe than the one currently displayed on the chart. It operates on the principle of detecting significant spikes in buying or selling pressure, referred to as "pulses," and then evaluating their frequency, strength, and dominance over the opposing market forces.
Core Concepts
Lower Timeframe Volume Analysis: The script requests up-volume and down-volume data from a more granular, lower timeframe (e.g., 1-minute data when on a 15-minute chart). This provides a higher-resolution view of the flow of buy and sell orders.
Adaptive Pulse Detection: A "pulse" is defined as a bar with an unusually high net volume (up volume minus down volume). Instead of using a fixed value, the indicator calculates an adaptive threshold based on the 90th percentile of net volume over a 100-bar lookback period. Any bar with a net volume exceeding this dynamic threshold is flagged as a pulse, categorized as either bullish (positive net volume) or bearish (negative net volume).
Frequency and Amplitude: The indicator measures two key aspects of these pulses over user-defined lookback periods:
Net Frequency: The number of bullish pulses minus the number of bearish pulses. A positive value indicates more buying pulses, while a negative value indicates more selling pulses.
Net Amplitude : The cumulative volume of bullish pulses minus the cumulative volume of bearish pulses. This measures the overall strength and conviction behind the pulses.
Primary Trend Signal
The indicator's primary signal comes from a strict dominance condition. It doesn't just look for more buying or selling pulses; it checks if these pulses are powerful enough to overwhelm the total opposite pressure in the market.
Bullish Dominance (Green Background): A strong bullish signal is generated when the total volume of all bullish pulses within a lookback period is greater than the total down-volume from all bars (not just pulses) in that same period.
Bearish Dominance (Red Background): A strong bearish signal is generated when the total volume of all bearish pulses is greater than the total up-volume from all bars in that period.
The chart background is colored green for bullish dominance and red for bearish dominance, providing a clear visual cue for when one side has taken decisive control.
Plotted Data
In addition to the background coloring, the indicator plots several lines in its own pane for more detailed analysis:
Net Frequency: Shows the trend in the number of bull vs. bear pulses.
Net Amplitude: Shows the trend in the strength of bull vs. bear pulses.
Bullish/Bearish Amplitude: The individual cumulative volumes for bull and bear pulses.
Dynamic Threshold: The adaptive value used to identify pulses.
By combining an adaptive detection method with a strict dominance condition, this tool aims to filter out market noise and highlight periods of genuinely strong, volume-backed trends.
在腳本中搜尋"bear"
Dammu AI ADVANCED PRO1. Indicator Overview
Name: Dammu
Type: Overlay indicator (draws on price chart)
Purpose: Combines SuperTrend, SMA/EMA trends, Swing/Structure analysis, Order Blocks, Fair Value Gaps, High/Low levels, TP/SL labels, and alerts.
Pine Script Version: v5
2. SuperTrend Module
Computes SuperTrend line using ATR and sensitivity.
Signals:
Bullish: Price crosses above SuperTrend.
Bearish: Price crosses below SuperTrend.
Plots buy/sell labels 🚀🐻 based on SMA comparison and SuperTrend cross.
3. SMA/EMA Trend Components
SMA8 & SMA9: Used for additional trend confirmation.
EMA lines: Multiple EMAs with different multipliers for trend detection.
Trend Cloud: Uses Hull MA for trend smoothing.
4. Risk Management
TP/SL Levels: Automatic calculation of stop-loss and take-profit (TP1, TP2, TP3).
Configurable ATR-based risk percentage.
Lines and labels drawn for visual TP/SL.
5. Chart Features
Smooth Range Filter: Filters noise for trend detection.
Colored Trend Cloud: Upward trend = cyan, downward = red.
Sideways Market: ADX filter to color bars purple if trend is weak/sideways.
Bar Colors: Green/red based on SuperTrend signals.
6. Swing & Structure Analysis
Detects Swing Highs/Lows, labels as HH, LH, LL, HL.
Detects CHoCH (Change of Character) or BOS (Break of Structure).
Can show internal or swing structures with configurable label size and color.
7. Order Blocks (Smart Money Concepts)
Detects Internal Order Blocks (iOB) and Swing Order Blocks (OB).
Stores top/bottom/left/time/type in arrays.
Colors and shows boxes based on bullish/bearish type.
Automatically deletes OB if price breaks the block.
8. Fair Value Gaps (FVG)
Identifies gaps between candles as potential trading zones.
Configurable bullish/bearish colors and extension bars.
9. EQH/EQL (Equal Highs/Lows)
Detects equal highs/lows using a threshold.
Plots dotted lines and labels EQH/EQL.
10. High/Low Levels MTF
Optional plotting of previous daily, weekly, monthly highs/lows.
11. Premium/Discount Zones
Plots Premium, Discount, and Equilibrium Zones.
Colors: Premium = red, Discount = green, Equilibrium = gray.
12. Alerts
Buy/Sell alerts for:
SuperTrend crossover
BOS/CHoCH (swing/internal)
EQH/EQL triggers
13. Miscellaneous
Configurable visuals: line style, label size, transparency.
Adjustable volatility filters, ATR lengths, smoothing constants.
Integrated risk & reward visualization.
✅ In short:
This is an all-in-one Smart Money + Trend indicator with SuperTrend signals, swing/structure detection, order blocks, FVGs, EQH/EQL, TP/SL visualization, and optional alerts. It’s designed for both trend-following and order-block-based trading.
If you want, I can make a super-short 1-paragraph version that summarizes it even faster for quick reference.

MTF Advanced DMI [NexusSignals]The MTF Advanced DMI is a multi-timeframe (MTF) enhancement of the classic Directional Movement Index (DMI) and Average Directional Index (ADX) indicator. It provides traders with insights into trend strength, direction, and momentum across multiple timeframes simultaneously. This version of DMI extends the single-timeframe analysis by incorporating two higher timeframes, allowing for better alignment of trends (e.g., confirming a short-term signal with longer-term context). It includes visual plots, a customizable data table showing MTF data, and expanded alert conditions for trend changes, consolidations, and reversals. Ideal for multi-timeframe strategies, trend confirmation, or avoiding false signals in volatile markets.
Key features include:
Multi-Timeframe Analysis: Displays DMI/ADX data for the current chart timeframe, plus two user-defined higher timeframes (e.g., 4H and 1D).
A trend strength metric that quantifies bullish/bearish dominance on each timeframe.
A dynamic table summarizing real-time MTF values, with color-coded signals, arrows, and buy/sell pressure percentages.
Visual fills and arrows for intuitive trend reading.
Built-in alerts for key events, including MTF-specific conditions (note: higher TF alerts may repaint due to live candle calculations via request.security).
How It Works
The indicator calculates DMI/ADX on three timeframes: the current chart TF, a mid-higher TF (default: 4H), and a highest TF (default: 1D).
For each:
+DI (Plus Directional Indicator): Upward movement strength.
-DI (Minus Directional Indicator): Downward movement strength.
ADX: Overall trend strength.
Trend Strength: ((+DI - -DI) / (+DI + -DI)) * ADX – positive for bullish, negative for bearish.
Buy/Sell %: Percentage of buyer/seller control in the candle based on HLC.
Plots focus on the current TF:
Strength Histogram: Color-coded (green bullish, red bearish).
ADX Line: White, with direction arrows.
+DI/-DI Lines: Green/red, with fills above 15 for strong trends.
Horizontal lines at 15 (consolidation) and 25 (strong trend).
The table (optional) shows data for the current timeframe candle, previous current timeframe candle, and the two higher TFs (if different from current), enabling quick cross-TF comparisons.
Inputs
General Settings:
DMI Length (default: 14): Period for +DI/-DI.
ADX Smoothing (default: 14): ADX period.
ADX Consolidation Threshold (default: 15): Low ADX suggests sideways.
ADX Stronger Trend Threshold (default: 25): High ADX indicates strong trends.
Higher Timeframe (default: 240/4H): Mid-level TF for MTF analysis.
Highest Timeframe (default: 1D): Top-level TF for broader context.
Threshold for Strong Bullish/Bearish DMI Strength (defaults: 10 / -10): For strength alerts.
Table Settings:
Show Table? (default: true): Toggle table visibility
Table Text Color, Header Color, Text Size (default: small)
Position (default: middle_right): Customize for your chart
Interpretation
Bullish Alignment: +DI > -DI across TFs, rising +DI (↑), Strength > 0 (green), Buy% > Sell%. Stronger if ADX > 25 on higher TFs.
Bearish Alignment: -DI > +DI, rising -DI (↑), Strength < 0 (red), Sell% > Buy%. Confirm with rising ADX on MTF.
Consolidation: +DI/-DI < 20 and ADX ≤ 15 (blue fill). Check if higher TFs show the same for range-bound confirmation.
Crossovers: +DI above -DI for bullish; reverse for bearish. MTF agreement reduces false signals.
Fills: Highlight dominant trends above 15 (green bullish, maroon bearish).
MTF Insight: Use the table to spot divergences (e.g., bullish current TF but bearish on daily) for potential reversals.
Combine with support/resistance or other momentum oscillators like macd, rsi, stochastic for robust strategies. Test on various assets and TFs to find the best settings that suit your trading style.
Alerts
Includes 20 alert conditions, with MTF extensions (higher TF alerts may repaint – use with caution for live trading):
Strength crossing 0 or bullish/bearish thresholds (on current and higher TFs).
+DI/-DI crossovers (bullish/bearish) on current TF.
ADX above strong threshold.
+DI/-DI above 25 or below 15.
Consolidation detection.
MTF-specific: Strength changes on higher TFs (e.g., "Strength Above Bullish Threshold on TF1").
Configure in TradingView by selecting from the alert dropdown.
Usage Tips
Select higher TFs that suit your strategy (e.g., 1H chart with 4H and Daily for day trading).
Use the table for at-a-glance MTF alignment without switching charts.
Customize appearance to avoid clutter on busy setups.
Backtest thoroughly, especially noting potential repainting on higher TFs.

Z-Score Momentum | MisinkoMasterThe Z-Score Momentum is a new trend analysis indicator designed to catch reversals, and shifts in trends by comparing the "positive" and "negative" momentum by using the Z-Score.
This approach helps traders and investors get unique insight into the market of not just Crypto, but any market.
A deeper dive into the indicator
First, I want to cover the "Why?", as I believe it will ease of the part of the calculation to make it easier to understand, as by then you will understand how it fits the puzzle.
I had an attempt to create a momentum oscillator that would catch reversals and provide high tier accuracy while maintaining the main part => the speed.
I thought back to many concepts, divergences between averages?
- Did not work
Maybe a MACD rework?
- Did not work with what I tried :(
So I thought about statistics, Standard Deviation, Z-Score, Sharpe/Sortino/Omega ratio...
Wait, was that the Z-Score? I only tried the For Loop version of it :O
So on my way back from school I formulated a concept (originaly not like this but to that later) that would attempt to use the Z-Score as an accurate momentum oscillator.
Many ideas were falling out of the blue, but not many worked.
After almost giving up on this, and going to go back to developing my strategies, I tried one last thing:
What if we use divergences in the average, formulated like a Z-score?
Surprise-surprise, it worked!
Now to explain what I have been so passionately yapping about, and to connect the pieces of the puzzle once and for all:
The indicator compares the "strength" of the bullish/bearish factors (could be said differently, but this is my "speach bubble", and I think this describes it the best)
What could we use for the "bullish/bearish" factors?
How about high & low?
I mean, these are by definitions the highest and lowest points in price, which I decided to interpret as: The highest the bull & bear "factors" achieved that bar.
The problem here is comparison, I mean high will ALWAYS > low, unless the asset decided to unplug itself and stop moving, but otherwise that would be unfair.
Now if I use my Z-score, it will get higher while low is going up, which is the opposite of what I want, the bearish "factor" is weaker while we go up!
So I sat on my ret*rded a*s for 25 minutes, completly ignoring the fact the number "-1" exists.
Surprise surprise, multiplying the Z-Score of the low by -1 did what I wanted!
Now it reversed itself (magically). Now while the low keeps going down, the bear factor increases, and while it goes up the bear factor lowers.
This was btw still too noisy, so instead of the classic formula:
a = current value
b = average value
c = standard deviation of a
Z = (a-b)/c
I used:
a = average value over n/2 period
b = average value over n period
c = standard deviation of a
Z = (a-b)/c
And then compared the Z-Score of High to the Z-Score of Low by basic subtraction, which gives us final result and shows us the strength of trend, the direction of the trend, and possibly more, which I may have not found.
As always, this script is open source, so make sure to play around with it, you may uncover the treasure that I did not :)
Enjoy Gs!

Tweezer & Kangaroo Zones [WavesUnchained]Tweezer & Kangaroo Zones
Pattern Recognition with Supply/Demand Zones
Indicator that detects tweezer and kangaroo tail (pin bar) reversal patterns and creates supply and demand zones. Includes volume validation, trend context, and confluence scoring.
What You See on Your Chart
Pattern Labels:
"T" (Red) - Tweezer Top detected above price → Bearish reversal signal
"T" (Green) - Tweezer Bottom detected below price → Bullish reversal signal
"K" (Red) - Kangaroo Bear (Pin Bar rejection from top) → Bearish signal
"K" (Green) - Kangaroo Bull (Pin Bar rejection from bottom) → Bullish signal
Label Colors Indicate Pattern Strength:
Dark Green/Red - Strong pattern (score ≥8.0)
Medium Green/Red - Good pattern (score ≥6.0)
Light Green/Red - Valid pattern (score <6.0)
Zone Boxes:
Red Boxes - Supply Zones (resistance, potential short areas)
Green Boxes - Demand Zones (support, potential long areas)
White Border - Active zone (fresh, not tested yet)
Gray Border - Inactive zone (expired or invalidated)
Pattern Detection
Tweezer Patterns (Classic Double-Top/Bottom):
Flexible Lookback - Detects patterns up to 3 bars apart (not just consecutive)
Precision Matching - 0.2% level tolerance for high-quality signals
Wick Similarity Check - Both candles must show similar rejection wicks
Volume Validation - Second candle requires elevated volume (0.8x average)
Pattern Strength Score - 0-1 quality rating based on level match + wick similarity
Optional Trend Context - Can require trend alignment (default: OFF for more signals)
Kangaroo Tail / Pin Bar Patterns:
No Pivot Delay - Instant detection without waiting for pivot confirmation
Body Position Check - Body must be at candle extremes (30% tolerance)
Volume Spike - Rejection must occur with volume (0.9x average)
Rejection Strength - Scores based on wick length (0.5-0.9 of range)
Optional Trend Context - Bearish in uptrends, Bullish in downtrends (default: OFF)
Zone Management
Auto-Created Zones - Every valid pattern creates a supply/demand zone
Overlap Prevention - Zones too close together (50% overlap) are not duplicated
Lifetime Control - Zones expire after 400 bars (configurable)
Smart Invalidation - Zones invalidate when price closes through them
Styling Options - Choose between Solid, Dashed, or Dotted borders
Border Width - 2px width for better visibility
Confluence Scoring System
Multi-factor confluence scoring (0-10 scale) with configurable weights:
Regime (EMA+HTF) - Trend alignment across timeframes (Weight: 2.0)
HTF Stack - Multi-timeframe trend confluence (Weight: 3.0)
Structure - Higher lows / Lower highs confirmation (Weight: 1.0)
Relative Volume - Volume surge validation (Weight: 1.0)
Chop Advantage - Favorable market conditions (Weight: 1.0)
Zone Thinness - Tight zones = better R/R (Weight: 1.0)
Supertrend - Trend indicator alignment (Weight: 1.0)
MOST - Moving Stop alignment (Weight: 1.0)
Pattern Strength - Quality of detected pattern (Weight: 1.5)
Zone Retest Signals
Signals generated when zones are retested:
BUY Signal - Price retests demand zone from above (score ≥4.5)
SELL Signal - Price retests supply zone from below (score ≥5.5)
Normalized Score - Displayed as 0-10 for easy interpretation
Optional Trend Gate - Require trend alignment for signals (default: OFF)
Alert Ready - Built-in alertconditions for automation
Additional Features
Auto-Threshold Tuning - Adapts to ATR and Choppiness automatically
Session Profiles - Different settings for RTH vs ETH sessions
Organized Settings - 15+ input groups for easy configuration
Optional Panels - HTF Stack overview and performance metrics (default: OFF)
Data Exports - Hidden plots for strategy/library integration
RTA Health Monitoring - Built-in performance tracking
Setup & Configuration
Quick Start:
1. Apply indicator to any timeframe
2. Patterns and zones appear automatically
3. Adjust pattern detection sensitivity if needed
4. Configure zone styling (Solid/Dashed/Dotted)
5. Set up alerts for zone retests
Key Settings to Adjust:
Pattern Detection:
• Min RelVolume: Lower = more signals (0.8 Tweezer, 0.9 Kangaroo)
• Require trend context: Enable for stricter, higher-quality patterns
• Check wick similarity: Ensures proper rejection structure
Zone Management:
• Zone lifetime: How long zones remain active (default: 400 bars)
• Invalidate on close-through: Remove zones when price breaks through
• Max overlap: Prevent duplicate zones (default: 50%)
Scoring:
• Min Score BUY/SELL: Higher = fewer but better signals (default: 4.5/5.5)
• Component weights: Customize what factors matter most
• Signals require trend gate: OFF = more signals, ON = higher quality
Visual Customization
Zone Colors - Light red/green with 85% transparency (non-intrusive)
Border Styles - Solid, Dashed, or Dotted
Label Intensity - Darker greens for better readability
Clean Charts - All panels OFF by default
Understanding the Zones
Supply Zones (Red):
Created from bearish patterns (Tweezer Tops, Kangaroo Bears). Price made a high attempt to push higher, but was rejected. These become resistance areas where sellers may step in again.
Demand Zones (Green):
Created from bullish patterns (Tweezer Bottoms, Kangaroo Bulls). Price made a low with strong rejection. These become support areas where buyers may step in again.
Zone Quality Indicators:
• White border = Fresh zone, not tested yet
• Gray border = Zone expired or invalidated
• Thin zones (tight range) = Better risk/reward ratio
• Thick zones = Less precise, wider stop required
Trading Applications
Reversal Trading - Enter at pattern detection with tight stops
Zone Retest Trading - Wait for retests of established zones
Trend Confluence - Trade only when patterns align with trend
Risk Management - Use zone boundaries for stop placement
Target Setting - Opposite zones become profit targets
Pro Tips
Best signals occur when pattern + zone retest + trend all align
Lower timeframes = more signals but more noise
Higher timeframes = fewer but more reliable signals
Start with default settings, adjust based on your market
Combine with other analysis (structure, key levels, etc.)
Use alerts to avoid staring at charts all day
Important Notes
Not all patterns will lead to successful trades
Use proper risk management and position sizing
Patterns work best in trending or range-bound markets
Very choppy conditions may produce lower-quality signals
Always confirm with your own analysis before trading
Technical Specifications
• Pine Script v6
• RTA-Core integration
• RTA Core Library integration
• Maximum 200 boxes, 500 labels
• Auto-tuning based on ATR and Choppiness
• Session-aware threshold adjustments
• Memory-optimized zone management
What's Included
Tweezer Top/Bottom detection
Kangaroo Tail / Pin Bar detection
Automatic supply/demand zone creation
Volume validation system
Pattern strength scoring
Zone retest signals
Multi-factor confluence scoring
Optional HTF Stack panel
Optional performance metrics
Session profile support
Auto-threshold tuning
Alert conditions
Data exports for strategies
Author Waves Unchained
Version 1.0
Status Public Indicator
Summary
Reversal pattern detection with zone management, volume validation, and confluence scoring for tweezer and kangaroo tail patterns.
---
Disclaimer: This indicator is for educational and informational purposes only. Trading involves risk. Past performance does not guarantee future results. Always practice proper risk management.

Livermore's Pyramiding Trading - 3Commas [SwissAlgo]
📊 J. LIVERMORE'S PYRAMIDING TRADING - 3Commas Integrated
A Trading Approach Inspired by Jesse Livermore's Position Building Principles
━━━━━━━━━━━━━━━━━━━━━━━━━━━━━━━━━━━━━━━━━━━
DISCLAIMER
This indicator is an educational tool based on historical trading principles. Past performance is not indicative of future results. Trading involves substantial risk of loss. Only trade with capital you can afford to lose. You are responsible for all trading decisions.
━━━━━━━━━━━━━━━━━━━━━━━━━━━━━━━━━━━━━━━━━━━
📚 WHO WAS JESSE LIVERMORE?
Jesse Livermore (1877-1940) was one of the greatest traders in history.
His core insight: "Most traders do everything backward."
♦ "They deploy all capital at once" → Livermore entered with a small fraction of his capital (he started with a 'test position' to validate his trade idea and waited for market confirmation to deploy more, building positions in steps = "pyramiding")
♦ "They average down" (DCA) → Livermore added to trades showing good results only, and never to losing trades, as the trend kept aligning with his trade idea
♦ "They use arbitrary % stops" → Livermore exited when structure appeared broken (he trailed his stop loss to try to protect unrealized profit - if any)
♦ "They take profits too early or set arbitrary TP%" → Livermore let trades showing positive results run until proven wrong (trial take profit)
💬 "I always made money when I was sure I was right before I began. What beat me was not having enough brains to stick to my own game."
— Jesse Livermore
This indicator tries to translate his principles into a SYSTEMATIC FRAMEWORK :
BO = Base Order (first order, base of the pyramid)
PO = Pyramid Orders (additional layers of capital deployed as long as the 'tape' does not invalidate the trade idea)
♦ Test First (BO - 20%) - Small entry to test your idea. If wrong, lose small. If right, can consider pyramiding into strength.
♦ Build Position Size (PO1-3 - 80%) - Add only as trend unfolds favorably (the indicator uses specific Fibonacci levels to track milestones - 0.618, 1.0, 1.272 - and looks for strong confluence among price, volume, trend, momentum, break of resistance/support levels to suggest and trigger actions: entries, exit)
♦ Attempt to Protect Capital - Dynamic stops: the indicator trails the stop loss, to try to protect potential gains from previous steps (if any)
♦ Discipline - Trades fire only when ALL conditions align
━━━━━━━━━━━━━━━━━━━━━━━━━━━━━━━━━━━━━━━━━━━
🎯 INDICATOR FEATURES
You map 3 points on the chart → The indicator generates a systematic trading plan structure based on your wave analysis.
✓ Auto-detects trade direction: Uptrend wave (A➚B➘C) = Long signals | Downtrend wave (A➘B➚C) = Short signals
✓ Entry/exit prices: BO, PO1, PO2, PO3, and dynamic EXIT (trailing stop)
✓ Real-time condition monitoring: Live ✓/✗ checks for each order (price closes + volume + trend + pivot breaks + candle quality + sequence)
✓ Visual trade execution: Green labels mark entries (BO/PO1/PO2/PO3), red labels mark EXIT
✓ Optional 3Commas automation: JSON webhooks for hands-free execution via Signal Bots
⏰ Recommended Timeframes: 1H, 4H, Daily
(Lower timeframes like 15m/5m produce excessive noise and false signals)
💬 "Watch the market leaders, the stocks that have led the charge. That is where the action is and where the money is made."
— Jesse Livermore
━━━━━━━━━━━━━━━━━━━━━━━━━━━━━━━━━━━━━━━━━━━
⚙️ SETUP IN 3 STEPS
🟡 STEP 1: Map Your Wave (Points A → B → C)
Identify a completed wave pattern:
For LONGS:
♦ Point A = Swing low (wave start)
♦ Point B = Swing high (impulse end)
♦ Point C = Pullback low (retrace end - where next wave may begin)
For SHORTS:
♦ Point A = Swing high (wave start)
♦ Point B = Swing low (impulse end)
♦ Point C = Pullback high (retrace end - where next wave may begin)
How to set points:
Settings → Enter dates manually OR drag the vertical lines directly on the chart (easier - just click and drag the pre-mapped A/B/C lines)
Requirements (auto-validated by code):
✓ All dates must be in the past (Point C = completed retrace, not forming)
✓ Clear impulse A→B (minimum 5% move)
✓ Clear retrace B→C (minimum 3% pullback)
───────────────────────────────────────────
🟡 STEP 2: Set Budget & Allocation
Settings → "TRADE PARAMETERS"
♦ Total Budget: $10,000 (example - capital for THIS trade only, not your entire account)
♦ Allocation (must total 100%):
BO = 20% ($2,000) - test position
PO1 = 25% ($2,500) @ Fib 0.618
PO2 = 30% ($3,000) @ Fib 1.0
PO3 = 25% ($2,500) @ Fib 1.272
💬 "It was never my thinking that made big money for me. It was always my sitting. Men who can both be right and sit tight are uncommon."
— Jesse Livermore
───────────────────────────────────────────
🟡 STEP 3: Monitor Your Trade Plan Table
The table (top-right corner) has 4 sections that guide your execution:
BUDGET DEPLOYMENT
♦ Trigger prices for each order (BO auto-calculated at 0.5 Fib between B-C)
♦ Dollar amount per entry
♦ Fibonacci level assigned to each PO
ENTRY/EXIT CONDITIONS
Each column (BO, PO1, PO2, PO3) shows live status (✓ or ✗) for:
♦ Price: 2 consecutive closes (BO) | 3 consecutive closes (POs)
♦ Volume: OBV directional alignment OR volume spike above average
♦ Trend: Normal or Strong Bull/Bear (no entries in Uncertain trend)
♦ Pivot: Nearest resistance (longs) or support (shorts) broken
♦ Clean Candle: Momentum without reversal wicks <30% (POs only)
♦ Sequence: Prior order must have fired first (POs only - no skipping levels)
TRIGGERED?
Shows execution status for each order (✓ = fired, ✗ = waiting)
If using 3Commas: ✓ confirms JSON alert was sent to your bot for real execution
VALIDATIONS
✓ Green = All checks passed, setup is valid
⚠️ Yellow = Warning (e.g., budget doesn't equal 100%, deep retrace)
✗ Red = Error (e.g., dates in wrong order, invalid wave structure)
⚠️ Wait for ALL ✓✓✓✓✓ (or ✓✓✓✓✓✓) to align in a column before that order fires at bar close
💬 "The game of speculation is the most uniformly fascinating game in the world. But it is not a game for the stupid, the mentally lazy, the person of inferior emotional balance, or the get-rich-quick adventurer."
— Jesse Livermore
━━━━━━━━━━━━━━━━━━━━━━━━━━━━━━━━━━━━━━━━━━━
📊 CHART VISUALS - READING THE INDICATOR
Fibonacci Extension Lines
After mapping A-B-C, horizontal lines extend to the right:
♦ Solid green/red lines = Active PO entry levels (0.618, 1.0, 1.272)
♦ Dotted gray lines = Reference Fib levels used for exit tracking (2.0, 2.618, 3.0, etc.)
♦ Labels on right = Show level and price: "Fib 0.618 / $67,324 "
Entry/Exit Price Lines
♦ Thick green line (longs) / red line (shorts) = BO entry price with direction label
♦ Dashed red line = Current EXIT price (your trailing stop loss - appears after BO fires and moves as price extends)
Trade Execution Labels
Visual confirmation when orders fire on the chart:
♦ Green labels (below/above candles) = BO, PO1, PO2, PO3 entries executed
♦ Red label = EXIT triggered (position closed)
Trend Strength Indicator (EMA Line)
The thick colored line shows real-time trend status:
♦ Bright lime = Strong bullish trend
♦ Light green = Normal bullish trend
♦ Bright red = Strong bearish trend
♦ Light red = Normal bearish trend
♦ Gray = Uncertain/weak trend (no entries fire in this state)
Entries require at least Normal trend strength aligned with your trade direction.
💬 "I never argue with the tape. Getting sore at the market doesn't get you anywhere."
— Jesse Livermore
━━━━━━━━━━━━━━━━━━━━━━━━━━━━━━━━━━━━━━━━━━━
🔧 ENTRY LOGIC - TECHNICAL DETAILS
💬 "The big money was never made in the buying or the selling. The big money was made in the waiting."
— Jesse Livermore
───────────────────────────────────────────
🟢 BASE ORDER (BO) - TEST POSITION
BO Price Calculation
Auto-calculated at the 0.5 Fibonacci retracement between Point B and Point C
Formula: (Price B + Price C) / 2
Why this level?
♦ Midpoint between impulse end (B) and retrace end (C)
♦ Breakout above/below suggests retrace may be complete
♦ Designed to help position BO below all Fib extensions (to control sequence issues)
───────────────────────────────────────────
BO Entry Conditions - ALL 5 Must Align:
1️⃣ PRICE: 2 Consecutive Closes Beyond BO
♦ Longs: close > BO AND close > BO
♦ Shorts: close < BO AND close < BO
♦ Why: Designed to confirm breakout commitment and filter fakeouts
2️⃣ TREND: Normal OR Strong Trend Aligned
♦ Detection: 18-period EMA + ADX/DMI + higher timeframe slope
♦ States: Strong Bull/Bear (ADX>30), Normal Bull/Bear (price vs EMA), Uncertain
♦ Confirmation: Requires 3 consecutive bars in the same state (to reduce flip-flop)
♦ BO accepts: Normal OR Strong (you're testing early, basic alignment sufficient)
3️⃣ PIVOT: Nearest Resistance/Support Broken
♦ Storage: 60 most recent pivot highs/lows (dynamic lookback per timeframe)
♦ Longs: Nearest pivot HIGH above BO → must break with 2 closes
♦ Shorts: Nearest pivot LOW below BO → must break with 2 closes
♦ Price Discovery: If no pivot exists beyond BO = auto-pass
♦ Why: Aims to confirm momentum has overcome previous rejection zones
4️⃣ VOLUME: OBV Aligned OR Spike
♦ Directional OBV: OBV > 20-EMA (longs) OR OBV < 20-EMA (shorts)
♦ OR Volume Spike: Current volume > 20-period SMA
♦ Why: Checks for institutional participation signals
5️⃣ VALIDATIONS: Setup Valid (✅)
♦ Dates valid (A < B < C, all in past)
♦ Wave structure valid (min 5% impulse, min 3% retrace)
♦ Budget allocation = 100%
♦ Prices detected at all points
⚠️ BO fires once per bar close. Flag set permanently until trade resets.
───────────────────────────────────────────
🔺 PYRAMID ORDERS (PO1-3) - PYRAMIDING INTO STRENGTH
💬 "Never buy a stock because it has had a big decline from its previous high. The big money was never made in the stock market by buying on declines."
— Jesse Livermore
PO Price Calculation
Fixed Fibonacci extensions from Point C:
Formula: Price C ± (Impulse Range × Fib Level)
Where: Impulse Range = |Price B - Price A|
Default Levels:
♦ PO1 @ Fib 0.618 (Golden Ratio)
♦ PO2 @ Fib 1.000 (Full impulse repeat)
♦ PO3 @ Fib 1.272 (Fibonacci sequence extension)
───────────────────────────────────────────
PO Entry Conditions - ALL 6 Must Align (STRICTER):
1️⃣ PRICE: 3 Consecutive Closes Beyond PO
♦ Longs: close > PO AND close > PO AND close > PO
♦ Shorts: close < PO AND close < PO AND close < PO
♦ Why: Higher conviction needed when adding capital (3 vs 2 closes for BO)
2️⃣ TREND: Same as BO
Normal OR Strong trend must remain aligned with trade direction
3️⃣ PIVOT: Per-Level Pivot Break
♦ Each PO checks its OWN nearest pivot (not shared with BO)
♦ Same 2-close break requirement
♦ PO3 Exception: Price discovery allowed (no pivot required if already profitable)
4️⃣ VOLUME: Same as BO
Sustained confirmation required (not weakening)
5️⃣ CLEAN CANDLE: <30% Reversal Wick (NEW)
♦ Filter: Uses ATR(14) - candles < ATR auto-pass (consolidation noise)
♦ Longs: Upper wick < 30% of candle range (no rejection at top)
♦ Shorts: Lower wick < 30% of candle range (no rejection at bottom)
♦ Why: Don't pyramid into weakness/rejection - only add on clean momentum
♦ Not checked for BO: Test position tolerates some wick risk
6️⃣ SEQUENCE: Prior Order Fired
♦ PO1 requires: BO fired
♦ PO2 requires: PO1 fired
♦ PO3 requires: PO2 fired
♦ Why: No skipping levels - disciplined building only
───────────────────────────────────────────
⚙️ KEY DIFFERENCE:
BO (20% capital) = Lighter requirements, testing your idea early
POs (80% capital) = Stricter requirements, adding only to confirmed winners
♦ BO: 2 closes | POs: 3 closes
♦ BO: No candle check | POs: Clean candle required
♦ BO: Independent | POs: Sequential (must follow order)
♦ BO: No price discovery | PO3: Allows price discovery when profitable
💬 "Profits always take care of themselves, but losses never do. The speculator has to ensure himself against considerable losses by taking the first small loss."
— Jesse Livermore
━━━━━━━━━━━━━━━━━━━━━━━━━━━━━━━━━━━━━━━━━━━
🚪 EXIT LOGIC - TECHNICAL DETAILS
🔴 EXIT PHILOSOPHY
The indicator uses TWO INDEPENDENT EXIT TRIGGERS (whichever fires first):
1) Structural Breakdown
Price breaks through the EXIT level with confirmation
2) Trend Reversal
Trend flips against your position AND price breaks EXIT level
Why two methods?
♦ Structure = price-based protection (hard stop)
♦ Trend = momentum-based exit (early warning when market character changes)
♦ Combined: Exit either when proven wrong (structure) or when conditions no longer favor your direction (trend)
───────────────────────────────────────────
🔴 EXIT PRICE CALCULATION
The EXIT price (your stop loss) adjusts dynamically based on position size:
BEFORE PO3 Fires (Fixed Stops):
♦ BO only = Stop at Point C (small position, tight stop near entry)
♦ PO1 fired = Stop at Fib 0.5 (moved to breakeven zone)
♦ PO2 fired = Stop at Fib 0.786 (protecting partial profits)
AFTER PO3 Fires (Trailing Stops):
♦ Tracking: Monitors the highest Fib reached (longs) or the lowest Fib reached (shorts)
♦ Placement: EXIT moves 1-2 Fib levels below the highest (longs) or above the lowest (shorts)
♦ Example: Price reaches Fib 2.618 → EXIT trails up to Fib 2.0
♦ Purpose: Designed to protect accumulated profits while allowing room for normal pullbacks
💬 "It never was my thinking that made the big money for me. It was always my sitting. Men who can both be right and sit tight are uncommon."
— Jesse Livermore
───────────────────────────────────────────
🔴 EXIT CONDITIONS
Exit Speed (Based on Risk Exposure):
♦ Full position (PO3 fired) = 1 close required (fast exit - more capital at risk)
♦ Partial position (BO/PO1/PO2 only) = 2 closes required (confirmation - less urgency)
METHOD 1: Structural Breakdown
Price violates the EXIT level with clean momentum:
For Longs:
♦ Price closes BELOW EXIT level (1 or 2 closes depending on position size)
♦ Clean candle required (lower wick < 50% of range - no false breakdown)
For Shorts:
♦ Price closes ABOVE EXIT level (1 or 2 closes depending on position size)
♦ Clean candle required (upper wick < 50% of range - no false breakout)
Why clean candle check?
Designed to reduce exits on wicks/fakeouts. If there's a large reversal wick (>50%), it suggests buyers/sellers are defending the level - not a true breakdown.
METHOD 2: Trend Reversal
Market character shifts against your position:
For Longs:
♦ Trend shifts from Bull → Normal Bear OR Strong Bear
♦ AND price breaks below EXIT level (same close requirements)
For Shorts:
♦ Trend shifts from Bear → Normal Bull OR Strong Bull
♦ AND price breaks above EXIT level (same close requirements)
Why this matters?
♦ Proactive exit before structural stop is hit
♦ If the trend that confirmed your entries reverses, the setup is invalidated
♦ Livermore principle: Exit when market proves you wrong, don't wait for max pain
───────────────────────────────────────────
⚠️ EXIT BEHAVIOR
♦ Fires once per bar close (same as entries)
♦ Resets all tracking after exit (ready for fresh trade setup)
♦ Clears flags: boSignalFired, po1/po2/po3SignalFired, highestFib/lowestFib tracking
♦ If using 3Commas: Sends exit_long or exit_short JSON (market order closes 100% position)
💬 "I never argue with the tape. Getting sore at the market doesn't get you anywhere."
— Jesse Livermore
━━━━━━━━━━━━━━━━━━━━━━━━━━━━━━━━━━━━━━━━━━━
🤖 3COMMAS AUTOMATION (OPTIONAL)
💬 "There is the plain fool, who does the wrong thing at all times everywhere, but there is also the Wall Street fool, who thinks he must trade all the time."
— Jesse Livermore
Automation designed to help remove emotion and support disciplined execution.
───────────────────────────────────────────
⚡ QUICK SETUP IN 5 STEPS
STEP 1: Create Your Signal Bots
You need 2 SEPARATE BOTS (one for Longs, one for Shorts):
Go to 3Commas → Bots → Create Bot → Select "Signal Bot"
Basic Settings:
♦ Bot Name: "Livermore Long - " (example: "Livermore Long - BTCUSDT")
♦ Exchange: Your connected exchange
♦ Trading Pair: Must match TradingView chart exactly
♦ Strategy: Custom Signal
♦ Direction: LONG (for first bot) or SHORT (for second bot)
♦ Max Active Deals: 1
⚠️ CRITICAL SETTINGS:
Entry Orders:
♦ Toggle ON: "Entry Orders"
♦ Volume per Order: "Send in webhook, quote"
♦ Why: This lets the indicator control exact $ amounts per order (BO=$2K, PO1=$2.5K, etc.)
♦ If you skip this: Orders will use wrong sizes and break your allocation plan
Exit Orders:
♦ Toggle ON: "Exit Orders"
♦ Volume per Order: "100 Position %"
♦ Why: Closes your entire position when EXIT signal fires
♦ Toggle OFF: "Take Profit" (managed by indicator)
♦ Toggle OFF: "Stop Loss" (managed by indicator)
Click "Start Bot" for both Long and Short bots.
───────────────────────────────────────────
STEP 2: Get Your Bot Credentials
For EACH BOT (Long and Short):
♦ Open the bot → Click "Orders" tab
♦ Scroll down to "Webhook Messages" section
♦ Copy these 3 values:
bot_uuid (long string like: a362cbcf-7e68-4379-a83d-ae6e47dba656)
secret (very long token starting with: eyJhbGciOiJ...)
webhook URL (refer to 3commas to get exact webhook - signal bots)
Note: The secret is usually the same for both bots, but the bot_uuid is different.
───────────────────────────────────────────
STEP 3: Enter Credentials in Indicator
Back in TradingView:
♦ Open indicator Settings
♦ Find section: "1️⃣ INTEGRATE 3COMMAS"
♦ Paste:
Long = Your Long bot UUID
Short = Your Short bot UUID
Secret = Your secret token (same for both)
♦ Click "OK"
The indicator now has everything needed to build JSON payloads.
───────────────────────────────────────────
STEP 4: Create TradingView Alert
This alert bridges TradingView → 3Commas. ONE ALERT HANDLES ALL SIGNALS (BO, PO1, PO2, PO3, EXIT).
How to create:
♦ Right-click chart → "Add Alert" (or click clock icon)
♦ Condition: Select this indicator from dropdown
♦ Trigger: "Any alert() function call"
♦ Alert Name: "Livermore Pyramiding - "
♦ Message: Leave default (indicator sends its own JSON)
♦ Webhook URL: Paste your 3Commas webhook URL from Step 2
♦ ⚠️ Alert Frequency: "Once Per Bar Close" (CRITICAL - controls duplicate orders)
♦ Expiration: Open-ended (or set specific date)
♦ Click "Create"
───────────────────────────────────────────
STEP 5: Test Before Going Live
🧪 NEVER TEST WITH REAL CAPITAL FIRST. Use one of these methods:
Test 1: Check Bot Status
♦ 3Commas → Bots → Both bots show "Active" (green)
♦ Click into each bot → Orders tab → Should say "Waiting for signal"
Test 2: Verify Alert Active
♦ TradingView → Alerts panel (bell icon)
♦ Your alert should show "Active" status
Test 3: Paper Trade / Tiny Position
♦ Use 3Commas paper mode if available, OR
♦ Set Total Budget to $10-50 for first real test
♦ Map a wave that's about to trigger
♦ Watch if orders actually appear on 3Commas
Test 4: Check JSON Format
♦ When alert fires → TradingView Alerts → Click your alert
♦ Look at "History" or "Log"
♦ Verify JSON has: bot_uuid, secret, action, price, amount
───────────────────────────────────────────
🛠️ COMMON ISSUES & SOLUTIONS
✗ Problem: Orders not appearing on 3Commas
Possible causes:
♦ Wrong webhook URL → Must be exact 3Commas URL (check for typos)
♦ Bot paused → Check bot status must be "Active" (green)
♦ Wrong bot UUID → Verify you copied Long UUID for longs, Short UUID for shorts
♦ Secret mismatch → Double-check secret is correct
♦ Exchange API issues → Verify exchange connection in 3Commas settings
How to debug:
♦ 3Commas → Your Signal Bot → Orders tab
♦ Look for "Rejected Signals" section
♦ Should show error messages if webhook failed
───────────────────────────────────────────
✗ Problem: Orders executing at wrong prices
Possible causes:
♦ Limit order not filled → Price gapped through your level before order filled
♦ Slippage on exits → Exits use market orders (intentional - speed over exact price)
♦ Exchange minimums → Some exchanges have minimum order sizes
Solution:
♦ Entries use limit orders (wait for exact price - may not fill if price gaps)
♦ Exits use market orders (prioritize fast execution when structure breaks)
♦ This is INTENTIONAL DESIGN following Livermore's principle: exit when proven wrong
───────────────────────────────────────────
✗ Problem: PO orders firing out of sequence or skipping
Possible causes:
♦ Alert not set to "Once Per Bar Close" → Change alert frequency setting
♦ Multiple alerts running → Delete old/duplicate alerts for this indicator
♦ Conditions changed mid-bar → Indicator only fires at bar close (protective feature)
Solution:
♦ Keep only 1 active alert per indicator instance
♦ Always use "Once Per Bar Close" frequency
♦ Wait for full bar to close before signals can fire
───────────────────────────────────────────
✗ Problem: Bot not closing position on EXIT
Possible causes:
♦ Exit order setting wrong → Check bot settings
♦ Wrong JSON action → Should be "exit_long" or "exit_short"
♦ No position open → Can't close what doesn't exist
Solution:
♦ Verify: Bot Settings → Exit Orders → Volume per Order = "100 Position %"
♦ Check alert history for correct JSON payload
♦ If stuck: Manually close position in 3Commas, then fix settings
♦ Delete and recreate alert if JSON format is wrong
───────────────────────────────────────────
🔒 SECURITY BEST PRACTICES
♦ Never share bot UUID or Secret - Treat them like passwords
♦ Use restricted API keys - Limit to specific pairs, disable withdrawals
♦ Start small - Test with $10-50 first, scale up only after success
♦ Monitor first trades - Don't set-and-forget immediately
♦ Delete old alerts - If you change A/B/C points, delete old alert and create new one
───────────────────────────────────────────
📊 PREFER MANUAL TRADING?
Skip 3Commas entirely and use the indicator for planning only:
♦ Watch Trade Plan table for ✓✓✓✓✓ alignment
♦ Manually place limit orders at displayed prices
♦ Manually move stop loss as EXIT price updates
♦ Manually close when EXIT signal fires
Benefits: Full control, no API concerns, can override based on context
Drawbacks: Must watch chart constantly, emotions can interfere, may miss signals
───────────────────────────────────────────
✅ FINAL CHECKLIST BEFORE LIVE TRADING
✓ Both Signal Bots created (Long + Short)
✓ Entry Orders: Volume = "Send in webhook, quote"
✓ Exit Orders: Volume = "100 Position %"
✓ Take Profit and Stop Loss disabled in bots
✓ Bot UUIDs and Secret entered in indicator
✓ TradingView alert created with correct webhook
✓ Alert frequency = "Once Per Bar Close"
✓ Alert status shows "Active"
✓ Tested with small amounts successfully
✓ Trade Plan table shows ✅ (no validation errors)
✓ Understand your risk per trade
Once all checked: You're ready for automated pyramiding execution.
━━━━━━━━━━━━━━━━━━━━━━━━━━━━━━━━━━━━━━━━━━━
💡 KEY REMINDERS - BEFORE YOU TRADE
💬 "The speculator's chief enemies are always boring from within. It is inseparable from human nature to hope and to fear."
— Jesse Livermore
───────────────────────────────────────────
⚠️ COMMON MISTAKES (AVOID THESE)
Mapping Incomplete Waves
♦ Point C must be in the PAST (completed retrace, not currently forming)
♦ Don't map a wave that's still developing - wait for confirmation
♦ Minimum requirements: 5% impulse (A→B), 3% retrace (B→C)
Ignoring Validation Warnings
♦ Never create alerts when status shows ✗ (red) or ⚠️ (yellow)
♦ Fix all errors first: dates in order, budget = 100%, valid wave structure
♦ Common issues: dates in future, Point C above B (longs) or below B (shorts)
Premature Manual Entries
♦ Don't enter just because price touched the level
♦ Wait for ALL ✓✓✓✓✓ (or ✓✓✓✓✓✓) to align in Trade Plan table
♦ Patience pays - partial confluence = partial edge = higher risk of losing trades
Wrong Timeframe Selection
♦ Avoid: 15m, 5m, 1m (too much noise, false signals)
♦ Use: 1H, 4H, Daily (cleaner structure, better confluence)
♦ Lower timeframes require faster decisions and produce more whipsaws
Over-Risking Capital
♦ Trade budget ≠ Account size
♦ Never risk capital you can't afford to lose
♦ One bad trade should NOT destroy your account
───────────────────────────────────────────
✅ LIVERMORE PRINCIPLES IN ACTION
Confirmation > Prediction
♦ Don't predict where price will go
♦ Wait for price to INDICATE direction via pivots + volume + trend
♦ Test first (BO 20%), build only when confirmed (POs 80%)
💬 "A man must believe in himself and his judgment if he expects to make a living at this game."
Pyramid on Strength, Never Weakness
♦ Add only when: 3 closes + clean candles + volume + pivot breaks
♦ Never average down (DCA into losers)
♦ If BO wrong, take small loss fast - don't hope and add more
💬 "Never buy a stock because it has had a big decline from its previous high."
Respect Market Structure
♦ Pivots = where smart money previously acted (support/resistance)
♦ Breaking them = momentum overcoming barriers
♦ Entering before pivot break = entering into known rejection zones
Trend is Your Friend
♦ Never pyramid against the trend
♦ If trend shifts to Uncertain or reverses → no new entries
♦ Exit when trend proves you wrong (don't fight it)
💬 "I never argue with the tape. Getting sore at the market doesn't get you anywhere."
Discipline > Emotion
♦ Can't "almost" have all conditions met
♦ Either 100% aligned (all ✓) or you wait
♦ No exceptions, no "this time is different"
♦ Automation designed to help remove emotion - consider using 3Commas
💬 "It never was my thinking that made the big money for me. It always was my sitting."
───────────────────────────────────────────
🎯 FINAL THOUGHT
This indicator is a SYSTEMATIC FRAMEWORK, not a magic solution. It translates Livermore's century-old principles into actionable rules:
♦ Test small, build big
♦ Add to winners, cut losers fast
♦ Let structure guide exits
♦ Stay disciplined when emotions scream
The market will test your patience, discipline, and conviction. The indicator aims to reduce guesswork - but YOU still need to:
♦ Find valid wave structures
♦ Choose appropriate market conditions
♦ Size positions properly
♦ Accept losses as part of the game
💬 "The game of speculation is the most uniformly fascinating game in the world. But it is not a game for the stupid, the mentally lazy, the person of inferior emotional balance, or the get-rich-quick adventurer."
— Jesse Livermore

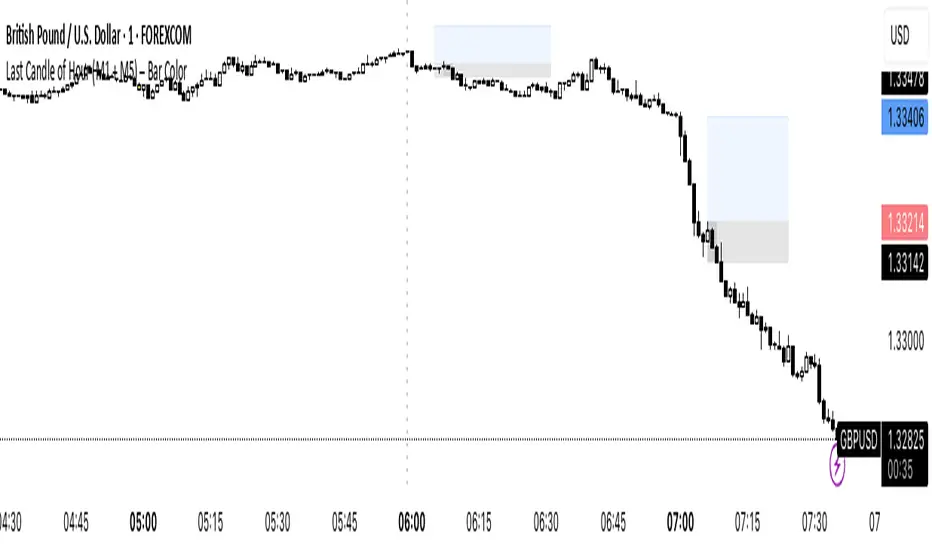
Last Candle of Hour Highlighter (M1 + M5)Highlights the last candle of every hour on 1-minute (M1) and 5-minute (M5) charts, making it easier to spot session closes, breakouts, and end-of-hour price action at a glance.
Detailed Description / How to Use:
This indicator automatically detects the last candle of each hour and changes its colour for quick visual reference. It’s designed for traders who use short-term timeframes (M1, M5) and want a clean visual cue for hourly closes.
Features:
• Automatically detects M1 and M5 timeframes.
• Highlights the last candle of each hour with a customisable colour.
• Optional Bull/Bear mode: colour changes depending on candle direction.
• Simple and lightweight — does not affect chart performance.
Inputs / Settings:
1. Color by Bull/Bear – Toggle on to automatically colour the last candle green (bullish) or red (bearish) based on its close relative to the open.
2. Highlight Colour – Choose a single colour if Bull/Bear mode is off.
3. Bullish Colour – Choose the colour for bullish last candles.
4. Bearish Colour – Choose the colour for bearish last candles.
Usage Tips:
• Works best on 1-minute and 5-minute charts.
• Ideal for spotting end-of-hour reversals, breakout candles, and momentum shifts.
• Can be combined with other indicators like support/resistance or moving averages for more advanced strategies.
SK Alpha SuiteTrend Dots
Aqua Level 1 Bullish Entry1
Green Level 2 Bullish Entry2
Lime Leve 3 Bullish Entry3 (Full Position)
Light Red Level 1 Bearish : Partial Close 10%-30%
Full Red Level 3 Bearish: Major Close
No StopLoss line hit or its already ended: Full close.
Purple/White Lines
Stop loss line, distance specific to each asset volatility, not fixed distance for all assets.
Close, Medium, Relaxed based on how close you want your stop loss to be.
With in bullish sentiment, if stoploss hits, stoploss will reset again on that bar, shown with white separation

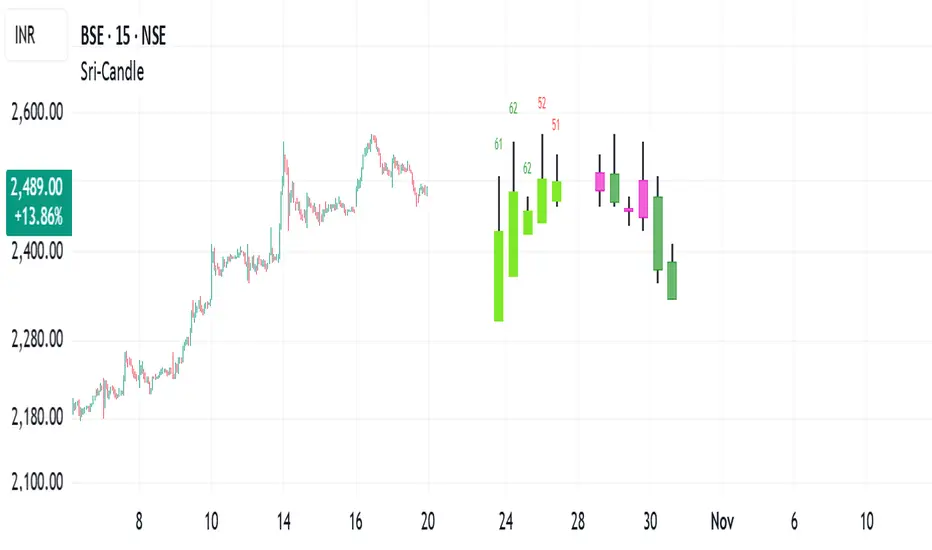
Sri - Daily & Weekly Candle Strength Sri - Daily & Weekly Candle Strength
Short Title: Sri-Candle
Overlay: Yes
Description:
The Sri - Daily & Weekly Candle Strength indicator is designed to visually display recent daily and weekly candle activity directly on your chart, highlighting buyer and seller dominance for each candle. It helps traders quickly assess the strength of bullish vs bearish pressure over recent periods and can be used with both Normal and Heikin Ashi candles. This tool is particularly useful for swing traders, position traders, and technical analysts who want a clear view of candle momentum without switching timeframes.
Features:
Multi-Timeframe Candles:
Displays the last several daily candles and weekly candles on your chart.
Supports Normal or Heikin Ashi candles for both daily and weekly views.
Candle Strength Analysis:
Calculates buyer strength and seller strength as percentages based on candle body relative to the total candle range.
Highlights the dominant strength (higher of buyer or seller) above each candle.
Option to round dominant strength percentages to whole numbers.
Customizable Colors:
Set separate bullish and bearish colors for daily and weekly candles.
Customize wick colors independently for daily and weekly candles.
Positioning and Layout Options:
Adjust horizontal offset, candle thickness, and gap between candles for both daily and weekly candles.
Choose label positions for date labels (Top, Bottom, Absolute level).
Flexible Text Display:
Choose label text size (Tiny, Small, Normal, Large, Huge).
Daily candles display the day of the month on the candle optionally.
Dynamic Candle Rendering:
Each candle is plotted as a box with wicks, accurately reflecting open, high, low, and close.
Dominant strength percentage label is colored green for bullish dominance and red for bearish dominance.
Inputs:
Daily Settings:
Show Daily Candles – Toggle daily candle visibility.
Daily Candle Type – Choose between Normal or Heikin Ashi.
Daily Timeframe – Select Daily (D), Weekly (W), or Monthly (M).
Bull Candle Color (D) – Color for bullish daily candles.
Bear Candle Color (D) – Color for bearish daily candles.
Wick Color (D) – Color for candle wicks.
Horizontal Offset (D) – Distance from current bar to start drawing.
Candle Thickness (D) – Width of candle boxes.
Gap Between Candles (D) – Space between consecutive candles.
Daily Label Position – Position for the date label.
Absolute Level – Y-axis level when using absolute label position.
Strength Label Text Size – Size of the dominant strength label.
Round Dominant % (No Decimals) – Round the displayed strength to whole numbers.
Weekly Settings:
Show Weekly Candles – Toggle weekly candle visibility.
Weekly Candle Type – Choose Normal or Heikin Ashi.
Weekly Timeframe – Select Daily (D), Weekly (W), or Monthly (M).
Bull Candle Color (W) – Color for bullish weekly candles.
Bear Candle Color (W) – Color for bearish weekly candles.
Wick Color (W) – Wick color for weekly candles.
Horizontal Offset (W) – Distance from current bar for weekly candles.
Candle Thickness (W) – Width of weekly candle boxes.
Gap Between Candles (W) – Space between consecutive weekly candles.
How It Works:
The script fetches candle data using the request.security() function for the selected timeframe and type (Normal or Heikin Ashi).
Each candle’s buyer and seller strength is calculated as:
Buyer Strength (%) = ((Close - Low) / (High - Low)) * 100
Seller Strength (%) = ((High - Close) / (High - Low)) * 100
Candles are drawn as boxes with wicks on the chart at the specified horizontal offset.
The dominant strength is displayed above each candle, colored green for bullish dominance or red for bearish dominance.
Daily candles can optionally show the day of the month as a label.
Use Cases:
Quickly identify recent bullish or bearish trends on daily and weekly timeframes.
Compare strength of buyers vs sellers across multiple periods.
Combine with other technical indicators for multi-timeframe analysis.
RSI Bollinger Bands [DCAUT]█ RSI Bollinger Bands
📊 ORIGINALITY & INNOVATION
The RSI Bollinger Bands indicator represents a meaningful advancement in momentum analysis by combining two proven technical tools: the Relative Strength Index (RSI) and Bollinger Bands. This combination addresses a significant limitation in traditional RSI analysis - the use of fixed overbought/oversold thresholds (typically 70/30) that fail to adapt to changing market volatility conditions.
Core Innovation:
Rather than relying on static threshold levels, this indicator applies Bollinger Bands statistical analysis directly to RSI values, creating dynamic zones that automatically adjust based on recent momentum volatility. This approach helps reduce false signals during low volatility periods while remaining sensitive to genuine extremes during high volatility conditions.
Key Enhancements Over Traditional RSI:
Dynamic Thresholds: Overbought/oversold zones adapt to market conditions automatically, eliminating the need for manual threshold adjustments across different instruments and timeframes
Volatility Context: Band width provides immediate visual feedback about momentum volatility, helping traders distinguish between stable trends and erratic movements
Reduced False Signals: During ranging markets, narrower bands filter out minor RSI fluctuations that would trigger traditional fixed-threshold signals
Breakout Preparation: Band squeeze patterns (similar to price-based BB) signal potential momentum regime changes before they occur
Self-Referencing Analysis: By measuring RSI against its own statistical behavior rather than arbitrary levels, the indicator provides more relevant context
📐 MATHEMATICAL FOUNDATION
Two-Stage Calculation Process:
Stage 1: RSI Calculation
RSI = 100 - (100 / (1 + RS))
where RS = Average Gain / Average Loss over specified period
The RSI normalizes price momentum into a bounded 0-100 scale, making it ideal for statistical band analysis.
Stage 2: Bollinger Bands on RSI
Basis = MA(RSI, BB Length)
Upper Band = Basis + (StdDev(RSI, BB Length) × Multiplier)
Lower Band = Basis - (StdDev(RSI, BB Length) × Multiplier)
Band Width = Upper Band - Lower Band
The Bollinger Bands measure RSI's standard deviation from its own moving average, creating statistically-derived dynamic zones.
Statistical Interpretation:
Under normal distribution assumptions with default 2.0 multiplier, approximately 95% of RSI values should fall within the bands
Band touches represent statistically significant momentum extremes relative to recent behavior
Band width expansion indicates increasing momentum volatility (strengthening trend or increasing uncertainty)
Band width contraction signals momentum consolidation and potential regime change preparation
📊 COMPREHENSIVE SIGNAL ANALYSIS
Visual Color Signals:
This indicator features dynamic color fills that highlight extreme momentum conditions:
Green Fill (Above Upper Band):
Appears when RSI breaks above the upper band, indicating exceptionally strong bullish momentum
Represents dynamic overbought zone - not necessarily a reversal signal but a warning of extreme conditions
In strong uptrends, green fills can persist as RSI "rides the band" - this indicates sustained momentum strength
Exit of green zone (RSI falling back below upper band) often signals initial momentum weakening
Red Fill (Below Lower Band):
Appears when RSI breaks below the lower band, indicating exceptionally weak bearish momentum
Represents dynamic oversold zone - potential reversal or continuation signal depending on trend context
In strong downtrends, red fills can persist as RSI "rides the band" - this indicates sustained selling pressure
Exit of red zone (RSI rising back above lower band) often signals initial momentum recovery
Position-Based Signals:
Upper Band Interactions:
RSI Touching Upper Band: Dynamic overbought condition - momentum is extremely strong relative to recent volatility, potential exhaustion or continuation depending on trend context
RSI Riding Upper Band: Sustained strong momentum, often seen in powerful trends, not necessarily an immediate reversal signal but warrants monitoring for exhaustion
RSI Crossing Below Upper Band: Initial momentum weakening signal, particularly significant if accompanied by price divergence
Lower Band Interactions:
RSI Touching Lower Band: Dynamic oversold condition - momentum is extremely weak relative to recent volatility, potential reversal or continuation of downtrend
RSI Riding Lower Band: Sustained weak momentum, common in strong downtrends, monitor for potential exhaustion
RSI Crossing Above Lower Band: Initial momentum strengthening signal, early indication of potential reversal or consolidation
Basis Line Signals:
RSI Above Basis: Bullish momentum regime - upward pressure dominant
RSI Below Basis: Bearish momentum regime - downward pressure dominant
Basis Crossovers: Momentum regime shifts, more significant when accompanied by band width changes
RSI Oscillating Around Basis: Balanced momentum, often indicates ranging market conditions
Volatility-Based Signals:
Band Width Patterns:
Narrow Bands (Squeeze): Momentum volatility compression, often precedes significant directional moves, similar to price coiling patterns
Expanding Bands: Increasing momentum volatility, indicates trend acceleration or growing uncertainty
Narrowest Band in 100 Bars: Extreme compression alert, high probability of upcoming volatility expansion
Advanced Pattern Recognition:
Divergence Analysis:
Bullish Divergence: Price makes lower lows while RSI touches or stays above previous lower band touch, suggests downward momentum weakening
Bearish Divergence: Price makes higher highs while RSI touches or stays below previous upper band touch, suggests upward momentum weakening
Hidden Bullish: Price makes higher lows while RSI makes lower lows at the lower band, indicates strong underlying bullish momentum
Hidden Bearish: Price makes lower highs while RSI makes higher highs at the upper band, indicates strong underlying bearish momentum
Band Walk Patterns:
Upper Band Walk: RSI consistently touching or staying near upper band indicates exceptionally strong trend, wait for clear break below basis before considering reversal
Lower Band Walk: RSI consistently at lower band signals very weak momentum, requires break above basis for reversal confirmation
🎯 STRATEGIC APPLICATIONS
Strategy 1: Mean Reversion Trading
Setup Conditions:
Market Type: Ranging or choppy markets with no clear directional trend
Timeframe: Works best on lower timeframes (5m-1H) or during consolidation phases
Band Characteristic: Normal to narrow band width
Entry Rules:
Long Entry: RSI touches or crosses below lower band, wait for RSI to start rising back toward basis before entry
Short Entry: RSI touches or crosses above upper band, wait for RSI to start falling back toward basis before entry
Confirmation: Use price action confirmation (candlestick reversal patterns) at band touches
Exit Rules:
Target: RSI returns to basis line or opposite band
Stop Loss: Fixed percentage or below recent swing low/high
Time Stop: Exit if position not profitable within expected timeframe
Strategy 2: Trend Continuation Trading
Setup Conditions:
Market Type: Clear trending market with higher highs/lower lows
Timeframe: Medium to higher timeframes (1H-Daily)
Band Characteristic: Expanding or wide bands indicating strong momentum
Entry Rules:
Long Entry in Uptrend: Wait for RSI to pull back to basis line or slightly below, enter when RSI starts rising again
Short Entry in Downtrend: Wait for RSI to rally to basis line or slightly above, enter when RSI starts falling again
Avoid Counter-Trend: Do not fade RSI at bands during strong trends (band walk patterns)
Exit Rules:
Trailing Stop: Move stop to break-even when RSI reaches opposite band
Trend Break: Exit when RSI crosses basis against trend direction with conviction
Band Squeeze: Reduce position size when bands start narrowing significantly
Strategy 3: Breakout Preparation
Setup Conditions:
Market Type: Consolidating market after significant move or at key technical levels
Timeframe: Any timeframe, but longer timeframes provide more reliable breakouts
Band Characteristic: Narrowest band width in recent 100 bars (squeeze alert)
Preparation Phase:
Identify band squeeze condition (bands at multi-period narrowest point)
Monitor price action for consolidation patterns (triangles, rectangles, flags)
Prepare bracket orders for both directions
Wait for band expansion to begin
Entry Execution:
Breakout Confirmation: Enter in direction of RSI band breakout (RSI breaks above upper band or below lower band)
Price Confirmation: Ensure price also breaks corresponding technical level
Volume Confirmation: Look for volume expansion supporting the breakout
Risk Management:
Stop Loss: Place beyond consolidation pattern opposite extreme
Position Sizing: Use smaller size due to false breakout risk
Quick Exit: Exit immediately if RSI returns inside bands within 1-3 bars
Strategy 4: Multi-Timeframe Analysis
Timeframe Selection:
Higher Timeframe: Daily or 4H for trend context
Trading Timeframe: 1H or 15m for entry signals
Confirmation Timeframe: 5m or 1m for precise entry timing
Analysis Process:
Trend Identification: Check higher timeframe RSI position relative to bands, trade only in direction of higher timeframe momentum
Setup Formation: Wait for trading timeframe RSI to show pullback to basis in trending direction
Entry Timing: Use confirmation timeframe RSI band touch or crossover for precise entry
Alignment Confirmation: All timeframes should show RSI moving in same direction for highest probability setups
📋 DETAILED PARAMETER CONFIGURATION
RSI Source:
Close (Default): Standard price point, balances responsiveness and reliability
HL2: Reduces noise from intrabar volatility, provides smoother RSI values
HLC3 or OHLC4: Further smoothing for very choppy markets, slower to respond but more stable
Volume-Weighted: Consider using VWAP or volume-weighted prices for additional liquidity context
RSI Length Parameter:
Shorter Periods (5-10): More responsive but generates more signals, suitable for scalping or very active trading, higher noise level
Standard (14): Default and most widely used setting, proven balance between responsiveness and reliability, recommended starting point
Longer Periods (21-30): Smoother momentum measurement, fewer but potentially more reliable signals, better for swing trading or position trading
Optimization Note: Test across different market regimes, optimal length often varies by instrument volatility characteristics
RSI MA Type Parameter:
RMA (Default): Wilder's original smoothing method, provides traditional RSI behavior with balanced lag, most widely recognized and tested, recommended for standard technical analysis
EMA: Exponential smoothing gives more weight to recent values, faster response to momentum changes, suitable for active trading and trending markets, reduces lag compared to RMA
SMA: Simple average treats all periods equally, smoothest output with highest lag, best for filtering noise in choppy markets, useful for long-term position analysis
WMA: Weighted average emphasizes recent data less aggressively than EMA, middle ground between SMA and EMA characteristics, balanced responsiveness for swing trading
Advanced Options: Full access to 25+ moving average types including HMA (reduced lag), DEMA/TEMA (enhanced responsiveness), KAMA/FRAMA (adaptive behavior), T3 (smoothness), Kalman Filter (optimal estimation)
Selection Guide: RMA for traditional analysis and backtesting consistency, EMA for faster signals in trending markets, SMA for stability in ranging markets, adaptive types (KAMA/FRAMA) for varying volatility regimes
BB Length Parameter:
Short Length (10-15): Tighter bands that react quickly to RSI changes, more frequent band touches, suitable for active trading styles
Standard (20): Balanced approach providing meaningful statistical context without excessive lag
Long Length (30-50): Smoother bands that filter minor RSI fluctuations, captures only significant momentum extremes, fewer but higher quality signals
Relationship to RSI Length: Consider BB Length greater than RSI Length for cleaner signals
BB MA Type Parameter:
SMA (Default): Standard Bollinger Bands calculation using simple moving average for basis line, treats all periods equally, widely recognized and tested approach
EMA: Exponential smoothing for basis line gives more weight to recent RSI values, creates more responsive bands that adapt faster to momentum changes, suitable for trending markets
RMA: Wilder's smoothing provides consistent behavior aligned with traditional RSI when using RMA for both RSI and BB calculations
WMA: Weighted average for basis line balances recent emphasis with historical context, middle ground between SMA and EMA responsiveness
Advanced Options: Full access to 25+ moving average types for basis calculation, including HMA (reduced lag), DEMA/TEMA (enhanced responsiveness), KAMA/FRAMA (adaptive to volatility changes)
Selection Guide: SMA for standard Bollinger Bands behavior and backtesting consistency, EMA for faster band adaptation in dynamic markets, matching RSI MA type creates unified smoothing behavior
BB Multiplier Parameter:
Conservative (1.5-1.8): Tighter bands resulting in more frequent touches, useful in low volatility environments, higher signal frequency but potentially more false signals
Standard (2.0): Default setting representing approximately 95% confidence interval under normal distribution, widely accepted statistical threshold
Aggressive (2.5-3.0): Wider bands capturing only extreme momentum conditions, fewer but potentially more significant signals, reduces false signals in high volatility
Adaptive Approach: Consider adjusting multiplier based on instrument characteristics, lower multiplier for stable instruments, higher for volatile instruments
Parameter Optimization Workflow:
Start with default parameters (RSI:14, BB:20, Mult:2.0)
Test across representative sample period including different market regimes
Adjust RSI length based on desired responsiveness vs stability tradeoff
Tune BB length to match your typical holding period
Modify multiplier to achieve desired signal frequency
Validate on out-of-sample data to avoid overfitting
Document optimal parameters for different instruments and timeframes
Reference Levels Display:
Enabled (Default): Shows traditional 30/50/70 levels for comparison with dynamic bands, helps visualize the adaptive advantage
Disabled: Cleaner chart focusing purely on dynamic zones, reduces visual clutter for experienced users
Educational Value: Keeping reference levels visible helps understand how dynamic bands differ from fixed thresholds across varying market conditions
📈 PERFORMANCE ANALYSIS & COMPETITIVE ADVANTAGES
Comparison with Traditional RSI:
Fixed Threshold RSI Limitations:
In ranging low-volatility markets: RSI rarely reaches 70/30, missing tradable extremes
In trending high-volatility markets: RSI frequently breaks through 70/30, generating excessive false reversal signals
Across different instruments: Same thresholds applied to volatile crypto and stable forex pairs produce inconsistent results
Threshold Adjustment Problem: Manually changing thresholds for different conditions is subjective and lagging
RSI Bollinger Bands Advantages:
Automatic Adaptation: Bands adjust to current volatility regime without manual intervention
Consistent Logic: Same statistical approach works across different instruments and timeframes
Reduced False Signals: Band width filtering helps distinguish meaningful extremes from noise
Additional Information: Band width provides volatility context missing in standard RSI
Objective Extremes: Statistical basis (standard deviations) provides objective extreme definition
Comparison with Price-Based Bollinger Bands:
Price BB Characteristics:
Measures absolute price volatility
Affected by large price gaps and outliers
Band position relative to price not normalized
Difficult to compare across different price scales
RSI BB Advantages:
Normalized Scale: RSI's 0-100 bounds make band interpretation consistent across all instruments
Momentum Focus: Directly measures momentum extremes rather than price extremes
Reduced Gap Impact: RSI calculation smooths price gaps impact on band calculations
Comparable Analysis: Same RSI BB appearance across stocks, forex, crypto enables consistent strategy application
Performance Characteristics:
Signal Quality:
Higher Signal-to-Noise Ratio: Dynamic bands help filter RSI oscillations that don't represent meaningful extremes
Context-Aware Alerts: Band width provides volatility context helping traders adjust position sizing and stop placement
Reduced Whipsaws: During consolidations, narrower bands prevent premature signals from minor RSI movements
Responsiveness:
Adaptive Lag: Band calculation introduces some lag, but this lag is adaptive to current conditions rather than fixed
Faster Than Manual Adjustment: Automatic band adjustment is faster than trader's ability to manually modify thresholds
Balanced Approach: Combines RSI's inherent momentum lag with BB's statistical smoothing for stable yet responsive signals
Versatility:
Multi-Strategy Application: Supports both mean reversion (ranging markets) and trend continuation (trending markets) approaches
Universal Instrument Coverage: Works effectively across equities, forex, commodities, cryptocurrencies without parameter changes
Timeframe Agnostic: Same interpretation applies from 1-minute charts to monthly charts
Limitations and Considerations:
Known Limitations:
Dual Lag Effect: Combines RSI's momentum lag with BB's statistical lag, making it less suitable for very short-term scalping
Requires Volatility History: Needs sufficient bars for BB calculation, less effective immediately after major regime changes
Statistical Assumptions: Assumes RSI values are somewhat normally distributed, extreme trending conditions may violate this
Not a Standalone System: Like all indicators, should be combined with price action analysis and risk management
Optimal Use Cases:
Best for swing trading and position trading timeframes
Most effective in markets with alternating volatility regimes
Ideal for traders who use multiple instruments and timeframes
Suitable for systematic trading approaches requiring consistent logic
Suboptimal Conditions:
Very low timeframes (< 5 minutes) where lag becomes problematic
Instruments with extreme volatility spikes (gap-prone markets)
Markets in strong persistent trends where mean reversion rarely occurs
Periods immediately following major structural changes (new trading regime)
USAGE NOTES
This indicator is designed for technical analysis and educational purposes to help traders understand the interaction between momentum measurement and statistical volatility bands. The RSI Bollinger Bands has limitations and should not be used as the sole basis for trading decisions.
Important Considerations:
No Predictive Guarantee: Past band touches and patterns do not guarantee future price behavior
Market Regime Dependency: Indicator performance varies significantly between trending and ranging market conditions
Complementary Analysis Required: Should be used alongside price action, support/resistance levels, and fundamental analysis
Risk Management Essential: Always use proper position sizing, stop losses, and risk controls regardless of signal quality
Parameter Sensitivity: Different instruments and timeframes may require parameter optimization for optimal results
Continuous Monitoring: Band characteristics change with market conditions, requiring ongoing assessment
Recommended Supporting Analysis:
Price structure analysis (support/resistance, trend lines)
Volume confirmation for breakout signals
Multiple timeframe alignment
Market context awareness (news events, session times)
Correlation analysis with related instruments
The indicator aims to provide adaptive momentum analysis that adjusts to changing market volatility, but traders must apply sound judgment, proper risk management, and comprehensive market analysis in their decision-making process.

Optimum EMAs x2Function Review
Optimum EMAs assesses EMA-price interactions by scoring reaction percentages for bullish/bearish touches. Creates EMA bands (top: most reactive bearish EMA as resistance; bottom: most reactive bullish EMA as support) with customizable test/bull/bear fast/slow EMAs, toggles, adjustable colors/gradients, and reaction table.
Usage Write-Up
Define fast (e.g., 5-15) and slow (e.g., 15-30) EMA ranges based on strategy. Scan with Test EMA for high reaction scores. Set optima in Bull/Bear Fast/Slow inputs to form reactive EMA bands (bullish top support, bearish bottom resistance), enhancing trend signals in bull/bear markets.

Digital RPM HUD — 4 Feeds + Confidence + Timeline (v3)🏎️ Digital RPM HUD — 4 Feeds + Confidence + Timeline (v3)
A performance-style trading dashboard for momentum-driven traders.
The Digital RPM HUD gives you an instant visual readout of market “engine speed” — combining four customizable data feeds (Trend, Momentum, Volume, Volatility) into a single confidence score (0–100) and a color-coded timeline of regime changes.
Think of it as a racing-inspired control panel: you only “hit the throttle” when confidence is high and all systems agree.
🔧 Key Features
4 Data Feeds – assign your own logic (EMA, RSI, RVOL, ATR, etc.).
Confidence Meter – blends the four feeds into one smooth 0–100 reading.
Timeline Strip – shows recent bullish / bearish / neutral states at a glance.
Visual Trade Cues – optional on-chart LONG / SHORT / EXIT markers.
Fully Customizable – thresholds, weights, smoothing, colors, layout.
HUD Overlay – clean, minimal, and adjustable to any corner of your chart.
💡 How to Use
Configure each feed to reflect your preferred signals (e.g., trend EMA 200, momentum RSI 14, volume RVOL 20, volatility ATR 14).
Watch the Confidence gauge:
✅ Above Bull Threshold → Market acceleration / long bias.
❌ Below Bear Threshold → Momentum loss / short bias.
⚪ Between thresholds → Neutral zone; stay patient.
Use the Timeline to confirm trend consistency — more green = bullish regime, more red = bearish.
⚙️ Recommended Setups
Scalping: Trend EMA 50 + RSI 7 + RVOL 10 + ATR 7 → Fast response.
Intraday: EMA 200 + RSI 14 + RVOL 20 + ATR 14 → Balanced signal.
Swing: Multi-TF Trend + MACD + RVOL + ATR → Smooth and steady.
⚠️ Disclaimer
This script is not a trading strategy and does not execute trades.
All signals are visual aids — always confirm with your own analysis and risk management.

Multi-SupertrendThis indicator overlays up to 4 fully customizable SuperTrend calculations on your chart. It is styled to match TradingView’s official SuperTrend indicator, using yellow and blue bands for trend direction.
Set ATR Length and Factor for each line individually.
Get immediate Bullish, Bearish, or ALL alerts:
Bullish: Close above all SuperTrend lines.
Bearish: Close below all SuperTrend lines.
Each line includes individual trend-change alerts for precision entries/exits.
Designed for scalpers, intraday traders, or positional analysis.
No repainting; built with TradingView's built-in ta.supertrend() for reliability.
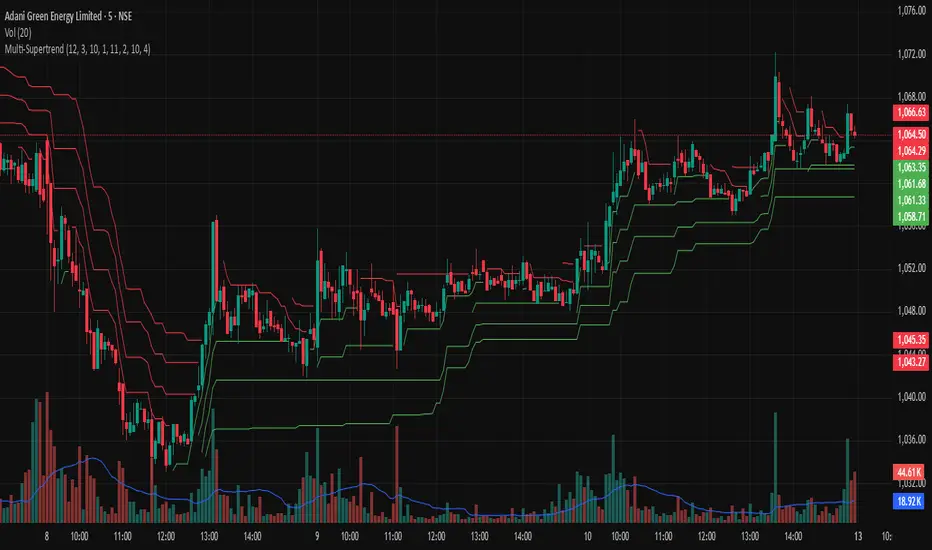
GRG/RGR Signal, MA, Ranges and PivotsThis indicator is a combination of several indicators.
It is a combination of two of my indicators which I solely use for trading
1. EMA 10-20-50-200, Pivots and Previous Day/Week/Month range
2. 3/4-Bar GRG / RGR Pattern (Conditional 4th Candle)
You can use them individually if you already have some of them or just use this one. Belive me when I say, this is all you need, along with market structure knowlege and even if you don’t have that, this indicator has been doing wonders for me. This is all I use. I do not use anything else.
**Note - Do checkout the indicators individually as I have added valuable information in the comment section.
It contains the following,
1. 10 EMA/SMA - configurable
2. 20 EMA/SMA - configurable
3. 50 EMA/SMA - configurable
4. 200 EMA/SMA - configurable
5. Previous Day's Range - configurable
6. Previous Week's Range - configurable
7. Previous Month's Range - configurable
8. Pivots - configurable
9. Buy Sell Signal - configurable
The Moving Averages
It is a very important combination and using it correctly with price action will strengthen your entries and exits.
The ema's or sma's added are the most powerful ones and they do definitely act as support and resistance.
The Daily/Weekly/Monthly Ranges
The Daily/Weekly/Monthly ranges are extremely important for any trader and should be used for targets and reversals.
Pivots
Pivots can provide support and resistance level. R5 and S5 can be used to check for over stretched conditions. You can customise them however you like. It is a full pivot indicator.
It is defaulted to show R5 and S5 only to reduce noise in the chart but it can be customised.
The 3/4 RGR or GRG Signal Generator
Combined with a 3/4 RGR or GRG setup can be all a trader needs.
You don't need complex strategies and SMC concepts to trade. Simple EMAs, ranges and RGR/GRG setup is the most winning combination.
This indicator can be used to identify the Green-Red-Green or Red-Green-Red pattern.
It is a price action indicator where a price action which identifies the defeat of buyers and sellers.
If the buyers comprehensively defeat the sellers then the price moves up and if the sellers defeat the buyers then the price moves down.
In my trading experience this is what defines the price movement.
It is a 3 or 4 candle pattern, beyond that i.e, 5 or more candles could mean a very sideways market and unnecessary signal generation.
How does it work?
Upside/Green signal
1. Say candle 1 is Green, which means buyers stepped in, then candle 2 is Red or a Doji, that means sellers brought the price down. Then if candle 3 is forming to be Green and breaks the closing of the 1st candle and opening of the 2nd candle, then a green arrow will appear and that is the place where you want to take your trade.
2. Here the buyers defeated the sellers.
3. Sometimes candle 3 falls short but candle 4 breaks candle 1's closing and candle 2's opening price. We can enter on candle 4.
4. Important - We need to enter the trade as soon as the price moves above the candle 1 and 2's body and should not wait for the 3rd or 4th candle to close. Ignore wicks.
5. But for a more optimised entry I have added an option to use candle’s highs and lows instead of open and close. This reduces lot of noise and provides us with more precise entry. This setting is turned on by default.
6. I have restricted it to 4 candles and that is all that is needed. More than that is a longer sideways market.
7. I call it the +-+ or GRG pattern or Green-Red-Green or Buyer-Seller-Buyer or Seller defeated or just Buyer pattern.
8. Stop loss can be candle 2's mid for safe traders (that includes me) or candle 2's body low for risky traders.
9. Back testing suggests that body low will be useless and result in more points in loss because for the bigger move this point will not be touched, so why not get out faster.
Downside/Red signal
1. Say candle 1 is Red, which means sellers stepped in, then candle 2 is Green or a Doji, that means buyers took the price up. Then if candle 3 is forming to be Red and breaks the closing of the 1st candle and opening of the 2nd candle then a Red arrow will appear and that is the place where you want to take your trade.
2. Sometimes candle 3 falls short but candle 4 breaks candle 1's closing and candle 2's opening price. We can enter on candle 4.
3. We need to enter the trade as soon as the price moves below the candle 1 and 2's body and should not wait for the 3rd or 4th candle to close.
4. But for a more optimised entry I have added an option to use candle’s highs and lows instead of open and close. This reduces lot of noise and provides us with more precise entry. This setting is turned on by default.
5. I have restricted it to 4 candles and that is all that is needed. More than that is a longer sideways market.
6. I call it the -+- or RGR pattern or Red-Green-Red or Seller-Buyer-Seller or Buyer defeated or just Seller pattern.
7. Stop loss can be candle 2's mid for safe traders ( that includes me) or candle 2's body high for risky traders.
8. Back testing suggests that body high will be useless and result in more points in loss because for the bigger move this point will not be touched, so why not get out faster.
Combining Indicators and Signal
Combining these indicators with GRG/RGR signal can be very powerful and can provide big moves.
1. MA crossover and Signal - This is very powerful and provides a very big move. Trades can be held for longer. If after taking the trade we notice that the MA crossover has happened then trades can be held for higher targets.
2. Pivots and Signal - Pivots and add a support or resistance point. Take profits on these points. R5/S5 are over streched conditions so we can start looking for reversal signals and ignore other signals
3. Intraday Range - first 1, 5, 15 min of the day - Sideways days is when price will stay in these ranges. You can take profits at these ranges or if the range is broken and we get a signal, then it can mean that the direction will be sustained.
4. Previous Day/Week/Month Ranges - These can be used as Take Profit points if the price is moving towards them after getting the signal. If the range is broken and we get a signal then it can be a strong signal. They can also be used as reversal points if a strong signal is generated.
Important Settings
1. Include 4th Candle Confirmation - You can enable or disable the 4th candle signal to avoid the noise, but at times I have noticed that the 4th candle gives a very strong signal or I can say that the strong signal falls on the 4th candle. This is mostly a coincidence.
2. Bars to check (default 10) - You can also configure how many previous bars should the signal be generated for. 10 to 30 is good enough. To backtest increase it to 2000 or 5000 for example.
3. Use Candle High/Low for confirmation instead of Candle Open/Close - More optimized entry and noise reduction. This option is now defaulted to false.
4. Show Green-Red-Green (bull) signals - Show only bull entries. Useful when I have a predefined view i.e, I know market is going to go up today.
5. Show Red-Green-Red (bear) signals - Show only bear entries. Useful when I have a predefined view i.e, I know market is going to go down today.
6. 3rd candle should be a Strong candle before considering 4th candle - This will enforce additional logic in 4 candle setup that the 3rd candle is the candle in our direction of breakout. This means something like GRGG is mandatory, which is still the default behaviour. If disabled, the 3rd candle can be any candle and 4th candle will act as our breakout candle. This behaviour has led to breakouts and breakdowns as times, hence I added this as a separate feature. Vice-versa for a RGGR.
For a 4 candle setup till now we were expecting GRGG or RGRR but we can let the system ignore the 3rd candle completely if needed.
This will result in additional signals.
7. Three intraday ranges added for index and stock traders - 1 min, 5 min and 15 min ranges will be displayed. These are disabled by default except 15 min. These are very important ranges and in sideways days the price will usually move within the 15 min. A breakout of this range and a positive signal can be a very powerful setup.
Safe traders can avoid taking a trade in this range as it can lead to fakeouts.
The line style, width, color and opacity are configurable.
Pointers/Golden Rules
1. If after taking the trade, the next candle moves in your direction and closes strong bullish or bearish, then move SL to break even and after that you can trail it.
2. If a upside trade hits SL and immediately a down side trade signal is generated on the next candle then take it. Vice versa is true.
3. Trades need to be taken on previous 2 candle's body high or low combined and not the wicks.
4. The most losses a trader takes is on a sideways day and because in our strategy the stop loss is so small that even on a sideways day we'll get out with a little profit or worst break even.
5. Hold trades for longer targets and don't panic.
6. If last 3-4 days have been sideways then there is a good probability that today will be trending so we can hold our trade for longer targets. Inverse is true when the market has been trending for 2-3 days then volatility followed by sideways is coming (DOW theory). Target to hold the trade for whole day and not exit till the day closes.
7. In general avoid trading in the middle of the day for index and stocks. Divide the day into 3 parts and avoid the middle.
8. Use Support/Resistance, 10, 20, 50, 200 EMA/SMA, Gaps, Whole/Round numbers(very imp) for identifying targets.
9. Trail your SL.
10. For indexes I would use 5 min and 15 min timeframe and at times 10 mins.
11. For commodities and crypto we can use higher timeframe as well. Look for signals during volatile time durations and avoid trading the whole day. Signal usually gives good targets on those times.
12. If a GRG or RGR pattern appears on a daily timeframe then this is our time to go big.
13. Minimum Risk to Reward should be 1:2 and for longer targets can be 1:4 to 1:10.
14. Trade with small lot size. Money management will happen automatically.
15. With small lot size and correct Risk-Reward we can be very profitable. Don't trade with big lot size.
16. Stay in the market for longer and collect points not money.
17. Very imp - Watch market and learn to generate a market view.
18. Very imp - Only 3 type of candles are needed in trading -
Strong Bullish (Big Green candle), Strong Bearish (Big Red candle),
Hammer (it is Strong Bullish), Inverse Hammer (it is Strong Bearish)
and Doji (indecision or confusion).
If on daily timeframe I see Strong Bullish candle previous day then I am biased to the upside the next day, if I see Strong Bearish candle the previous day then I am biased to the downside the next day, if I see Doji on the previous day then I am cautious the next day, if there are back to back Dojis forming in daily or weekly then I am preparing for big move so time to go big once I get the signal.
19. Most Important Candlestick pattern - Bullish and Bearish Engulfing
20. The only Chart patterns I need -
a) Falling Wedge/Channel Bullish Pattern Uptrend or Bull Flag - Buying - Forming over a couple days for intraday and forming over a couple of weeks for swing
b) Falling Wedge/Channel Bullish Pattern Downtrend or Falling Channel - Buying
c) Rising Wedge Bearish Pattern Uptrend or Rising Channel - Selling
d) Rising Wedge Bearish Pattern Downtrend or Bear flag - Selling
e) Head and Shoulder - Over a longer period not for intraday. In 15 min takes few days and for swing 1hr or 4h or daily can take few days
f) M and W pattern - Reversal Patterns - They form within the above 4 patterns, usually resulting in the break of trend line
21. How Gaps work -
a) Small Gap up in Uptrend - Market can fill the gap and reverse. The perception is that people are buying. If previous day candle was Strong Bullish then market view is up.
b) Big Gap up in Uptrend - Not news driven - Profit booking will come but may not fill the entire gap
c) Big Gap up in Uptrend - News driven, war related, tax, interest rate - Market can keep going up without stopping.
c) Flat opening in Uptrend - Big chance of market going up. If previous day candle was Strong Bullish then view is upwards, if it was Doji then still upwards.
d) Gap down in Uptrend - Market is surprised. After going down initially it can go up
e) Small Gap down in Downtrend - Market can fill the gap and keep moving down. If previous day candle was Strong Bearish then view is still down.
f) Flat opening in Downtrend - View is down, short today.
g) Big Gap down in Downtrend - Profit booking and foolish buying will come but market view is still down.
h) Gap down with News - Volatility, sideways then down.
i) Gap Up in Downtrend - Can move up - Price can move up during 2/3rd of the day and End of the day revert and close in red.
22. Go big on bearish days for option traders. Puts are better bought and Calls are better sold.
23. Cluster of green signals can lead to bigger move on the upside and vice versa for red signals.
24. Most of this is what I learned from successful traders (from the top 2%) only the indicator is mine.

Machine Learning Price Predictor: Ridge AR [Bitwardex]🔹Machine Learning Price Predictor: Ridge AR is a research-oriented indicator demonstrating the use of Regularized AutoRegression (Ridge AR) for short-term price forecasting.
The model combines autoregressive structure with Ridge regularization , providing stability under noisy or volatile market conditions.
The latest version introduces Bull and Bear signals , visually representing the current momentum phase and model direction directly on the chart.
Unlike traditional linear regression, Ridge AR minimizes overfitting, stabilizes coefficient dynamics, and enhances predictive consistency in correlated datasets.
The script plots:
Fit Line — in-sample fitted data;
Forecast Line — out-of-sample projection;
Trend Segments — color-coded bullish/bearish sections;
Bull/Bear Labels 🐂🐻 — dynamic visual signals showing directional bias.
Designed for researchers, students, and developers, this tool helps explore regularized time-series forecasting in Pine Script™.
🧩 Ridge AR Settings
Training Window — number of bars used for model training;
Forecast Horizon — forecast length (bars ahead);
AR Order — number of lags used as features;
Ridge Strength (λ) — regularization coefficient;
Damping Factor — exponential trend decay rate;
Trend Length — period for trend/volatility estimation;
Momentum Weight — strength of the recent move;
Mean Reversion — pullback intensity toward the mean.
🧮 Data Processing
Prefilter:
None — raw close price;
EMA — exponential smoothing;
SuperSmoother — Ehlers filter for noise reduction.
EMA Length, SuperSmoother Length — smoothing parameters.
🖥️ Display Settings
Update Mode:
Lock — static model;
Update Once Reached — rebuild after forecast horizon;
Continuous — update every bar.
Forecast Color — projection line color;
Bullish/Bearish Colors — colors for trend segments.
🐂🐻 Bull/Bear Signal System
The Bull/Bear Signal System adds directional visual cues to highlight local momentum shifts and model-based trend confirmation.
Bull (🐂) — appears when upward momentum is confirmed (momentum > 0) .
Displayed below the bar, colored with Bullish Color.
Bear (🐻) — appears when downward momentum is dominant (momentum < 0) .
Displayed above the bar, colored with Bearish Color.
Signals are generated during model recalculations or when the directional bias changes in Continuous mode.
These visual markers are analytical aids , not trading triggers.
🧠 Core Algorithmic Components
Regularized AutoRegression (Ridge AR):
Solves: (X′X+λI)−1X′y
to derive stable regression coefficients.
Matrix and Pseudoinverse Operations — implemented natively in Pine Script™.
Prefiltering (EMA / Ehlers SuperSmoother) — stabilizes noisy data.
Forecast Dynamics — integrates damping, momentum, and mean reversion.
Trend Visualization — color-coded bullish/bearish line segments.
Bull/Bear Signal Engine — visualizes real-time impulse direction.
📊 Applications
Academic and educational purposes;
Demonstration of Ridge Regression and AR models;
Analysis of bull/bear market phase transitions;
Visualization of time-series dependencies.
⚠️ Disclaimer
This script is provided for educational and research purposes only.
It does not provide trading or investment advice.
The author assumes no liability for financial losses resulting from its use.
Use responsibly and at your own risk.

Magic Volume - Projected [MW]Magic Volume – Projected
This lower-pane volume tool estimates the full-bar volume before the bar closes by measuring the current bar’s elapsed time and the rate of incoming volume. It then contrasts that “expected volume” against typical activity and recent momentum to spotlight potential burst conditions (breakout/acceleration), color-codes the live volume stream, and annotates when the projected surge is likely bullish or bearish based on bar structure and recent highs/lows.
Settings
Projected / Expected Volume
Moving Average: EMA length used for volume baseline comparisons. (Default: 14)
Minimum Volume: Hard floor the bar’s raw volume must exceed to qualify as notable. (Default: 10,000)
Consecutive Volume Above 14 EMA: Count required for “sustained” high-volume context. (Default: 3)
Stochastic Volume Burst
Stochastic Length: Window for the Stochastic calculation on volume. (Default: 8)
Smoothing: Smoothing applied to Stochastic volume and its signal. (Default: 3)
Stochastic Volume Breakout Threshold: Level above which Stochastic volume is considered a breakout. (Default: 20)
Volume Bar Increase Amount: Multiplier the current bar’s volume must exceed vs. prior bar to be considered a “burst.” (Default: 1.618)
Plotted Items
Expected Volume (columns): Magenta columns projecting the full-bar volume from intrabar rate. Turns lime when a high expected-volume condition aligns with bullish bar structure; turns red under analogous bearish conditions.
Actual Volume (columns): Live volume columns, color-coded by state:
• Blue = baseline;
• Orange = “burst” (volume rising fast above prior × factor and above baseline);
• Yellow = “burst at breakout” (burst + Stochastic volume breakout);
• Light Blue = Stochastic breakout only.
Volume EMA (line): Yellow EMA for baseline comparison (default 14).
Calculations
Compute elapsed time in the current bar (ms → seconds) and convert the current bar’s accumulated volume into a rate (volume per second).
Project full-bar Expected Volume = (volume so far / seconds elapsed) × bar-seconds.
Compute Volume EMA (default 14) for baseline; derive Stochastic(volume, length) and smoothed signal for momentum.
Define “Burst” conditions:
• Volume > prior volume × Volume Bar Increase Amount;
• Volume > Minimum Volume;
• Volume > Volume EMA;
• Stochastic(volume) rising and/or above threshold.
Classify “Burst at Breakout” when Burst aligns with Stochastic crossover above the Breakout Threshold.
Classify Bullish/Bearish Expected Volume: if Expected Volume is ≥ 1.618 × prior bar volume and prior volume > Volume EMA, then:
• Bullish if bar is green with a rising low;
• Bearish if bar is red with a falling high.
Color-map actual volume columns by state; overlay Expected Volume columns (magenta) and paint conditional overlays (lime/red) when directional context is detected.
How to Use
Spot the Surge Early
When Expected Volume spikes well above typical (and especially above ~1.618× the prior bar) before the bar closes, it often precedes a volatile move. Use this to prepare entries with tight, structure-based risk (e.g., just beyond the current bar’s wick) and asymmetric targets.
Confirm with Momentum
Yellow/orange volume columns indicate burst/breakout behavior in the live tape. When this aligns with a lime (bullish) or red (bearish) Expected Volume column, the probability of follow-through improves—particularly if aligned with prevailing trend or key levels.
Context Matters
Combine with your preferred S/R or structure tools (e.g., order blocks, channels, VWAP) to avoid chasing into obvious supply/demand. The projected surge can mark both continuations and sharp reversals depending on location and broader context.
Alerts
High Expected Volume – Bullish: When projected volume surges and the price action meets bullish conditions (green body with rising low).
High Expected Volume – Bearish: When projected volume surges and the price action meets bearish conditions (red body with falling high).
Other Usage Notes and Limitations
Projected volume depends on intrabar pace; abrupt pauses/flushes can change the projection quickly, especially on very small timeframes.
Minimum Volume and EMA baselines help filter thin markets; adjust upward on illiquid symbols to reduce noise.
A rising projection does not pick direction on its own—directional coloring (lime/red) requires price-action confirmation; otherwise treat magenta projections as “heads-up” only.
As with any single indicator, use within a broader plan (risk management, structure, confluence) to mitigate false positives and improve selectivity.
Inputs (Quick Reference)
Moving Average (int, default 14)
Stochastic Length (int, default 8)
Smoothing (int, default 3)
Stochastic Volume Breakout Threshold (int, default 20)
Volume Bar Increase Amount (float, default 1.618)
Minimum Volume (int, default 10,000)
Consecutive Volume Above 14 EMA (int, default 3)
