Bull Vs Bear Visible Range VP [Kioseff Trading]Hello!
This Script “Bull vs Bear Visible Range VP” Calculates Bull & Bear Volume Profiles for the Visible Range Alongside a Delta Ladder for the Visible Period!
Features
Volume Profile Anchored to Visible Range
Delta Ladder Anchored to Visible Range
Bull vs Bear Profiles!
Standard Poc and Value Area Lines, in Addition to Separated POCs and Value Area Lines for Bull Profiles and Bear Profiles
Configurable Value Area Target
Curved Profiles
Up to 9999 Profile Rows per Visible Range
Stylistic Options for Profiles
This Script Generates Bull vs. Bear Volume Profiles for the Visible Range!
Up to 9999 Volume Profile Levels (Price Levels) Can Be Calculated for Each Profile, Thanks to the New Polyline Feature, Allowing For Less Aggregation / More Precision of Volume at Price and Volume Delta.
Bull vs Bear Profiles
The Image Above Shows Primary Functionality!
Green Profiles = Buying Volume
Red Profiles = Selling Volume
Bullish & Bearish Pocs for the Visible Range Are Displayable!
Profiles Can Be Anchored on the Left Side for a More Traditional Look.
The indicator is robust enough to calculate on "small price periods", or for a price period spanning your entire chart fully zoomed out!
That’s About It :D
This Indicator Is Part of a Series Titled “Bull vs. Bear” - A Suite of Profile-Like Indicators I Will Be Releasing Over Coming Days. Thanks for Checking This Out!
If You Have Any Suggestions Please Feel Free to Share!
在腳本中搜尋"bear"

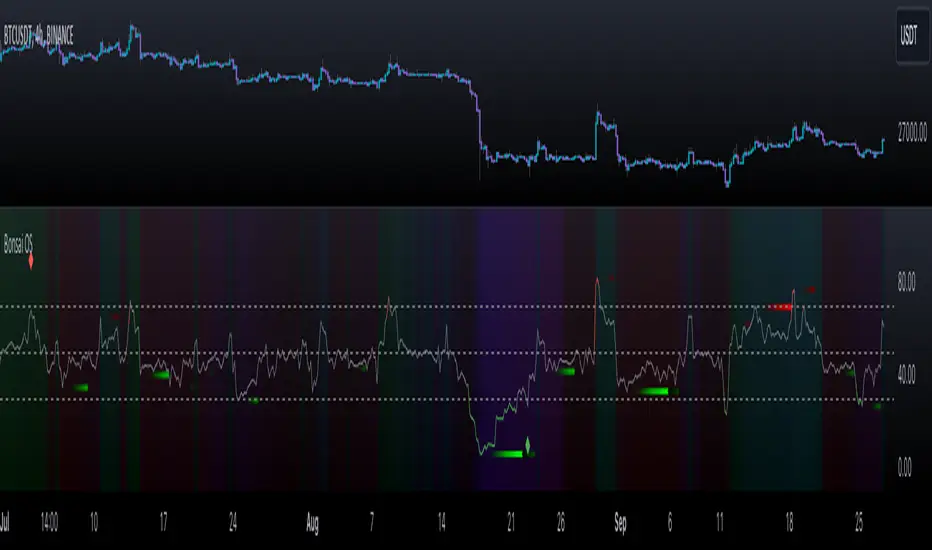
Bonsai OS (Oscillators)Bonsai OS combines four oscillators (RSI, CCI, Stochastic, MACD) in one interface. Features divergence detection, color-intensity, and insights into divergences. Assists traders in spotting potential pivot points.
═════════════════════════════════════════════════════════════════════════
🌳 Bonsai OS 🌳 Advanced Oscillator Suite
📘 Overview
Bonsai OS is a tool tailored for traders focusing on reversal strategies and those keen on identifying market divergences. Combining multiple oscillators into one unified interface, it aids traders in pinpointing potential pivot reversal points.
📌 Algorithm Logic
• Multi-Oscillator Integration: Bonsai OS calculates and integrates the values from four standard oscillators: RSI, CCI, Stochastic, and MACD. Each oscillator's value is derived from its respective mathematical formula, analyzing historical data points.
• Divergence Detection: The tool runs a series of comparisons between price action and oscillator values. When discrepancies (divergences) are observed, they are highlighted, suggesting potential market reversals.
• Price Strength Visualization: A gradient background that is determined by an average of the oscillator values in relation to their historical norms, thereby providing a visual cue about the current price strength, whether it is strong or weak.
• Alerts: Users can set up notifications based on specific divergence insights. Once set criteria are met, alerts are triggered.
🎯 Purpose
• For Professionals: Bonsai OS offers integrated oscillator readings, allowing a more in-depth market analysis.
• For Beginners: Simplified readings and visual cues make it easier for newcomers to understand oscillator indicators and market conditions.
🛠 Distinctive Elements
• Oscillator Fusion: Bonsai OS goes beyond just grouping oscillators. It looks for matching divergences across them, aiming to find stronger signals for market reversals.
• Divergence Indicators: Bonsai OS identifies divergence patterns between price trends and oscillator readings, highlighting their intensity with color variations.
• Insight into Failed Divergences: Recognizing not all divergences lead to reversals, Bonsai OS provides markers for potential false signals, helping traders exercise caution and fine-tune their strategies.
Getting Bullish/Bearish and Divergences
📊 Features
• Data Source Customization: Users have the flexibility to choose between default data inputs or adjust to their preferred price points (like High & Low).
• Combined Divergence Signals: Beyond individual oscillator divergences, Bonsai OS identifies instances when several oscillators indicate divergence at the same time.
• Adaptable Outputs: Outputs like 'Bullish Divergence ▲', 'Getting Bullish ▲', 'Getting Bearish ▼' and 'Bearish Divergence ▼' are plotted as non-displayable 1 or 0 for seamless integration into other custom indicators, ensuring a harmonious integration.
Here's an example of a custom indicator that can be used for inputting data from external sources:
//@version=5
indicator("My Script Template", overlay = true)
group_name = "External Source"
external = input.source(title = "Source", defval = close, inline = "external", group = group_name)
val = input.int(title = ">", defval = 0, inline = "external", group = group_name)
// Your logic follows here...
Bonsai OS as External Source
🎛 How To Use Bonsai OS
1. Select the desired oscillator.
2. Monitor the color changes for market condition insights.
3. Look out for divergence markers to anticipate potential market shifts.
4. If required, set up alerts for real-time updates.
Indicator Settings Menu
📜 Feedback & Continual Development
We welcome your feedback. It's essential for the continuous improvement of Bonsai OS and to better serve the TradingView community.
❗️ Disclaimer
Trading involves risks. Bonsai OS aims to provide an analytical tool to support traders, but it's essential to complement its insights with other research. Always seek advice from financial professionals and trade responsibly.
GKD-C Bulls/Bears Power and Accelerator [Loxx]The Giga Kaleidoscope GKD-C Bulls/Bears Power and Accelerator is a confirmation module included in Loxx's "Giga Kaleidoscope Modularized Trading System."
█ GKD-C Bulls/Bears Power and Accelerator
Bulls/Bears Power and Accelerator calculates the difference between two custom T3-based filters, called "Bears" and "Bulls". These filters are based on the difference between a simple moving average (SMA) of the closing price and the respective high and low prices of a security. If the "Bears" value is greater than the "Bulls", a red bar is displayed, and if the "Bulls" is greater, a green bar is shown. This representation aims to help traders detect bullish or bearish tendencies based on the relative values of the two filters. The plotted lines for the "Bears" and "Bulls" are in red and green colors, respectively, to visually distinguish their trends.
█ Giga Kaleidoscope Modularized Trading System
Core components of an NNFX algorithmic trading strategy
The NNFX algorithm is built on the principles of trend, momentum, and volatility. There are six core components in the NNFX trading algorithm:
1. Volatility - price volatility; e.g., Average True Range, True Range Double, Close-to-Close, etc.
2. Baseline - a moving average to identify price trend
3. Confirmation 1 - a technical indicator used to identify trends
4. Confirmation 2 - a technical indicator used to identify trends
5. Continuation - a technical indicator used to identify trends
6. Volatility/Volume - a technical indicator used to identify volatility/volume breakouts/breakdown
7. Exit - a technical indicator used to determine when a trend is exhausted
8. Metamorphosis - a technical indicator that produces a compound signal from the combination of other GKD indicators*
*(not part of the NNFX algorithm)
What is Volatility in the NNFX trading system?
In the NNFX (No Nonsense Forex) trading system, ATR (Average True Range) is typically used to measure the volatility of an asset. It is used as a part of the system to help determine the appropriate stop loss and take profit levels for a trade. ATR is calculated by taking the average of the true range values over a specified period.
True range is calculated as the maximum of the following values:
-Current high minus the current low
-Absolute value of the current high minus the previous close
-Absolute value of the current low minus the previous close
ATR is a dynamic indicator that changes with changes in volatility. As volatility increases, the value of ATR increases, and as volatility decreases, the value of ATR decreases. By using ATR in NNFX system, traders can adjust their stop loss and take profit levels according to the volatility of the asset being traded. This helps to ensure that the trade is given enough room to move, while also minimizing potential losses.
Other types of volatility include True Range Double (TRD), Close-to-Close, and Garman-Klass
What is a Baseline indicator?
The baseline is essentially a moving average, and is used to determine the overall direction of the market.
The baseline in the NNFX system is used to filter out trades that are not in line with the long-term trend of the market. The baseline is plotted on the chart along with other indicators, such as the Moving Average (MA), the Relative Strength Index (RSI), and the Average True Range (ATR).
Trades are only taken when the price is in the same direction as the baseline. For example, if the baseline is sloping upwards, only long trades are taken, and if the baseline is sloping downwards, only short trades are taken. This approach helps to ensure that trades are in line with the overall trend of the market, and reduces the risk of entering trades that are likely to fail.
By using a baseline in the NNFX system, traders can have a clear reference point for determining the overall trend of the market, and can make more informed trading decisions. The baseline helps to filter out noise and false signals, and ensures that trades are taken in the direction of the long-term trend.
What is a Confirmation indicator?
Confirmation indicators are technical indicators that are used to confirm the signals generated by primary indicators. Primary indicators are the core indicators used in the NNFX system, such as the Average True Range (ATR), the Moving Average (MA), and the Relative Strength Index (RSI).
The purpose of the confirmation indicators is to reduce false signals and improve the accuracy of the trading system. They are designed to confirm the signals generated by the primary indicators by providing additional information about the strength and direction of the trend.
Some examples of confirmation indicators that may be used in the NNFX system include the Bollinger Bands, the MACD (Moving Average Convergence Divergence), and the MACD Oscillator. These indicators can provide information about the volatility, momentum, and trend strength of the market, and can be used to confirm the signals generated by the primary indicators.
In the NNFX system, confirmation indicators are used in combination with primary indicators and other filters to create a trading system that is robust and reliable. By using multiple indicators to confirm trading signals, the system aims to reduce the risk of false signals and improve the overall profitability of the trades.
What is a Continuation indicator?
In the NNFX (No Nonsense Forex) trading system, a continuation indicator is a technical indicator that is used to confirm a current trend and predict that the trend is likely to continue in the same direction. A continuation indicator is typically used in conjunction with other indicators in the system, such as a baseline indicator, to provide a comprehensive trading strategy.
What is a Volatility/Volume indicator?
Volume indicators, such as the On Balance Volume (OBV), the Chaikin Money Flow (CMF), or the Volume Price Trend (VPT), are used to measure the amount of buying and selling activity in a market. They are based on the trading volume of the market, and can provide information about the strength of the trend. In the NNFX system, volume indicators are used to confirm trading signals generated by the Moving Average and the Relative Strength Index. Volatility indicators include Average Direction Index, Waddah Attar, and Volatility Ratio. In the NNFX trading system, volatility is a proxy for volume and vice versa.
By using volume indicators as confirmation tools, the NNFX trading system aims to reduce the risk of false signals and improve the overall profitability of trades. These indicators can provide additional information about the market that is not captured by the primary indicators, and can help traders to make more informed trading decisions. In addition, volume indicators can be used to identify potential changes in market trends and to confirm the strength of price movements.
What is an Exit indicator?
The exit indicator is used in conjunction with other indicators in the system, such as the Moving Average (MA), the Relative Strength Index (RSI), and the Average True Range (ATR), to provide a comprehensive trading strategy.
The exit indicator in the NNFX system can be any technical indicator that is deemed effective at identifying optimal exit points. Examples of exit indicators that are commonly used include the Parabolic SAR, the Average Directional Index (ADX), and the Chandelier Exit.
The purpose of the exit indicator is to identify when a trend is likely to reverse or when the market conditions have changed, signaling the need to exit a trade. By using an exit indicator, traders can manage their risk and prevent significant losses.
In the NNFX system, the exit indicator is used in conjunction with a stop loss and a take profit order to maximize profits and minimize losses. The stop loss order is used to limit the amount of loss that can be incurred if the trade goes against the trader, while the take profit order is used to lock in profits when the trade is moving in the trader's favor.
Overall, the use of an exit indicator in the NNFX trading system is an important component of a comprehensive trading strategy. It allows traders to manage their risk effectively and improve the profitability of their trades by exiting at the right time.
What is an Metamorphosis indicator?
The concept of a metamorphosis indicator involves the integration of two or more GKD indicators to generate a compound signal. This is achieved by evaluating the accuracy of each indicator and selecting the signal from the indicator with the highest accuracy. As an illustration, let's consider a scenario where we calculate the accuracy of 10 indicators and choose the signal from the indicator that demonstrates the highest accuracy.
The resulting output from the metamorphosis indicator can then be utilized in a GKD-BT backtest by occupying a slot that aligns with the purpose of the metamorphosis indicator. The slot can be a GKD-B, GKD-C, or GKD-E slot, depending on the specific requirements and objectives of the indicator. This allows for seamless integration and utilization of the compound signal within the GKD-BT framework.
How does Loxx's GKD (Giga Kaleidoscope Modularized Trading System) implement the NNFX algorithm outlined above?
Loxx's GKD v2.0 system has five types of modules (indicators/strategies). These modules are:
1. GKD-BT - Backtesting module (Volatility, Number 1 in the NNFX algorithm)
2. GKD-B - Baseline module (Baseline and Volatility/Volume, Numbers 1 and 2 in the NNFX algorithm)
3. GKD-C - Confirmation 1/2 and Continuation module (Confirmation 1/2 and Continuation, Numbers 3, 4, and 5 in the NNFX algorithm)
4. GKD-V - Volatility/Volume module (Confirmation 1/2, Number 6 in the NNFX algorithm)
5. GKD-E - Exit module (Exit, Number 7 in the NNFX algorithm)
6. GKD-M - Metamorphosis module (Metamorphosis, Number 8 in the NNFX algorithm, but not part of the NNFX algorithm)
(additional module types will added in future releases)
Each module interacts with every module by passing data to A backtest module wherein the various components of the GKD system are combined to create a trading signal.
That is, the Baseline indicator passes its data to Volatility/Volume. The Volatility/Volume indicator passes its values to the Confirmation 1 indicator. The Confirmation 1 indicator passes its values to the Confirmation 2 indicator. The Confirmation 2 indicator passes its values to the Continuation indicator. The Continuation indicator passes its values to the Exit indicator, and finally, the Exit indicator passes its values to the Backtest strategy.
This chaining of indicators requires that each module conform to Loxx's GKD protocol, therefore allowing for the testing of every possible combination of technical indicators that make up the six components of the NNFX algorithm.
What does the application of the GKD trading system look like?
Example trading system:
Backtest: Multi-Ticker CC Backtest
Baseline: Hull Moving Average
Volatility/Volume: Hurst Exponent
Confirmation 1: Advance Trend Pressure as shown on the chart above
Confirmation 2: uf2018
Continuation: Coppock Curve
Exit: Rex Oscillator
Metamorphosis: Baseline Optimizer
Each GKD indicator is denoted with a module identifier of either: GKD-BT, GKD-B, GKD-C, GKD-V, GKD-M, or GKD-E. This allows traders to understand to which module each indicator belongs and where each indicator fits into the GKD system.
█ Giga Kaleidoscope Modularized Trading System Signals
Standard Entry
1. GKD-C Confirmation gives signal
2. Baseline agrees
3. Price inside Goldie Locks Zone Minimum
4. Price inside Goldie Locks Zone Maximum
5. Confirmation 2 agrees
6. Volatility/Volume agrees
1-Candle Standard Entry
1a. GKD-C Confirmation gives signal
2a. Baseline agrees
3a. Price inside Goldie Locks Zone Minimum
4a. Price inside Goldie Locks Zone Maximum
Next Candle
1b. Price retraced
2b. Baseline agrees
3b. Confirmation 1 agrees
4b. Confirmation 2 agrees
5b. Volatility/Volume agrees
Baseline Entry
1. GKD-B Baseline gives signal
2. Confirmation 1 agrees
3. Price inside Goldie Locks Zone Minimum
4. Price inside Goldie Locks Zone Maximum
5. Confirmation 2 agrees
6. Volatility/Volume agrees
7. Confirmation 1 signal was less than 'Maximum Allowable PSBC Bars Back' prior
1-Candle Baseline Entry
1a. GKD-B Baseline gives signal
2a. Confirmation 1 agrees
3a. Price inside Goldie Locks Zone Minimum
4a. Price inside Goldie Locks Zone Maximum
5a. Confirmation 1 signal was less than 'Maximum Allowable PSBC Bars Back' prior
Next Candle
1b. Price retraced
2b. Baseline agrees
3b. Confirmation 1 agrees
4b. Confirmation 2 agrees
5b. Volatility/Volume agrees
Volatility/Volume Entry
1. GKD-V Volatility/Volume gives signal
2. Confirmation 1 agrees
3. Price inside Goldie Locks Zone Minimum
4. Price inside Goldie Locks Zone Maximum
5. Confirmation 2 agrees
6. Baseline agrees
7. Confirmation 1 signal was less than 7 candles prior
1-Candle Volatility/Volume Entry
1a. GKD-V Volatility/Volume gives signal
2a. Confirmation 1 agrees
3a. Price inside Goldie Locks Zone Minimum
4a. Price inside Goldie Locks Zone Maximum
5a. Confirmation 1 signal was less than 'Maximum Allowable PSVVC Bars Back' prior
Next Candle
1b. Price retraced
2b. Volatility/Volume agrees
3b. Confirmation 1 agrees
4b. Confirmation 2 agrees
5b. Baseline agrees
Confirmation 2 Entry
1. GKD-C Confirmation 2 gives signal
2. Confirmation 1 agrees
3. Price inside Goldie Locks Zone Minimum
4. Price inside Goldie Locks Zone Maximum
5. Volatility/Volume agrees
6. Baseline agrees
7. Confirmation 1 signal was less than 7 candles prior
1-Candle Confirmation 2 Entry
1a. GKD-C Confirmation 2 gives signal
2a. Confirmation 1 agrees
3a. Price inside Goldie Locks Zone Minimum
4a. Price inside Goldie Locks Zone Maximum
5a. Confirmation 1 signal was less than 'Maximum Allowable PSC2C Bars Back' prior
Next Candle
1b. Price retraced
2b. Confirmation 2 agrees
3b. Confirmation 1 agrees
4b. Volatility/Volume agrees
5b. Baseline agrees
PullBack Entry
1a. GKD-B Baseline gives signal
2a. Confirmation 1 agrees
3a. Price is beyond 1.0x Volatility of Baseline
Next Candle
1b. Price inside Goldie Locks Zone Minimum
2b. Price inside Goldie Locks Zone Maximum
3b. Confirmation 1 agrees
4b. Confirmation 2 agrees
5b. Volatility/Volume agrees
Continuation Entry
1. Standard Entry, 1-Candle Standard Entry, Baseline Entry, 1-Candle Baseline Entry, Volatility/Volume Entry, 1-Candle Volatility/Volume Entry, Confirmation 2 Entry, 1-Candle Confirmation 2 Entry, or Pullback entry triggered previously
2. Baseline hasn't crossed since entry signal trigger
4. Confirmation 1 agrees
5. Baseline agrees
6. Confirmation 2 agrees

Zaree - Bull & Bear Volume VoidThe "Zaree - Bull & Bear Volume Void" (BBVV) indicator is a versatile tool designed to help traders assess the dynamics of bull and bear power in the market, with a focus on volume-based analysis. This indicator offers a range of features that aid in identifying potential shifts in market sentiment and strength.
Details of the Indicator:
Volume Void Color Settings: This indicator allows you to customize the colors used for different conditions, such as strong bull areas, slowing bull areas, strong bear areas, and slowing bear areas. These colors play a crucial role in visualizing the indicator's output.
Volume Void Settings: The BBVV indicator provides options for selecting specific volume void functions, which include "Relative Volume Comparison," "Percentage of Average Volume," "Fixed Volume Threshold," "Volatility-Adjusted Volume," "Compare to Previous Volume Bars," "Volume Percentile Rank," and "Market Session Comparison." Each function has its own criteria for evaluating volume conditions.
Void Bull Sensitivity and Void Bear Sensitivity: These are key parameters in the settings. The values you choose for void bull sensitivity and void bear sensitivity will significantly impact the background color displayed by the indicator. Properly configuring these values is crucial for the indicator's effectiveness.
Moving Average Settings: You can specify the source and length of moving averages used in the indicator. This helps in smoothing out data and providing a clearer picture of bull and bear power.
Void Color Background Conditions: The indicator dynamically changes the background color of the chart based on the current market conditions. It takes into account bull and bear power, as well as the configured sensitivity levels to determine whether the market is in a strong or slowing bull/bear phase.
MACD and Signal Lines: The indicator also displays MACD and signal lines on the chart, helping traders identify potential bullish and bearish crossovers.
Histogram Bars: Histogram bars are used to represent the strength of bull and bear power. Above-zero bars indicate bullish strength, while below-zero bars indicate bearish strength.
How to Use the Indicator:
Begin by customizing the color settings for different market conditions to your preference.
Select a volume void function that aligns with your trading strategy and objectives.
Configure the void bull sensitivity and void bear sensitivity values carefully. These values should reflect your desired sensitivity to volume conditions.
Choose the source and length of moving averages based on your analysis requirements.
Pay attention to the background color of the chart. It will change dynamically based on the current market conditions, providing insights into the strength of bull and bear power.
Observe the MACD and signal lines for potential bullish or bearish crossovers, which can be used as additional confirmation signals.
Interpret the histogram bars to gauge the strength of bull and bear power.
Example of Usage:
As a swing trader with a focus on volume analysis, you can use the BBVV indicator to enhance your trading decisions. Here's an example of how you might use the indicator:
Select "Relative Volume Comparison" as the volume void function to assess volume relative to a simple moving average.
Configure void bull sensitivity and void bear sensitivity to match your risk tolerance and trading style.
Choose "SMA" as the moving average type with a suitable length.
Pay attention to the background color changes in the chart. Strong bull areas may indicate potential bullish opportunities, while strong bear areas may signal bearish conditions.
Monitor the MACD and signal lines for potential crossovers, aligning them with the background color to validate your trading decisions.
Use the histogram bars to assess the strength of bull and bear power, helping you gauge market sentiment.
Remember that the BBVV indicator is a valuable tool to complement your trading strategy. It provides insights into volume dynamics and market conditions, allowing you to make informed trading choices.
Be sure to adjust the indicator settings according to your trading preferences and always consider the broader market context in your analysis.

Divergence Indicator Screener [Trading Solutions]It's been a while since the last publication on the platform. We've been studying the charts and developing some interesting strategies and indicators, so we'll be posting some ideas in the near future.
Overview
This indicator allows you to find divergences between the price action and the classic RSI. It has the ability to anticipate trend changes.
Highs and Lows are determined using Pivot Points, wich can be adjusted in settings.
You can use this indicator to find two kind of divergences, Regular and Hidden:
Regular is when price makes a higher high, but the RSI makes a lower high
Hidden is when price makes a lower high, but the RSI makes a higher high
The opposite case for Bearish Divergence
The most important functionality of this indicator is that we can be alerted when a divergence occurs in different trading pairs, without the necessity of checking different charts at the same time, and seize opportunities offered by the market. You only have to go to Alerts Tab , click on Create Alert , select Divergence Indicator Screener and wait for the Notification in your favorite device.
You can choose any ticker to be plotted on chart and even add a new one.
Settings
To get everything started with this indicator, here are the different inputs:
RSI Settings: Period y Source
Pivot Point: Left and Right lookback bars
Filter Divergences: Regular and Hidden and max and min distance from the pivot points to consider a valid divergence
Draw table and Filter how much bars to look for a divergence in the past and plot it in the table: The fewer bars, less divergences shown
We hope you can take the most of this tool, and helps improve your day to day trading. Feel free to comment and make suggestions. We will be updating soon

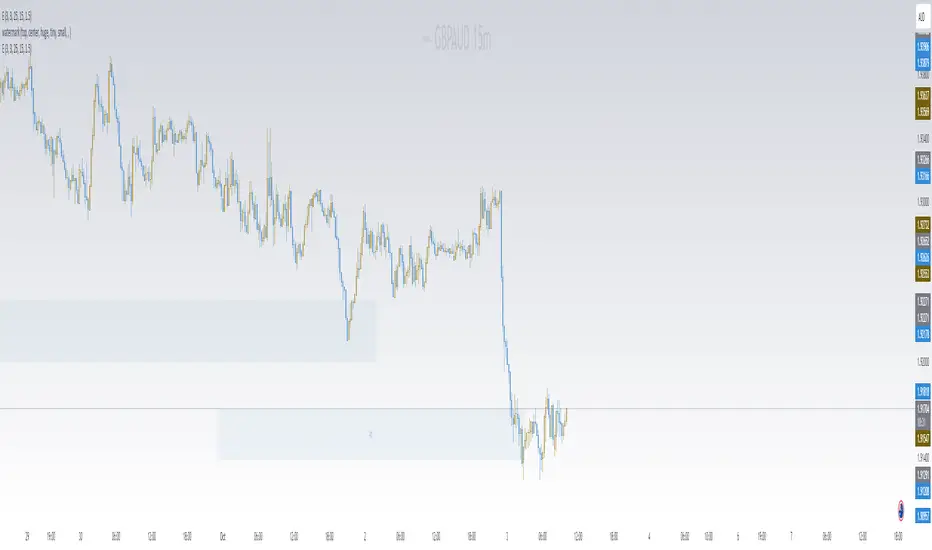
FOREX MASTER PATTERN Companion ToolWhat This Indicator Does
The Forex Master Pattern uses candlesticks, which provide more information than line, OHLC or area charts. For this reason, candlestick patterns are a useful tool for gauging price movements on all time frames. While there are many candlestick patterns, there is one which is particularly useful...
The Engulfing Pattern
An engulfing pattern provides an excellent trading opportunity because it can be easily spotted and the price action indicates a strong and immediate change in direction. In a downtrend, an up candle real body will completely engulf the prior down candle real body (bullish engulfing). In an uptrend a down candle real body will completely engulf the prior up candle real body (bearish engulfing).
Used in conjunction with the FOREX Master Pattern value line, the Engulfing Pattern can assist the trader with reversal timing or trend confirmation during the expansion and trend phases.
As shown in the screenshot below. Engulfing Candles usually precede a sharp move in price in the direction of the engulfing candle.
As shown in the screenshot below, when the Show Lines option is ON while using the indicator, both red and green lines are drawn on the chart automatically when engulfing candles form. These lines are projected forward 100 bars and tend to be reliable support and resistance areas. These areas are typically hidden from view.
In addition to the Show Lines option, the indicator (by default) creates boxes around trading zones that are created when an engulfing candle is formed. (There is an option to hide these from view if desired).
As seen in the screenshot below, these areas / zones are wider than a line and encompass a resistance / support zone rather than a specific price. Liquidity is usually high in these areas and a lot of selling / buying occurs here. These zones are drawn in advance out into the future giving the trader an idea of where price will revert to eventually.
A combination of LINES and AREAS can be used giving the user a better idea of where within the zone price will go.
As seen on the screenshot below, this combination provides a pretty accurate indication of the reversal point well in advance.
As seen in the screenshot below, when a ZONE / AREA has been fully breached (crossed) by price, the area is deactivated an no longer continues forward on the chart. Until price breaches an area, it remains valid and continues on the chart until and only if it is breached by price.
The Indicator is fully customizable.
The use can change the color of the engulfing candles, the color of the zones, transparency etc. You can turn OFF or ON any of the features such as lines, zones, bar coloring, and plotted arrows.
I really hope you get value from this indicator and... HAPPY TRADING!!

Conditional Chart Pattern Signals: Big MCCPS Big M uses exclusive method to finalize pivot points and has more options to refine chart patterns.
Label Tooltip: Show more information of the signal.
Market Trend: Random/Bullish/Bearish. Show pattern if market trend is not required/bullish/bearish.
Confirm Candle: Random/Bullish/Bearish.
Volume Trend: Random/Up/Down is determined by linear regression. Show pattern if volume trend is not required/up/down.
Volume Percentile %: Intraday: 60 (active). Day and above: set at your preference. Range 0-100. A value of 0 means that no filter is applied and all patterns satisfy the condition. A value of 100 means that no pattern satisfies the condition.
Specification:
tinyurl.com
Usage:
Enter at the open of the next bar after the signal or right when the signal appears (depending on your very own evaluation of the market at that time as sometimes price could reach targets within one bar). Adding caution, a little bit of experience will be needed to recognize if price actually reacts and follows the signals generated by CCPS Big M.
Stop-loss suggested by the signal is generated as a quick analysis. In general, you need to have your own deeper analysis to have it. Take profit based on your preference of risk and/or other indicators of target/support/resistance.
Other Features:
• Non-repainting: show honest signals on the realtime bar, not on historical bars.
• Compact design.
• Support alerts.
Markets: All. Developed and tested on: forex.
Timeframes: All. Developed and tested on: 30m.
User Categories: Breakout Reversal, Bearish.

Tilson Bull-Bear-MarkerThe Tilson Bull-Bear marker is using 2 Tilson moving averages and their divergence to identify bull and bear trends and reversals (potential entry or exit points).
How to use it:
Fast T3 (thick line) above thin line / solid blue fill color = ongoing bull trend
Slow T3 (thin line) above thick line / solid red fill color = ongoing bear trend
Shrinking or expanding divergence between the lines = trend is getting hotter or cooling down
Fast T3 (thick line) changes color from blue to red = potential trend reversal from bullish to bearish
Fast T3 (thick line) changes color from red to blue = potential trend reversal from bearish to bullish
(No financial advise, for testing purposes only)

Engulfing Candles AlertThis is a Engulfing Candle Indicator with Alerts.
This is not like any other Engulfing candle indicator present on TV. There are some special rules that are being used to identify specific engulfing candles.
Also, the user can choose if they like nice body engulfing or they want to ignore them.
The indicator have the following highlights:
1) Ability to choose the color of the engulfing candle body.
2) Ability to choose a different color for the Liq (liquidity) swap engulfing candle body.
Bullish Engulfing after Liq Swap
Bearish Engulfing after Liq Swap
3) With above 2 options, you can get the desired information without plotting any extra information on the chart.
4) You can put the alerts for getting notified when these patterns forms on the chart.
5) Ability to choose between getting notified or not on the chart if the engulfing candle body is less than 40% of the whole candle size. This is useful in order to identify if the engulfing is really powerful or not.
After selecting the option to ignore such engulfing
6) Ability to choose between getting notified or not on the chart if the engulfed candle body is really small. This is in particular useful for avoiding the engulfing of Doji which in turn might not be that powerful.
After selecting the option to ignore such engulfing
We will keep on making the improvements/Enhancements over the time (Check the changelog for such features)
NOTE: The indicator is of best use if you have a defined & back tested strategy which relies on this type of candlestick pattern.
Infiten's Adjusted Bull-Bear Power Oscillator An extension of TradingView's new ADR and bull-bear power indicators, this indicator is helpful for spotting abnormal bullish and bearish activity to get good contrarian entry points.
How to interpret the indicator
When the white columns cross over the red line, it's a bearish indicator since the asset has been overbought.
When the white columns cross under the green line, it's a bullish indicator since the asset has been oversold.
How it's calculated
The adjusted bull-bear power oscillator is calculated by multiplying the bull-bear power indicator by my NDO indicator, to adjust the bull-bear power for volume. The upper green line and lower red line are calculated as the product of a multiplier input and the average daily range indicator.

Order Blocks Finder By DrewAn Order Block is a technical analysis technique that tracks the accumulation of orders (when bullish) and distribution of orders (when bearish) of banks and institutional traders. In other words, it is an area or an indication of where big institutions would pile up their orders to enter the market – their order blocks.
If you know how order blocks works and know how to trade via order blocks, then this indicator will help you in finding order blocks by itself which you don't need to worry about finding any.
For settings, I personally use Box Length as 10 and Box Transparency 80. Hope this helps! Feel free to drop a comment for any questions :)
Would appreciate you all if you can LIKE and FAVOURITE this indicator.

Artharjan - RSI and RSI-Moving Avg Crossover SignalsHi,
I have created "Artharjan - Index Heavy Weight Components RSI and RSI-Moving Avg Crossover Bullish/Bearish/Neutral Signal" (Short Name - ARSICROSSOVER) indicator for Traders whereby they can see the RSI and RSI Moving Average Values for Indices and Index heavyweight Components at the same time in a Dashboard.
The analysis is based on 2 different timeframes. Basically when Higher timeframe RSI is Bullish and Lower timeframe is Bearish then you enter the LONG trade when Lower Timeframe RSI shows "Bullish Reversal Signal" &
when Higher timeframe RSI is Bearish and Lower timeframe is Bullish then you enter the SHORT trade when Lower Timeframe RSI shows "Bearish Reversal Signal"
The two timeframes which I have selected by Default are Weekly (Higher timeframe) and 30 min Lower (Trade Entry) Timeframe
Also I have used to source to calculate the RSI as 5 period WMA of hlc3, if you want use raw RSI to generate crossover signals then change the source to "close" and input soothing to '1' instead of '5'
The system generates very accurate Buy and Sell Signals and when the script is range bound in its respective timeframe it shows Neutral signal
The overbought and oversold levels for Higher and Lower timeframes are set to be 60/40 and 70/30 respectively, however Traders may change these levels as per their preferences.
For intraday trades I would recommend using Higher time frame as "Daily" and Lower (Trade Entry) Timeframe as "15 min"
For Swing trades I would recommend using Higher time frame as "Weekly" and Lower (Trade Entry) Timeframe as "75 min"
For Positional trades I would recommend using Higher time frame as "Monthly" and Lower (Trade Entry) Timeframe as "Daily"
Also you can select maximum 10 Scripts at any given point in time.
My recommendation would be to use Sector Index as Script 1 and then Heavy weight components of that Sector in Script 2 to 10
This will help you to identify which Stock is responsible to pull index Up or Down and then you may decide to take either a Long Trade or Short Trade accordingly.
The Background Color and Bullish/Bearish/Neutral stages are decided based on following logic
1] If Higher timeframe RSI > Overbought Level - Stock is in a Bull Run
2] If Higher timeframe RSI > If Higher timeframe EMA of RSI = Positively Bullish
3] If Higher timeframe RSI < Oversold Level - Stock is in a Bear Run
4] If Higher timeframe RSI < If Higher timeframe EMA of RSI = Positively Bearish
5] Bulls will be said to have control if Condition 1 & 2 are true
6] Bears will be said to have control if Condition 3 & 4 are true
7] The Stock/Index will be said to be in a Neutral zone if its RSI is less than Overbought Level but greater than Oversold Level
The same rules are applicable for a Lower (Trade Entry) Timeframe
Hope you guys like this indicator and are able to make decent money by using it.
Regards
Rahul Desai
@Artharjan

Momentum With Bullish & Bearish LabelMOMENTUM WITH BULLISH AND BEARISH SIGNALS
This is a momentum oscillator that paints red or green depending on whether Momentum is above or below the zero line. It includes a label on the right hand side that will reflect the bullish or bearish direction of the current momentum by changing colors to red or green and text telling you Bullish or Bearish.
***HOW TO USE***
When Momentum is above zero, it is bullish. When Momentum is below zero it is bearish.
A label on the right side will update in real time to tell you if momentum is Bullish or Bearish for faster recognition of the trend.
When momentum is above the zero line(Bullish) but trending downward, a second label will show up in purple to notify you of a change in momentum direction.
When momentum is below the zero line(Bearish) but trending upward, a second label will show up in purple to notify you of a change in momentum direction.
This indicator was built to help you quickly identify the Bullish or Bearish nature of the current Momentum using colors as well as a live color changing label so you can glance at the label and understand it's direction without analyzing the indicator data.
***MARKETS***
This indicator can be used as a signal on all markets, including stocks, crypto, futures and forex.
***TIMEFRAMES***
This momentum indicator can be used on all timeframes.
***TIPS***
Try using numerous indicators of ours on your chart so you can instantly see the bullish or bearish trend of multiple indicators in real time without having to analyze the data. Some of our favorites are our Auto Fibonacci, Directional Movement Index, Volume Profile, Auto Support And Resistance and Money Flow Index in combination with this Momentum Oscillator. They all have real time Bullish and Bearish labels as well so you can immediately understand each indicator's trend.

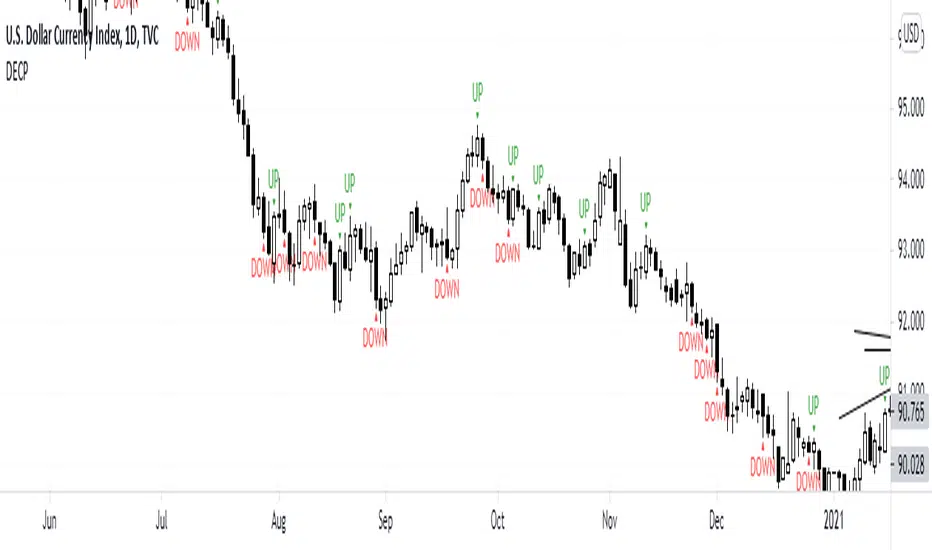
DECPDECP is simple and easy to use!
It detects bullish and bearish engulfing candlestick patterns.
After detecting the patterns I've said, it mentions that the pattern is going to continue its direction to up or down.
But remember candlestick patterns don't determine targets and it's possible that predicted directions fail.
So use it carefully and enjoy it!
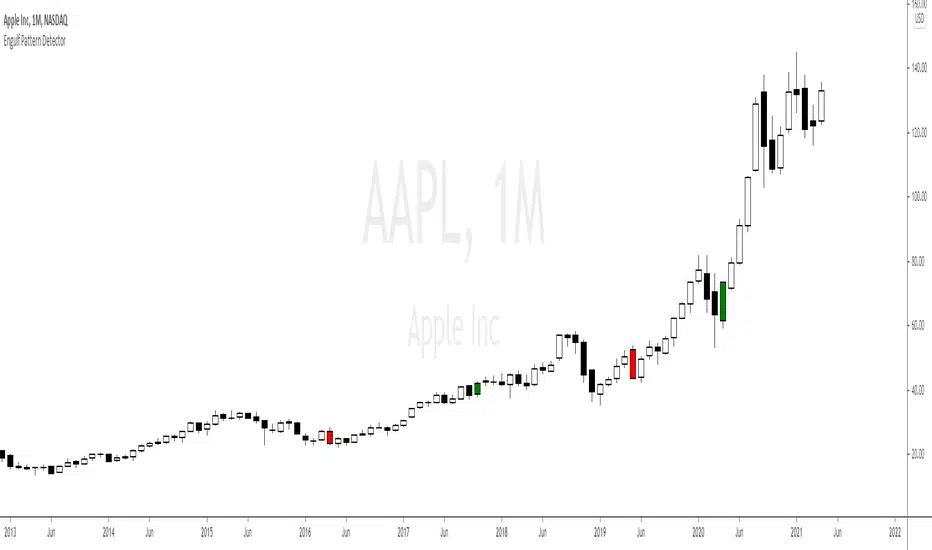
Engulf Pattern DetectorThis indicator let us automatically detect and color the strongest and most powerful Engulf Patterns in any time frame.
Its difference and great potential regarding other existing indicators is that its formula takes into account the average size of the previous candles throughout the ATR, therefore, it only indicates the really strong ones that interest us for Price Action, Supports and Resistances in supply and demand levels. These strongest levels are the ones which work at best as turning points pivot points for the market.
This indicator let us to adjust ourselves to the best configuration by means of parameters in order to be more strict in the force of the impulses and to approximately mark the quantity of Engulf Patterns.
Este indicador nos permite detectar y pintar de color de forma automática los Patrones Engulf más fuertes y potentes en cualquier marco de tiempo posible.
Su diferencia y gran potencial con respecto a los demás indicadores existentes es que su fórmula tiene en cuenta el tamaño medio de las velas anteriores mediante el ATR y por tanto, sólo señala los realmente fuertes que nos interesan para el Price Action y los Soportes y Resistencias en niveles de Oferta y Demanda. Estos niveles más fuertes son aquellos que mejor funcionan como puntos pivote de giro del mercado.
Este indicador nos permite ajustar mediante los parámetros la mejor configuración para ser más estrictos en la fuerza de los impulsos y marcar más o menos cantidad de patrones de Engulf.
Parameters Settings / Parámetros Ajustables:
[ ERC Min Body vs Full Candle Size % : Minimum body percentage vs full candle to consider “Extended Range Candle”, default 75% / Porcentaje mínimo del “cuerpo” de la vela con respecto a la vela entera para considerarla una “Vela Extendida”, por defecto 75%]
[ Engulf Full Candle Size vs ATR % : Minimum Full candle size percentage vs ATR average, default 150% / Porcentaje mínimo del tamaño de la vela completa respecto al ATR medio, por defecto 150%]
[ ATR Length : Candles Number to calculate ATR average, default 30 / Cantidad de velas para medir el ATR, por defecto 30]
[ Use ATR filter? : We can activate or deactivate the ATR calculates, default activated / Podemos anular el cálculo sobre el ATR y hacerlo normal, por defecto activado]
Color Settings / Colores Ajustables:
[ Color 0 : Vela Engulf Alcista / Bullish Engulf]
[ Color 1 : Vela Engulf Bajista / Bearish Engulf]
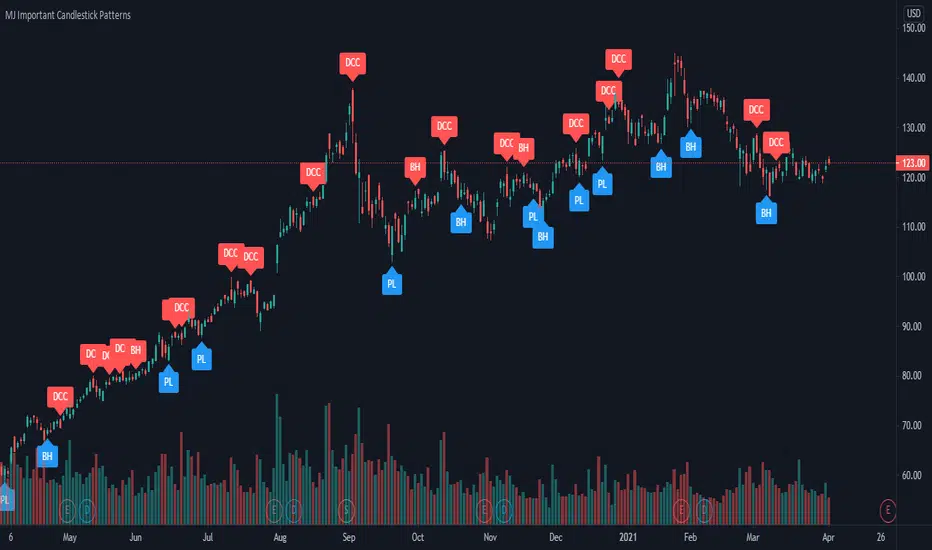
MJ Important Candlestick Patterns + Smart TrendThis script detects 6 important candlestick patterns defined by the author and puts chart labels on your chart for your attention. It also includes a smart trend checking algorithm to detect trends.
The six candlestick patterns covered are:
Bullish Engulfing
Bearish Engulfing
Piercing Line
Dark Cloud Cover
Bullish Harami
Bearish Harami
*** Smart feature of this indicator is that it can detect uptrends or downtrends before alerting you regarding the bullish or bearish reversal candlestick pattern. This is achieved by comparing the typical price (high+low+close divided by 3) of today's candle versus three days ago.
[astropark] Cumulative Volume Delta (CVD)Dear Followers,
today another awesome Analysis Tool, that you can use in your trading journey: Cumulative Volume Delta (CVD) , also known as Cumulative Delta Volume (CDV)!
Volume says a lot about price action:
price drops with low volume? or price pumps but no volume increase?
big sellers volume but price does not drop? or big buyers volume but price does not increase?
The Cumulative Volume Delta measures the effectiveness of buyers and sellers' actions, so basically if the volume they generate with their buy and sell market orders is effective on price or not.
When it's not effective, a divergence appears and we, as traders, can profit from it.
Here some examples how you can use the indicator by spotting divergences between price and cumulative volume delta.
EURUSD, 15m
sellers trying hard to make price fall, but volume is lacking on CVD (exhaustion): bullish divergence
EURUSD, 15m
buyers trying hard to make price go up, but volume is lacking on CVD (exhaustion): many bearish divergences
SPX500, 15m
buyers exhaustion: bearish divergence
XAUUSD, 15m
sellers exhaustion: bullish divergences
XAGUSD, 15m
buyers exhaustion: bearish divergence
BTCUSD, 15m
buyers exhaustion: bearish divergence (in red)
buyers absorbed sellers' pressure: hidden bullish divergence (in green)
BTCUSD, 15m
inefficiency by buyers: higher and higher buy volume but it's not effective on price (sellers absorbed): hidden bearish divergence (in blue)
sellers exhaustion: bullish divergences (in green)
buyers exhaustion: bearish divergence (in red)
ETHBTC, 15m
buyers exhaustion: bearish divergence (in red)
inefficiency by sellers: higher and higher sell volume but it's not effective on price (buyers absorbed): hidden bullish divergence (in blue)
TSLA, 15m
inefficiency by sellers, sellers pressure absorbed by buyers: hidden bullish divergence (in blue)
buyers exhaustion: bearish divergence (in red)
sellers exhaustion: bullish divergence (in green)
inefficiency by buyers, sellers pressure absorbed by sellers: hidden bearish divergence (in fuchsia)
This indicator works on every timeframe, market and pair, by the way must be said that it works best on 15m and 5m timeframes, as you can have access to a more detailed volume information.
As I always say, all tools are great if you use them correctly: this is not the "Holy Grail", so always use proper money and risk management strategies.
This is a premium indicator , so send me a private message in order to get access to this script.

Bull / Bear Volume (BBV) - Indicator"An approximation of the average Bull Volume component versus the average Bear Volume component of total Volume. Displays an interesting and helpful view of the ebb and flow of Bull and Bear Volume pressure in the market. Shows what the bears are up to while the bulls are in control and vice versa. You can see bull pressure building (or bear pressure diminishing) in advance of a bullish price move (especially in sideways markets and horizontal rectangular consolidations). The graph moves in curves from which you can often extrapolate reasonably accurate and useful projections of future Bull or Bear Volume Action." - Kaiji
This indicator has been totally converted by me from Amibroker Formula Language (AFL) into our pinescript just to make it suitable to use in our tradingview platform. I don't take any credits and neither I wished for. I just shared it for the sake of our tradingview community and whatever calculations are used in the script are all credit goes to 'kaiji' a developer in AFL who build this indicator in Amibroker platfrom where you can find him.

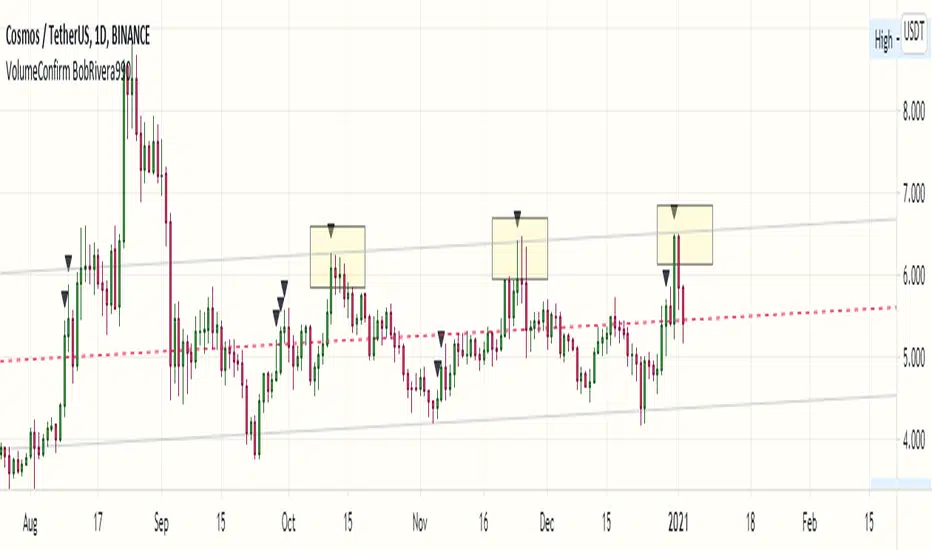
Volume Confirmation Signal by BobRivera990The purpose of this script is to determine the response of trading volume to price action
This is not an indicator but a set of four signals
1 - Bullish Strength Signal (Upward Green Triangle) :
If the resistance is broken at the same time is valid
this signal indicates the continuation of the bullish trend
the trading volume is relatively high.
If the bar is closed above the resistance level, It will probably turn into support.
2 - Bullish Reversal Signal (Upward Black Triangle) :
if the bar is closed above the support level is valid
this signal indicates trend reversal after a bearish candle
the trading volume is very high.
3 - Bearish Strength Signal (Downward Red Triangle) :
If the Support is broken at the same time is valid
this signal indicates the continuation of the bearish trend
the trading volume is relatively high.
If the bar is closed below the support level, It will probably turn into resistance.
4 - Bearish Reversal Signal (Downward Black Triangle) : if the bar is closed below the resistance level is valid
this signal indicates trend reversal after a bullish candle
the trading volume is very high.
EMA ATR Engulfing CandlesThis is good old EMA (Exponential Moving Average) with a twist. The EMA line is surrounded by ATR on either side giving you visibility on how market breadth is working out.
The icing on this cake is in the form of engulfing candle indications. Whenever the engulfing candle happens to be inside the size (that's upper and low ATR area limits around EMA) and the engulfing candle has closed in the appropriate direction, the signal triangle comes up. To understand this...
The signal appears only if one of OHLC price point of engulfed and/or engulfing candles are within upper and lower ATR areas around EMA
When there is a bullish engulfing candle, and the close of the candle is above EMA, a green triangle comes up below the candle
When there is a bearish engulfing candle and the close of the candle is below EMA, a red triangle comes up above the candle
The settings enable you to set the following
Length of EMA (default is 200)
Length of ATR (default is 12)
Resolution of EMA independent of the chart timeframe (default is Daily)
Price type (default is hlc3)
Trade zone width in number of ATRs on either side of EMA (default is 1)
Other settings to adjust display
I have been using this in different timeframes to generate signals and found that it generates pretty good alpha.
Feel free to write to me if you have any ideas that can improve this further or if you wish to discuss how to properly use this.

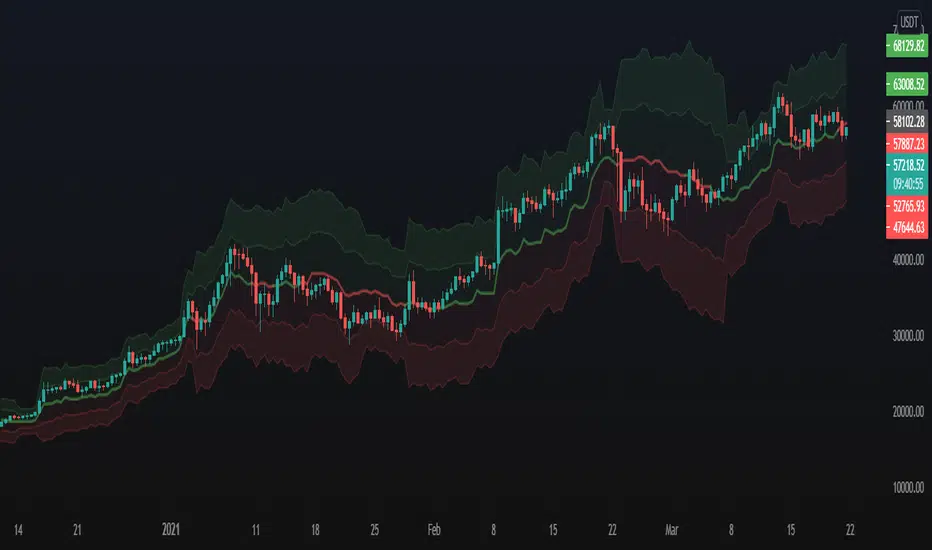
Probability Bands [Anan]Hello Friends,,,
===================================
This indicator is based on Bayes' Theorem and is fully based on probabilities.
===================================
Formula For Bayes' Theorem:
P(Bull|Bear) = P(Bear∣Bull) * P(Bull) / P(Bear)
where:
Bull and Bear are events and P is probability
P(Bull|Bear) is the posterior probability, the probability of Bull after taking into account Bear
P(Bear∣Bull) is the conditional probability or likelihood, the degree of belief in Bear given that proposition of Bull belief (Bull true)
P(Bull) is the prior probability, the probability of Bull belief
P(Bear) is the prior probability, the probability of Bear belief
===================================
The indicator output one trend lines and (Bull/Bear) Signal :
Bull/Bear Probability Trend :
when the price is above mid line ==> Up Trend
when the price is below mid line ==> Down Trend
And by using ATR deviation multipliers, we can get (Bullish/Bearish) zones
===================================
Disclaimer:
This script is for informational and educational purposes only.
Use of the script does not constitutes professional and/or financial advice.
You alone the sole responsibility of evaluating the script output and risks associated with the use of the script.
===================================
RogTrader Bull Bear StrengthsSimplified Bull/Bear Strengths Indicator uses price action, volume flow, and candlesticks to calculate bull and bear strengths, also known as buying and selling pressures.
Green/Red Volume Bars can be misleading at times
This indicator shows the net bull/bear power
Recommended to be used in combination with indicators to find reversal signals.
For example, during an uptrend, a long red bar indicates that strong selloff has started, and bears begin to control the bargains.

[blackcat] L2 Bull Bear Convergence Divergence (BBCD)Level: 2
Background
A bull market is gaining ground and is economically sound, while a bear market is declining and most stocks are depreciating. The actual origins of these terms are unclear, but one reason could be that bulls attack by pulling their horns up while bears attack by brushing their paws down.
Function
L2 Bull Bear Convergence Divergence (BBCD) disclose the convergence divergence of the bull bear as a market opinion indicator. It tells you the opinion of those who are directly involved with the markets. As a trader, understanding how the convergence divergence of the bull bear works can be of great help. I inherited the traditional MACD expression method, and added golden cross (yellow cross) and dead cross (fuchsia cross) prompts, as well as bottom divergence (lime cross) and top divergence (red cross) prompts.
Key Signal
bbd --> bull bear fast line
bbdsupport --> bull bear slow line and support level
bbdgx --> bull bear gold cross in yellow
bbddx --> bull bear dead cross in fuchsia
bbotdiverg --> bull bear bottom divergence alert in lime cross
btopdiverg --> bull bear top divergence alert in red cross
Pros and Cons
Pros:
1. it can help to see the strength change of a trend in time
2. visual bottom and top divergence alerts are provided
Cons:
1. it disclose the strength change better than price change
Remarks
Bull Bear Convergence Divergence (BBCD) is new.
Readme
In real life, I am a prolific inventor. I have successfully applied for more than 60 international and regional patents in the past 12 years. But in the past two years or so, I have tried to transfer my creativity to the development of trading strategies. Tradingview is the ideal platform for me. I am selecting and contributing some of the hundreds of scripts to publish in Tradingview community. Welcome everyone to interact with me to discuss these interesting pine scripts.
The scripts posted are categorized into 5 levels according to my efforts or manhours put into these works.
Level 1 : interesting script snippets or distinctive improvement from classic indicators or strategy. Level 1 scripts can usually appear in more complex indicators as a function module or element.
Level 2 : composite indicator/strategy. By selecting or combining several independent or dependent functions or sub indicators in proper way, the composite script exhibits a resonance phenomenon which can filter out noise or fake trading signal to enhance trading confidence level.
Level 3 : comprehensive indicator/strategy. They are simple trading systems based on my strategies. They are commonly containing several or all of entry signal, close signal, stop loss, take profit, re-entry, risk management, and position sizing techniques. Even some interesting fundamental and mass psychological aspects are incorporated.
Level 4 : script snippets or functions that do not disclose source code. Interesting element that can reveal market laws and work as raw material for indicators and strategies. If you find Level 1~2 scripts are helpful, Level 4 is a private version that took me far more efforts to develop.
Level 5 : indicator/strategy that do not disclose source code. private version of Level 3 script with my accumulated script processing skills or a large number of custom functions. I had a private function library built in past two years. Level 5 scripts use many of them to achieve private trading strategy.
