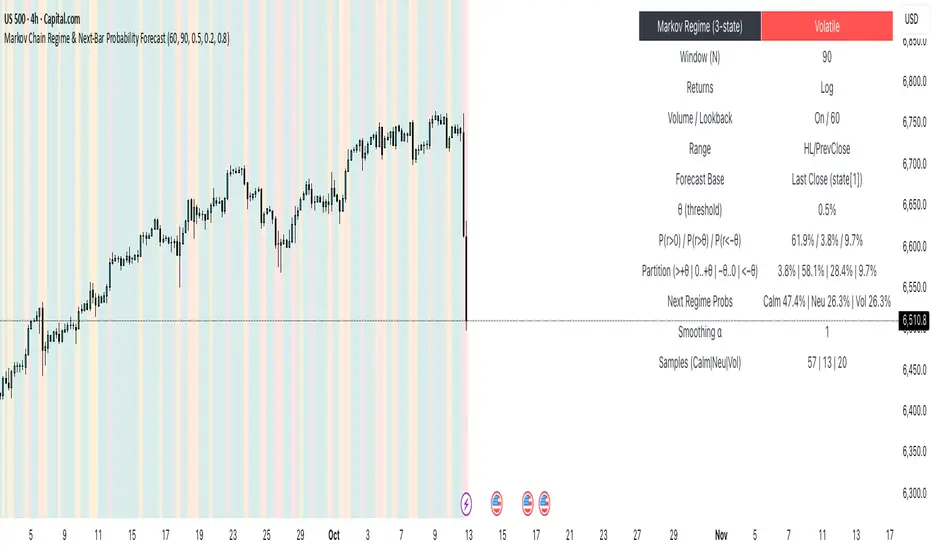
Markov Chain Regime & Next‑Bar Probability Forecast✨ What it is
A regime-aware, math-driven panel that forecasts the odds for the very next candle. It shows:
• P(next r > 0)
• P(next r > +θ)
• P(next r < −θ)
• A 4-bucket split of next-bar outcomes (>+θ | 0..+θ | −θ..0 | <−θ)
• Next-regime probabilities: Calm | Neutral | Volatile
🧠 Why the math is strong
• Markov regimes: Markets cluster in volatility “moods.” We learn a 3-state regime S∈{Calm, Neutral, Volatile} with a transition matrix A, where A = P(Sₜ₊₁=j | Sₜ=i).
• Condition on the future state: We estimate event odds given the next regime j—
q_pos(j)=P(rₜ₊₁>0 | Sₜ₊₁=j), q_gt(j)=P(rₜ₊₁>+θ | Sₜ₊₁=j), q_lt(j)=P(rₜ₊₁<−θ | Sₜ₊₁=j)—
and mix them with transitions from the current (or frozen) state sNow:
P(event) = Σⱼ A · q(event | j).
This mixture-of-regimes view (HMM-style one-step prediction) ties next-bar outcomes to where volatility is likely headed.
• Statistical hygiene: Laplace/Beta smoothing, minimum-sample gating, and unconditional fallbacks keep estimates stable. Heavy computations run on confirmed bars; “Freeze at close” avoids intrabar flicker.
📊 What each value means
• Regime label & background: 🟩 Calm, 🟧 Neutral, 🟥 Volatile — quick read of market context.
• P(next r > 0): Directional tilt for the very next bar.
• P(next r > +θ): Odds of an outsized positive move beyond θ.
• P(next r < −θ): Odds of an outsized negative move beyond −θ.
• Partition row: Distributes next-bar probability across four intuitive buckets; they ≈ sum to 100%.
• Next Regime Probs: Likelihood of switching to Calm/Neutral/Volatile on the next bar (row of A for the current/frozen state).
• Samples row: How many next-bar samples support each next-state estimate (a confidence cue).
• Smoothing α: The Laplace prior used to stabilize binary event rates.
⚙️ Inputs you control
• Returns: Log (default) or %
• Include Volume (z-score) + lookback
• Include Range (HL/PrevClose)
• Rolling window N (transitions & estimates)
• θ as percent (e.g., 0.5%)
• Freeze forecast at last close (recommended)
• Display toggles (plots, partition, samples)
🎯 How to use it
• Volatility awareness & sizing: Rising P(next regime = Volatile) → consider smaller size, wider stops, or skipping marginal entries.
• Breakout preparation: Elevated P(next r > +θ) highlights environments where range expansion is more likely; pair with your setup/trigger.
• Defense for mean-reversion: If P(next r < −θ) lifts while you’re late long (or P(next r > +θ) lifts while late short), tighten risk or wait for better context.
• Calibration tip: Start θ near your market’s typical bar size; adjust until “>+θ” flags truly meaningful moves for your timeframe.
📝 Method notes & limits
Activity features (|r|, volume z, range) are standardized; only positive z’s feed the composite activity score. Estimates adapt to instrument/timeframe; rare regimes or small windows increase variance (hence smoothing, sample gating, fallbacks). This is a context/forecast tool, not a standalone signal—combine with your entry/exit rules and risk management.
🧩 Strategies too
We also develop full strategy versions that use these probabilities for entries, filters, and position sizing. Like this publication if you’d like us to release the strategy edition next.
⚠️ Disclaimer
Educational use only. Not financial advice. Markets involve risk. Past performance does not guarantee future results.
在腳本中搜尋"binary"
Ultimate Stock Trend & Liquidity Screener1. Overview & Originality
This script is a comprehensive, all-in-one screening tool designed to identify high-quality, trend-following opportunities in global stock markets. Its originality lies in combining seven distinct logical checks—spanning liquidity, trend, momentum, and volatility—into a single, cohesive framework.
www.tradingview.com
The script's core innovation is its "Total Score" system. This feature moves beyond simple binary filtering by quantifying how well a stock meets the ideal criteria for a tradable trend. This allows you to rank entire watchlists to find the most promising candidates, not just the ones that meet a minimum threshold.
Designed for full integration with the TradingView ecosystem, the script outputs all individual conditions and the Total Score as separate columns in the Pine Screener, enabling deep and flexible market analysis.
2. Core Concepts & How It Works
Built on the classic principles of trend-following, this screener validates potential trades against a robust checklist. The default parameters are tuned for stock market analysis, using standard lookback periods like the 50 and 200-day moving averages.
The script systematically checks for:
Liquidity: Guarantees the stock is actively traded by filtering for minimum daily dollar volume (turnover) and a healthy 30-day average volume, which is critical for good execution.
Trend Confirmation: Employs the classic 50/200 Simple Moving Average "golden cross" structure to confirm a healthy, long-term uptrend.
Trend Quality: Includes an optional filter to verify that the long-term 200-day SMA is actively sloping upwards, ensuring the underlying trend has momentum.
Trend Strength: Uses the Average Directional Index (ADX) to filter out weak or sideways markets, focusing only on stocks in a strong, established trend.
Momentum: Confirms the trend is supported by sustained buying pressure by checking that the Relative Strength Index (RSI) is in a bullish regime (above 50).
Volatility: Requires a minimum level of volatility using the Average True Range (ATR) as a percentage of the price, ensuring the stock has enough movement to be tradable.
Strategic Entry: Offers a user-selectable "Entry Mode" to fit different trading styles:
Breakout Mode: Identifies stocks hitting new highs on a surge of volume.
Pullback Mode: Finds stocks already in a strong uptrend that are experiencing a healthy dip to a short-term moving average.
3. How to Use This Script
This indicator is designed for two primary workflows:
Single-Stock Analysis: Apply the script to any stock chart to see a detailed diagnostic table in the bottom-right corner. This table provides a real-time checklist for all 7 conditions and the Total Score.
Full Market Screening (Recommended):
Open the Stock Screener on TradingView.
Click "Filters" and select this script from the Pine Screener menu.
Click the "Columns" button and add the new columns generated by this script ("Total Score," "Liquidity OK," etc.).
You can now sort your entire watchlist by "Total Score" to find the best candidates or filter for stocks that meet a minimum score (e.g., Total Score > 5 ).
4. Inputs & Customization
All parameters are fully customizable in the script's "Settings" menu. You can easily adjust moving average lengths, thresholds, and lookback periods to tailor the screener to your specific strategy, timeframe, or market.
5. Disclaimer
This tool is for educational and analytical purposes only. It is not financial advice and does not guarantee any specific outcome or profit. Past performance is not indicative of future results. Always use this screener as part of a complete trading plan that includes your own analysis and risk management.

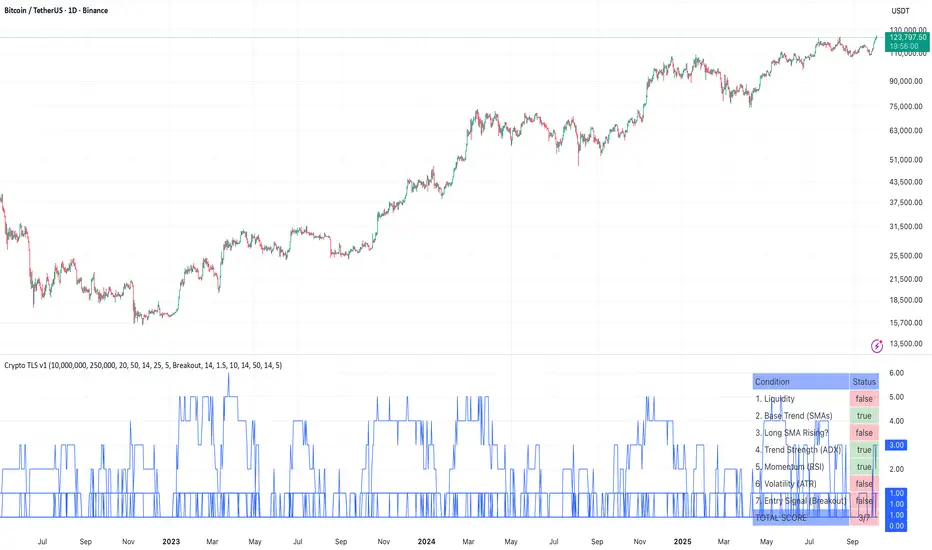
Ultimate Crypto Trend & Liquidity Screener v11. Overview & Originality
This script is an advanced, all-in-one screening tool designed specifically to identify high-potential, trend-following opportunities within the cryptocurrency market. While many screeners focus on single conditions, the "Ultimate Crypto Trend & Liquidity Screener" is original in its multi-layered approach, combining seven distinct logical checks into a single, cohesive framework.
Its primary innovation is the calculation of a "Total Score," which quantifies how well an asset conforms to the ideal characteristics of a tradable trend. This allows traders to move beyond simple binary (yes/no) filtering and instead rank the entire market to find the absolute best candidates that match their strategy.
The script is fully compatible with the TradingView Pine Screener, outputting each individual condition and the Total Score as separate columns for powerful, flexible market analysis.
2. Core Concepts & How It Works
This screener is built on the core principles of classic trend-following. It evaluates assets against a comprehensive checklist to ensure they are not only trending, but are also liquid, volatile, and at a strategic entry point.
The script systematically checks for:
Liquidity: Ensures the asset is actively traded with significant dollar volume, which is crucial for minimizing slippage. It checks both the daily turnover and the 30-day average volume.
Trend Confirmation: Utilizes a dual-moving average system (20/50 SMA default) to confirm the underlying trend direction. It also includes an optional filter to ensure the long-term moving average is actively sloping upwards, confirming trend health.
Trend Strength: Employs the Average Directional Index (ADX) to measure the strength of the trend, filtering out weak or choppy price action.
Momentum: Uses the Relative Strength Index (RSI) to confirm that the asset has positive momentum, as strong trends are supported by sustained buying pressure.
Volatility: Measures volatility using the Average True Range (ATR) as a percentage of the price. This ensures the asset has enough movement to be profitable, a key factor in the 24/7 crypto market.
Strategic Entry: Offers a user-selectable "Entry Mode." You can choose between:
Breakout Mode: Identifies assets breaking out to new highs on a surge of volume.
Pullback Mode: Identifies assets already in a strong uptrend that are experiencing a healthy dip to a key moving average, offering a potentially better risk/reward entry.
3. How to Use This Script
This indicator is designed for two primary workflows:
Single-Asset Analysis: When you apply the script to any crypto chart, a detailed diagnostic table will appear in the bottom-right corner. This table provides a real-time checklist, showing true or false for each of the 7 conditions and the final score, allowing for a quick and deep analysis of any individual asset.
Full Market Screening (Recommended):
Open the Crypto Screener on TradingView.
Click the "Filters" button and at the bottom of the menu, select this script ("Ultimate Crypto Trend & Liquidity Screener").
Click the "Columns" button on the screener and add the columns generated by this script, such as "Total Score," "Liquidity OK," "Entry Signal OK," etc.
You can now sort the entire crypto market by "Total Score" to instantly find the strongest candidates, or filter for assets that meet specific conditions (e.g., Total Score > 5 ).
4. Inputs & Customization
All parameters within this script are fully customizable via the "Settings" menu. The default values have been tuned for general use in the crypto market (e.g., faster moving averages, higher volatility thresholds), but you are encouraged to adjust them to fit your specific trading style, preferred timeframes, and risk tolerance.
5. Disclaimer
This tool is designed for educational and analytical purposes to aid in the decision-making process. It does not provide financial advice or guarantee trading success. Past performance is not indicative of future results. Always use this screener in conjunction with your own comprehensive analysis and robust risk management practices. This script is published open-source to encourage community learning and collaboration.
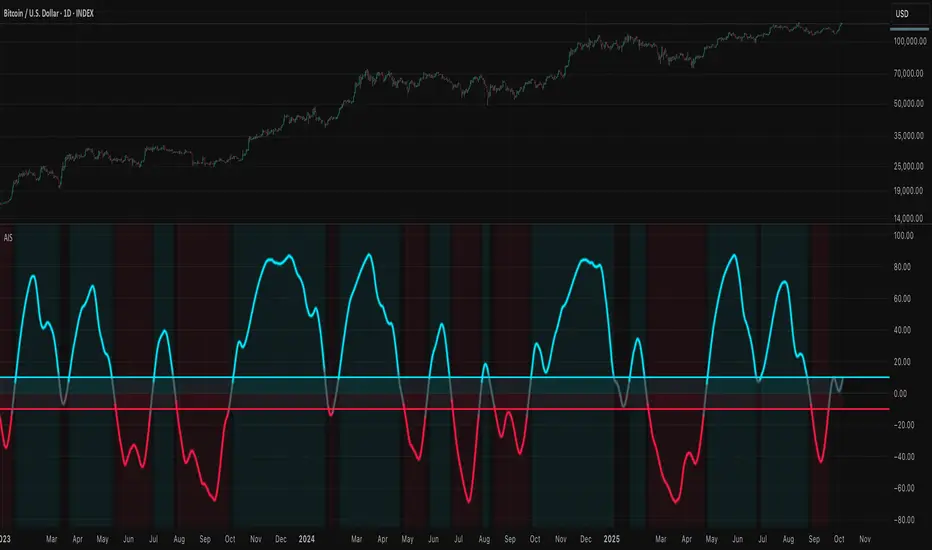
Aggregation Index SmoothedAggregation Index Smoothed (AIS) - Multi-Method Trend Consensus Oscillator
What This Indicator Does
The Aggregation Index Smoothed combines four independent trend-detection methodologies into a unified momentum oscillator that operates across multiple timeframes simultaneously. Unlike traditional single-method indicators that can produce conflicting or false signals during market transitions, AIS requires consensus agreement across all four calculation methods before confirming trend direction.
Technical Methodology
Four-Component Loop System
Each component analyzes 16 different lookback periods (default range: 5-20 bars), creating a multi-timeframe perspective within a single calculation:
1. Price Change Analysis
Measures directional price movement across all periods. Each period scores +1 for positive change or -1 for negative change. Results are averaged and scaled to ±100.
2. RSI Multi-Period Analysis
Evaluates Relative Strength Index values across the same 16 periods. Scores +1 when RSI > 50 (momentum favoring bulls) or -1 when RSI < 50 (momentum favoring bears). This captures overbought/oversold conditions across multiple timeframes.
3. EMA Trend Position
Compares current price against Exponential Moving Averages of varying lengths (5-20 periods). Scores +1 when price trades above EMA (uptrend) or -1 when below (downtrend). This identifies trend alignment across short, medium, and longer-term moving averages.
4. Momentum Rate-of-Change
Calculates price momentum across all periods using the mom() function. Scores +1 for positive momentum or -1 for negative momentum, detecting acceleration and deceleration patterns.
Aggregation Process
Each of the four indicators independently calculates scores across all 16 periods
Individual indicator scores are averaged (range: -100 to +100)
All four indicator averages are combined using arithmetic mean
The resulting index undergoes EMA smoothing (default: 20 periods)
Optional double-smoothing applies a second EMA pass for maximum noise reduction
Why This Approach Is Unique
Problem Solved: Traditional oscillators often conflict - RSI might be bullish while MACD is bearish, or stochastic shows oversold while price trend is clearly down. Traders waste time reconciling these contradictions.
Solution: AIS eliminates conflicts by design. A bullish signal (+10 threshold) means all four methods across all 16 timeframes agree on upward momentum. This consensus approach dramatically reduces whipsaws and false signals compared to using any single method.
Technical Advantage: The for-loop methodology validates each signal across a spectrum of timeframes (5 bars through 20 bars), ensuring the trend is confirmed in both immediate-term and intermediate-term contexts. This is mathematically equivalent to running 64 separate indicators (4 methods × 16 periods) and requiring majority agreement.
Signal Generation
Long Signal (Bullish): Index crosses above +10 threshold
Indicates all four methods confirm upward momentum across multiple timeframes
Sustained readings above +10 suggest strong trend continuation
Short Signal (Bearish): Index crosses below -10 threshold
Indicates all four methods confirm downward momentum across multiple timeframes
Sustained readings below -10 suggest strong downtrend
Neutral Zone (-10 to +10): Mixed signals or consolidation
Methods disagree on direction, suggesting choppy or range-bound conditions
Avoid trend-following strategies in this zone
How to Use This Indicator
Best Practices
Timeframe Selection:
Most effective on 4-hour charts and higher (Daily, Weekly)
Lower timeframes (1H, 15m) may produce excessive signals despite smoothing
The 16-period loop range is optimized for swing trading timeframes
Entry Strategy:
Wait for index to cross threshold levels (±10)
Confirm with price action (breakout, support/resistance levels)
Consider entering on first pullback after threshold cross for better risk/reward
Parameter Adjustment:
Volatile instruments (crypto, small-caps): Increase thresholds to ±15 or ±20 to filter noise
Stable instruments (large-cap stocks, indices): Reduce thresholds to ±5 for earlier signals
Smoothing Length: Increase to 30+ for cleaner signals; decrease to 10-15 for faster response
Double Smoothing: Keep enabled for trend following; disable for more reactive signals
Risk Management:
Exit longs when index drops back into neutral zone (below +10)
Exit shorts when index rises into neutral zone (above -10)
Use index slope as trend strength indicator (steeper = stronger)
Interpretation Guidelines
Strong Trending Conditions:
Index sustained above +50 or below -50 indicates powerful directional move
All four methods showing extreme agreement across all timeframes
High probability of trend continuation
Trend Exhaustion Signals:
Index reaches extreme levels (+80 to +100 or -80 to -100)
Potential reversal zone; watch for divergence with price
Consider taking partial profits on existing positions
Divergence Detection:
Price makes new highs while index fails to confirm = bearish divergence
Price makes new lows while index shows higher lows = bullish divergence
Divergences on 4H+ timeframes carry significant weight
Limitations and Considerations
Not Suitable For:
Scalping or very short-term trading (under 1-hour timeframes)
Range-bound markets with no clear trend (index oscillates in neutral zone)
Instruments with erratic, news-driven price action
Known Lag:
Double smoothing introduces 40+ bar delay in signal generation
Designed for trend confirmation, not early trend detection
Fast market reversals may produce late exit signals
Complementary Tools:
Combine with support/resistance levels for entry precision
Use with volume analysis to confirm signal strength
Pair with volatility indicators (ATR) for position sizing
Technical Implementation Notes
The indicator pre-calculates all RSI and EMA values for lengths 5-20 to comply with Pine Script's requirement for constant-length parameters in ta.rsi() and ta.ema() functions. This workaround allows dynamic loop-based analysis while maintaining calculation consistency on every bar.
The scoring methodology uses binary classification (+1/-1) rather than normalized percentage values to ensure equal weighting across all four methods, preventing any single indicator from dominating the aggregate signal.
Summary: The Aggregation Index Smoothed provides trend confirmation through multi-method consensus across variable timeframes. Its primary value is eliminating the confusion of conflicting indicator signals by requiring agreement from four independent trend calculations before generating actionable signals. Best suited for swing traders and position traders on 4-hour and higher timeframes seeking high-probability trend-following entries with reduced false signals.
Aggregated Scores Oscillator [Alpha Extract]A sophisticated risk-adjusted performance measurement system that combines Omega Ratio and Sortino Ratio methodologies to create a comprehensive market assessment oscillator. Utilizing advanced statistical band calculations with expanding and rolling window analysis, this indicator delivers institutional-grade overbought/oversold detection based on risk-adjusted returns rather than traditional price movements. The system's dual-ratio aggregation approach provides superior signal accuracy by incorporating both upside potential and downside risk metrics with dynamic threshold adaptation for varying market conditions.
🔶 Advanced Statistical Framework
Implements dual statistical methodologies using expanding and rolling window calculations to create adaptive threshold bands that evolve with market conditions. The system calculates cumulative statistics alongside rolling averages to provide both historical context and current market regime sensitivity with configurable window parameters for optimal performance across timeframes.
🔶 Dual Ratio Integration System
Combines Omega Ratio analysis measuring excess returns versus deficit returns with Sortino Ratio calculations focusing on downside deviation for comprehensive risk-adjusted performance assessment. The system applies configurable smoothing to both ratios before aggregation, ensuring stable signal generation while maintaining sensitivity to regime changes.
// Omega Ratio Calculation
Excess_Return = sum((Daily_Return > Target_Return ? Daily_Return - Target_Return : 0), Period)
Deficit_Return = sum((Daily_Return < Target_Return ? Target_Return - Daily_Return : 0), Period)
Omega_Ratio = Deficit_Return ≠ 0 ? (Excess_Return / Deficit_Return) : na
// Sortino Ratio Framework
Downside_Deviation = sqrt(sum((Daily_Return < Target_Return ? (Daily_Return - Target_Return)² : 0), Period) / Period)
Sortino_Ratio = (Mean_Return / Downside_Deviation) * sqrt(Annualization_Factor)
// Aggregated Score
Aggregated_Score = SMA(Omega_Ratio, Omega_SMA) + SMA(Sortino_Ratio, Sortino_SMA)
🔶 Dynamic Band Calculation Engine
Features sophisticated threshold determination using both expanding historical statistics and rolling window analysis to create adaptive overbought/oversold levels. The system incorporates configurable multipliers and sensitivity adjustments to optimize signal timing across varying market volatility conditions with automatic band convergence logic.
🔶 Signal Generation Framework
Generates overbought conditions when aggregated score exceeds adjusted upper threshold and oversold conditions below lower threshold, with neutral zone identification for range-bound markets. The system provides clear binary signal states with background zone highlighting and dynamic oscillator coloring for intuitive market condition assessment.
🔶 Enhanced Visual Architecture
Provides modern dark theme visualization with neon color scheme, dynamic oscillator line coloring based on signal states, and gradient band fills for comprehensive market condition visualization. The system includes zero-line reference, statistical band plots, and background zone highlighting with configurable transparency levels.
snapshot
🔶 Risk-Adjusted Performance Analysis
Utilizes target return parameters for customizable risk assessment baselines, enabling traders to evaluate performance relative to specific return objectives. The system's focus on downside deviation through Sortino analysis provides superior risk-adjusted signals compared to traditional volatility-based oscillators that treat upside and downside movements equally.
🔶 Multi-Timeframe Adaptability
Features configurable calculation periods and rolling windows to optimize performance across various timeframes from intraday to long-term analysis. The system's statistical foundation ensures consistent signal quality regardless of timeframe selection while maintaining sensitivity to market regime changes through adaptive band calculations.
🔶 Performance Optimization Framework
Implements efficient statistical calculations with optimized variable management and configurable smoothing parameters to balance responsiveness with signal stability. The system includes automatic band adjustment mechanisms and rolling window management for consistent performance across extended analysis periods.
This indicator delivers sophisticated risk-adjusted market analysis by combining proven statistical ratios in a unified oscillator framework. Unlike traditional overbought/oversold indicators that rely solely on price movements, the ASO incorporates risk-adjusted performance metrics to identify genuine market extremes based on return quality rather than price volatility alone. The system's adaptive statistical bands and dual-ratio methodology provide institutional-grade signal accuracy suitable for systematic trading approaches across cryptocurrency, forex, and equity markets with comprehensive visual feedback and configurable risk parameters for optimal strategy integration.

MACD-V+MACD-V+ Indicator - Advanced Momentum Analysis
The MACD-V+ indicator is an enhanced version of the volatility-normalized MACD methodology developed by Alex Spiroglou. This approach addresses critical limitations of traditional MACD through ATR-based volatility normalization, providing comparable values across time and markets.
What is MACD-V?
MACD-V applies Average True Range (ATR) normalization to traditional MACD, creating a universal momentum indicator that works consistently across all markets and timeframes. The methodology was developed through extensive statistical research analyzing multiple markets and timeframes.
Formula: × 100
This normalization transforms MACD from price-dependent values into standardized momentum readings.
Traditional MACD Limitations
Limitation 1: Non-Comparable Values Across Time
Traditional MACD values cannot be compared across different time periods due to varying price levels. S&P 500 maximum MACD was 1.56 in 1957-1971, but reached 86.31 in 2019-2021 - not indicating 55x stronger momentum, but simply different price scales.
Solution: MACD-V provides comparable historical values where a reading of 100 today has the same mathematical meaning as 100 in any previous period.
Limitation 2: Non-Comparable Across Markets
Traditional MACD cannot compare momentum between different assets. S&P 500 MACD of 65 versus EUR/USD MACD of -0.5 reflects price differences, not relative strength.
Solution: MACD-V creates universal levels that work across all markets. The ±150 extreme levels apply consistently whether analyzing stocks, bonds, commodities, or currencies.
Limitation 3: No Objective Momentum System
Traditional MACD lacks universal overbought or oversold level definitions, making systematic analysis difficult.
Solution: MACD-V provides an objective 7-stage momentum lifecycle system with clearly defined zones and state transitions.
Limitation 4: Signal Line False Signals
In low momentum environments, traditional MACD generates multiple false signals as the line oscillates near zero.
Solution: MACD-V filters signal quality by identifying neutral zones (-50 to +50) where signal reliability is lower.
Limitation 5: Signal Line Timing Lag
During extreme momentum, traditional MACD signal line lags significantly due to large separation from the MACD line.
Solution: MACD-V anticipates timing issues in extreme momentum environments (±150) through zone-based analysis and lifecycle states.
Universal Application
MACD-V+ works across:
Individual Stocks
Forex Pairs
Commodity Futures
Cryptocurrencies
All Timeframes
Key Features
Zone System
Overbought Zone: Above +150 (extreme bullish momentum)
Rally Zone: +50 to +150 (strong bullish momentum)
Ranging Zone: -50 to +50 (neutral/low momentum)
Rebound Zone: -50 to -150 (strong bearish momentum)
Oversold Zone: Below -150 (extreme bearish momentum)
7-Stage Lifecycle States
Ranging: Neutral momentum in -50 to +50 zone
Rallying: Rally zone + MACD above Signal + rising momentum
Overbought: Extreme zone above +150
Retracing: Rally zone + MACD below Signal (pullback from overbought)
Reversing: Rebound zone + MACD below Signal + falling momentum
Oversold: Extreme zone below -150
Rebounding: Rebound zone + MACD above Signal (recovery from oversold)
Visual Status Display
Real-Time State Table: Shows current lifecycle state name
Color-Coded States: Blue (Rallying/Rebounding), Red (Overbought/Oversold), Orange (Retracing/Reversing), Gray (Ranging)
Strength Multiplier: Live histogram strength indicator (e.g., "x 1.45")
Enhanced Features (Plus)
Absolute Histogram MA: ATR-length moving average of absolute histogram values for strength measurement
Direction-Aware Display: MA line follows histogram sign (positive above 0, negative below 0)
Strength Multiplier: Current momentum vs. average strength ratio (always positive value)
Histogram Extreme Levels: Short-term overbought/oversold (±40) for pullback detection
Chart Legend - Visual Signal Guide
Lines and Histogram
🔵 Blue Line: MACD-V value (ATR-normalized momentum)
🟠 Orange Line: Signal line (9-period EMA of MACD-V)
📊 Histogram Bars: MACD-V minus Signal line (momentum differential)
Histogram Colors: Green shades (positive momentum), Red shades (negative momentum)
🟡 Yellow Line: Dynamic MA of absolute histogram values (follows histogram sign)
Background Colors
🟥 Light Red Background: Extreme overbought zone (MACD-V > +150)
🟩 Light Green Background: Extreme oversold zone (MACD-V < -150)
Horizontal Reference Lines
➖ +150 (Gray Dashed): Overbought extreme level
➖ +50 (Gray Dashed): Rally zone entry level
➖ 0 (Gray Solid): Zero line - trend separator
➖ -50 (Gray Dashed): Rebound zone entry level
➖ -150 (Gray Dashed): Oversold extreme level
Optional Histogram Levels
➖ +40 (Yellow Dashed): Histogram short-term overbought
➖ -40 (Yellow Dashed): Histogram short-term oversold
Status Table
📋 Top-Center Table: Current lifecycle state display
State Name: RANGING / RALLYING / OVERBOUGHT / RETRACING / REVERSING / OVERSOLD / REBOUNDING
Histogram Warning: Short-term overbought/oversold alerts (±40 levels)
State Label
📊 Label at MACD/Signal Midpoint: Current lifecycle state with strength analysis
State Name: RANGING / RALLYING / OVERBOUGHT / RETRACING / REVERSING / OVERSOLD / REBOUNDING
Strength Multiplier Interpretation:
- Strong acceleration (>1.75): Powerful momentum, trend continuation likely
- Moderate progression (1.25-1.75): Normal trend strength
- Trend continuation (0.75-1.25): Stable momentum near average
- Watch for reversal (0.25-0.75): Weakening momentum
- Trend exhaustion (<0.25): Very weak momentum, reversal possible
Trading Applications
1. Lifecycle State Trading
Enter Long: When state changes to "RALLYING" (strong bullish momentum established)
Enter Short: When state changes to "REVERSING" (strong bearish momentum established)
Exit/Reduce: When state reaches "OVERBOUGHT" or "OVERSOLD" (extreme levels)
Avoid Trading: When state is "RANGING" (low momentum, unreliable signals)
2. Zone-Based Trading
Rally Zone (+50 to +150): Look for pullback entries (histogram dips)
Rebound Zone (-50 to -150): Look for bounce entries (histogram rises)
Extreme Zones (±150+): Prepare for reversal or take profits
Ranging Zone (-50 to +50): Wait for breakout confirmation
3. Signal Line Crossovers
Bullish Cross: MACD-V crosses above Signal line (momentum shift up)
Bearish Cross: MACD-V crosses below Signal line (momentum shift down)
Quality Filter: Trust crossovers in Rally/Rebound zones, ignore in Ranging zone
4. Zero Line Crosses
Cross Above 0: Transition to bullish regime
Cross Below 0: Transition to bearish regime
Trend Confirmation: Strong trends keep MACD-V on same side of zero
5. Histogram Extreme Strategy
Above +40: Short-term overbought - potential pullback
Below -40: Short-term oversold - potential bounce
Use with Trend: Buy dips to -40 in uptrend, sell rallies to +40 in downtrend
6. Strength Multiplier Analysis
> 1.75: Strong acceleration - powerful momentum, trend continuation highly likely
1.25 to 1.75: Moderate progression - normal healthy trend strength
0.75 to 1.25: Trend continuation - stable momentum near average strength
0.25 to 0.75: Watch for reversal - momentum weakening significantly
< 0.25: Trend exhaustion - very weak momentum, reversal possible
Comprehensive Alert System
Lifecycle State Change Alerts
Range Entered (low momentum warning)
Rally Started (bullish momentum established)
Overbought Reached (extreme bullish level)
Overbought Exit (leaving extreme zone)
Retracing Started (pullback from overbought)
Reversal Started (bearish momentum established)
Oversold Reached (extreme bearish level)
Oversold Exit (leaving extreme zone)
Rebounding Started (recovery from oversold)
Alert Builder Integration
Binary outputs (1/0) for external alert systems:
Individual state flags for each of 7 lifecycle states
Strength multiplier value for programmatic trend assessment
Settings & Parameters
MACD Configuration
MACD Fast: Fast EMA period (default: 12)
MACD Slow: Slow EMA period (default: 26)
Signal Line: Signal smoothing period (default: 9)
Source: Price source (default: Close)
Zone Boundaries
Overbought: Extreme bullish level (default: 150)
Oversold: Extreme bearish level (default: -150)
Rally: Strong bullish zone entry (default: 50)
Rebound: Strong bearish zone entry (default: -50)
Histogram Bounds
Histogram OB: Short-term overbought (default: 40)
Histogram OS: Short-term oversold (default: -40)
Trend Filters
MA Type: Histogram strength MA calculation method (None / SMA / EMA)
Show Elder Impulse Plus: Bar color system based on EMA(13) + histogram direction
200 EMA trend: Trend Filter v1 - Bull/Bear classification (adaptive MACD-V levels)
50/200 EMA 6-stage: Trend Filter v2 - Chuck Dukas Diamond 6-stage market classification
Best Practices
Trending Markets
Focus on "RALLYING" or "REVERSING" states for entries
Use histogram pullbacks (±40) for position additions
Monitor strength multiplier - exit if drops below 0.25
Take profits in extreme zones (±150+)
Yellow MA crossing histogram warns of momentum shift
Ranging Markets
Avoid trading when state is "RANGING"
Wait for clear zone entry (Rally/Rebound zone)
Use shorter timeframes for precision
Reduce position sizes due to lower reliability
Multi-Timeframe Analysis
Higher timeframe: Identify market regime (lifecycle state)
Lower timeframe: Time precise entries (histogram pullbacks)
Alignment: Trade only when both timeframes agree on direction
Risk Management
Reduce position size in extreme zones (±150+)
Use lifecycle state changes for stop-loss placement
Scale out of positions when strength multiplier < 0.25
Avoid counter-trend trades in strong states (RALLYING/REVERSING)
Watch yellow MA - when it crosses below histogram absolute value, momentum weakening
Combining with LBR 3/10-V Indicator
MACD-V+ and LBR 3/10-V create a powerful two-timeframe momentum system for strategic direction and tactical timing.
Strategic Filter: MACD-V+ determines WHETHER to trade (market regime)
Tactical Precision: LBR 3/10-V determines WHEN to enter (timing)
Double Confirmation: Both indicators must agree on direction
Lifecycle Management: Exit when MACD-V+ state changes
Strength Validation: Use MACD-V+ multiplier for position sizing
Extreme Respect: Both hitting extremes = high reversal probability
Methodology
MACD-V methodology is based on volatility normalization using Average True Range (ATR). This approach transforms traditional MACD into a universal momentum indicator with statistically-validated zones and objectively-defined states.
The indicator implements:
ATR-based normalization for cross-market comparability
Statistical analysis for universal zone definitions (±150, ±50)
Lifecycle state system for objective trend identification
Absolute histogram MA with direction-aware visualization (ATR-length period)
Strength multiplier: ratio of current to average absolute momentum (always positive)
Dynamic status table adapting to active trend filters
MACD-V+ transforms momentum analysis from subjective interpretation into objective, quantifiable measurements. Combined with LBR 3/10-V for tactical timing, it provides a complete framework for systematic trading across all financial markets and timeframes.
This indicator is designed for educational and analytical purposes. Past performance does not guarantee future results. Always conduct thorough research and consider consulting with financial professionals before making investment decisions.

SEVENX|SuperFundedSEVENX — Modular Multi-Signal Scanner (SuperFunded)
What it is
SEVENX combines seven classic signals—MACD, OBV, RSI, Stochastics, CCI, Momentum, and an optional ATR volatility filter—into a modular gate. You can toggle each condition on/off, and a BUY/SELL arrow prints only when all enabled conditions agree. Text labels are optional.
Why this is not a simple mashup
・Most “combo” scripts just overlay indicators. SEVENX is a strict consensus engine:
・Each condition is binary and user-switchable.
・The final signal is the logical AND of all enabled checks (no hidden weights).
・Signals fire only on confirmed events (e.g., RSI crossing a level, Stoch K/D cross), which makes entries rule-driven and reproducible.
This yields a transparent, vendor-grade workflow where traders can start simple (2–3 gates) and tighten selectivity by enabling more gates.
How it works (concise)
・MACD: macd_line > signal_line (buy) / < (sell).
・OBV trend: OBV > OBV_MA (buy) / < (sell).
・RSI bounce/drop: crossover(RSI, Oversold) (buy) / crossunder(RSI, Overbought) (sell).
・Stoch cross: %K crosses above %D (buy) / below (sell).
・CCI rebound/pullback: crossover(CCI, -Level) (buy) / crossunder(CCI, +Level) (sell).
・Momentum: Momentum > 0 (buy) / < 0 (sell).
・ATR filter (optional): ATR > ATR_MA must also be true (both sides).
・Final signal: AND of all enabled conditions. If you enable none on a side, that side will not print.
Parameters (UI mapping)
Buy Signal (group: “— Buy Signal —”)
・MACD Golden Cross / OBV Uptrend / RSI Bounce from Oversold / Stochastic Golden Cross / CCI Rebound from Oversold / Momentum > 0 / ATR Volatility Filter (on/off)
Sell Signal (group: “— Sell Signal —”)
・MACD Dead Cross / OBV Downtrend / RSI Drop from Overbought / Stochastic Dead Cross / CCI Pullback from Overbought / Momentum < 0 / ATR Volatility Filter (on/off)
Indicator Settings
・MACD: Fast/Slow/Signal lengths.
・RSI: Length, Overbought/Oversold levels.
・Stochastics: %K length, %D smoothing, overall smoothing.
・CCI: Length, Level (±Level used).
・Momentum: Length.
・OBV: MA length for trend baseline.
・ATR: ATR length, ATR MA length (for the filter).
Display
・Show Text (BUY/SELL text on the markers), Buy/Sell Text Colors.
Practical usage
・Start simple: Enable 2 conditions (e.g., MACD + RSI). If signals are too frequent, add OBV or Momentum; if still frequent, enable ATR filter.
・Mean-reversion vs trend:
・For trend-following, prefer MACD/OBV/Momentum gates.
・For reversal bounces, add RSI/CCI gates and keep Stoch for timing.
・Tuning sensitivity:
・Raise RSI Oversold/Overbought thresholds to make bounces rarer.
・Increase ATR_MA length to smooth the volatility baseline.
・Risk first: Plan SL/TP independently (e.g., structure levels or R-multiples). SEVENX focuses on entry qualification, not exits.
Repainting & confirmation
Signals depend on cross events and are best treated on bar close. Intrabar flips can occur before a bar closes; for strict rules, confirm on closed bars in your strategy.
Disclaimer
No indicator can guarantee outcomes. News, liquidity, and spread conditions can invalidate signals. Trade responsibly and manage risk.
SuperFunded invite-only
To obtain access, please DM me on TradingView or use the link in my profile.
SEVENX — モジュラー型マルチシグナル・スキャナー(日本語)
概要
SEVENXは、MACD / OBV / RSI / ストキャス / CCI / モメンタム / ATRフィルターの7条件を個別オン・オフで制御し、有効化した条件がすべて満たされたときだけBUY/SELL矢印を表示する、合意(AND)型シグナルインジです。テキスト表示も任意。
独自性・新規性
・各条件はブラックボックスではなく明示的なブール判定で、最終シグナルは有効化した条件のAND。
・RSIのレベルクロスやStochのK/Dクロスなど、確定イベントで判定するため、再現性の高いルール運用が可能。少数条件から始めて、必要に応じて段階的に厳格化できます。
動作要点
・MACD:線がシグナル上/下。
・OBV:OBVがOBVのMAより上/下。
・RSI:RSIがOSを上抜け(買い)/OBを下抜け(売り)。
・Stoch:%Kが%Dを上抜け/下抜け。
・CCI:CCIが**−Levelを上抜け**(買い)/+Levelを下抜け(売り)。
・Momentum:0より上/下。
・ATRフィルター(任意):ATR > ATR_MA を満たすこと(買い/売り共通)。
・最終サイン:有効化した条件のAND。そのサイドで1つも有効化していなければサインは出ません。
実践ヒント
・まずは2条件(例:MACD+RSI)でテスト → 多すぎるならOBV/MomentumやATRフィルターを追加。
・トレンド重視:MACD/OBV/Momentumを主軸に。
・押し目・戻り目狙い:RSI/CCIを追加、Stochでタイミング調整。
・感度調整:RSIのOB/OSを広げる、ATR_MAを長くする等で厳しめに。
・出口は別設計:SL/TPは価格帯やR倍数などで管理を。
再描画と確定
確定足基準で判断すると安定します。足確定前はクロスが行き来することがあります。
免責
シグナルの機能は保証されません。イベントや流動性で無効化する場合があります。資金管理のうえ自己責任でご利用ください。
SuperFunded 招待専用スクリプト
このスクリプトはSuperFundedの参加者専用です。アクセスをご希望の方は、SuperFundedにご登録のメールアドレスから partner@superfunded.com 宛に、TradingViewの登録名をご送信ください。

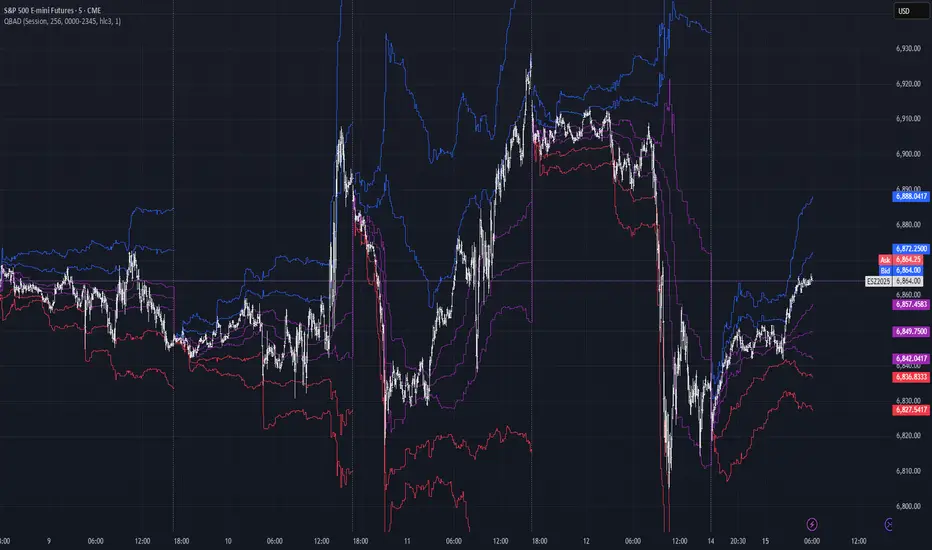
Quantile-Based Adaptive Detection🙏🏻 Dedicated to John Tukey. He invented the boxplot, and I finalized it.
QBAD (Quantile-Based Adaptive Detection) is ‘the’ adaptive (also optionally weighted = ready for timeseries) boxplot with more senseful fences. Instead of hardcoded multipliers for outer fences, I base em on a set of quantile-based asymmetry metrics (you can view it as an ‘algorithmic’ counter part of central & standardized moments). So outer bands are Not hardcoded, not optimized, not cross-validated etc, simply calculated at O(nlogn).
You can use it literally everywhere in any context with any continuous data, in any task that requires statistical control, novelty || outlier detection, without worrying and doubting the sense in arbitrary chosen thresholds. Obviously, given the robust nature of quantiles, it would fit best the cases where data has problems.
The thresholds are:
Basis: the model of the data (median in our case);
Deviations: represent typical spread around basis, together form “value” in general sense;
Extensions: estimate data’s extremums via combination of quantile-based asymmetry metrics without relying on actual blunt min and max, together form “range” / ”frame”. Datapoints outside the frame/range are novelties or outliers;
Limits: based also on quantile asymmetry metrics, estimate the bounds within which values can ‘ever’ emerge given the current data generating process stays the same, together form “field”. Datapoints outside the field are very rare, happen when a significant change/structural break happens in current data-generating process, or when a corrupt datapoint emerges.
…
The first part of the post is for locals xd, the second is for the wanderers/wizards/creators/:
First part:
In terms of markets, mostly u gotta worry about dem instruments that represent crypto & FX assets: it’s either activity hence data sources there are decentralized, or data is fishy.
For a higher algocomplexity cost O(nlong), unlike MBAD that is 0(n), this thing (a control system in fact) works better with ishy data (contaminated with wrong values, incomplete, missing values etc). Read about the “ breakdown point of an estimator ” if you wanna understand it.
Even with good data, in cases when you have multiple instruments that represent the same asset, e.g. CL and BRN futures, and for some reason you wanna skip constructing a proper index of em (while you should), QBAD should be better put on each instrument individually.
Another reason to use this algo-based rather than math-based tool, might be in cases when data quality is all good, but the actual causal processes that generate the data are a bit inconsistent and/or possess ‘increased’ activity in a way. SO in high volatility periods, this tool should provide better.
In terms of built-ins you got 2 weightings: by sequence and by inferred volume delta. The former should be ‘On’ all the time when you work with timeseries, unless for a reason you want to consciously turn it off for a reason. The latter, you gotta keep it ‘On’ unless you apply the tool on another dataset that ain’t got that particular additional dimension.
Ain’t matter the way you gonna use it, moving windows, cumulative windows with or without anchors, that’s your freedom of will, but some stuff stays the same:
Basis and deviations are “value” levels. From process control perspective, if you pls, it makes sense to Not only fade or push based on these levels, but to also do nothing when things are ambiguous and/or don’t require your intervention
Extensions and limits are extreme levels. Here you either push or fade, doing nothing is not an option, these are decisive points in all the meanings
Another important thing, lately I started to see one kind of trend here on tradingview as well and in general in near quant sources, of applying averages, percentiles etc ‘on’ other stationary metrics, so called “indicators”. And I mean not for diagnostic or development reasons, for decision making xd
This is not the evil crime ofc, but hillbilly af, cuz the metrics are stationary it means that you can model em, fit a distribution, like do smth sharper. Worst case you have Bayesian statistics armed with high density intervals and equal tail intervals, and even some others. All this stuff is not hard to do, if u aint’t doing it, it’s on you.
So what I’m saying is it makes sense to apply QBAD on returns ‘of your strategy’, on volume delta, but Not on other metrics that already do calculations over their own moving windows.
...
Second part:
Looks like some finna start to have lil suspicions, that ‘maybe’ after all math entities in reality are more like blueprints, while actual representations are physical/mechanical/algorithmic. Std & centralized moments is a math entity that represents location, scale & asymmetry info, and we can use it no problem, when things are legit and consistent especially. Real world stuff tho sometimes deviates from that ideal, so we need smth more handy and real. Add to the mix the algo counter part of means: quantiles.
Unlike the legacy quantile-based asymmetry metrics from the previous century (check quantile skewness & kurtosis), I don’t use arbitrary sets of quantiles, instead we get a binary pattern that is totally geometric & natural (check the code if interested, I made it very damn explicit). In spirit with math based central & standardized moments, each consequent pair is wider empathizing tail info more and more for each higher order metric.
Unlike the classic box plot, where inner thresholds are quartiles and the rest are based on em, here the basis is median (minimises L1), I base inner thresholds on it, and we continue the pattern by basing the further set of levels on the previous set. So unlike the classic box plot, here we have coherency in construction, symmetry.
Another thing to pay attention to, tho for some reason ain’t many talk about it, it’s not conceptually right to think that “you got data and you apply std moments on it”. No, you apply it to ‘centered around smth’ data. That ‘smth’ should minimize L2 error in case of math, L1 error in case of algo, and L0 error in case of learning/MLish/optimizational/whatever-you-cal-it stuff. So in the case of L0, that’s actually the ‘mode’ of KDE, but that’s for another time. Anyways, in case of L2 it’s mean, so we center data around mean, and apply std moments on residuals. That’s the precise way of framing it. If you understand this, suddenly very interesting details like 0th and 1st central moments start to make sense. In case of quantiles, we center data around the median, and do further processing on residuals, same.
Oth moment (I call it init) is always 1, tho it’s interesting to extrapolate backwards the sequence for higher order moments construction, to understand how we actually end up with this zero.
1st moment (I call it bias) of residuals would be zero if you match centering and residuals analysis methods. But for some reason you didn’t do that (e.g centered data around midhinge or mean and applied QBAD on the centered data), you have to account for that bias.
Realizing stuff > understanding stuff
Learning 2981234 human invented fields < realizing the same unified principles how the Universe works
∞
RVol+ Enhanced Relative Volume Indicator📊 RVol+ Enhanced Relative Volume Indicator
Overview
RVol+ (Relative Volume Plus) is an advanced time-based relative volume indicator designed specifically for swing traders and breakout detection. Unlike simple volume comparisons, RVol+ analyzes volume at the same time of day across multiple sessions, providing statistically significant insights into institutional activity and breakout potential.
🎯 Key Features
Core Volume Analysis
Time-Based RVol Calculation - Compares current cumulative volume to the average volume at this exact time over the past N days
Statistical Z-Score - Measures volume in standard deviations from the mean for true anomaly detection
Volume Percentile - Shows where current volume ranks historically (0-100%)
Sustained Volume Filter - 3-bar moving average prevents false signals from single-bar spikes
Breakout Detection
🚀 Confirmed Breakouts - Identifies price breakouts validated by high volume (RVol > 1.5x)
⚠️ False Breakout Warnings - Alerts when price breaks key levels on low volume (high failure risk)
Multi-Timeframe Context - Weekly volume overlay prevents chasing daily noise
Advanced Metrics
OBV Divergence Detection - Spots bullish/bearish accumulation/distribution patterns
Volume Profile Integration - Identifies institutional positioning
Money Flow Analysis - Tracks smart money vs retail activity
Extreme Volume Alerts - 🔥 Labels mark unusual spikes beyond the display cap
Visual Intelligence
Smart Color Coding:
🟢 Bright Teal = High activity (RVol ≥ 1.5x)
🟡 Medium Teal = Caution zone (RVol ≥ 1.2x)
⚪ Light Teal = Normal activity
🟠 Orange = Breakout confirmed
🔴 Red = False breakout risk
Comprehensive Stats Table:
Current Volume (formatted as M/K/B)
RVol ratio
Z-Score with significance
Volume percentile
Historical average and standard deviation
Sustained volume confirmation
📈 How to Use
For Swing Trading (1D - 3W Holds)
Perfect Setup:
✓ RVol > 1.5x (bright teal)
✓ Z-Score > 2.0 (⚡ alert)
✓ Percentile > 90%
✓ Sustained = ✓
✓ 🚀 Breakout label appears
Avoid:
✗ Red "Low Vol" warning during breakouts
✗ RVol < 1.0 at key levels
✗ Sustained volume not confirmed
Signal Interpretation
⚡ Z>2 Labels - Statistically significant volume (95th+ percentile) - highest probability moves
↗️ OBV+ Labels - Bullish accumulation (OBV rising while price consolidates)
↘️ OBV- Labels - Bearish distribution (OBV falling while price rises)
🔵 Blue Background - Weekly volume elevated (confirms daily strength)
⚙️ Customization
Basic Settings
N Day Average - Number of historical days for comparison (default: 5)
RVol Thresholds - Customize highlight levels (default: 1.2x, 1.5x)
Visual Display Cap - Prevent extreme spikes from compressing view (default: 4.0x)
Advanced Metrics (Toggle On/Off)
Z-Score analysis
Weekly RVol context
OBV divergence detection
Volume percentile ranking
Breakout signal generation
Table Customization
Position - 9 placement options to avoid chart overlap
Size - Tiny to Huge
Colors - Full customization of positive/negative/neutral values
Transparency - Adjustable background
Debug Mode
Enable Pine Logs for calculation transparency
Adjustable log frequency
Real-time calculation breakdown
🔬 Technical Details
Algorithm:
Binary search for historical lookups (O(log n) performance)
Time-zone aware session detection
DST-safe timestamp calculations
Exponentially weighted standard deviation
Anti-repainting architecture
Performance:
Optimized for max_bars_back = 5000
Efficient array management
Built-in function optimization
Memory-conscious data structures
📊 What Makes RVol+ Different?
vs. Standard Volume:
Context-aware (time-of-day matters)
Statistical significance testing
False breakout filtering
vs. Basic RVol:
Z-Score normalization (2-3 sigma detection)
Multi-timeframe confirmation
OBV divergence integration
Sustained volume filtering
Smart visual scaling
vs. Professional Tools:
Free and open-source
Fully customizable
No black-box algorithms
Educational debug logs
💡 Best Practices
Wait for Confirmation - Don't enter on first bar; wait for sustained volume ✓
Combine with Price Action - RVol validates, price structure determines entry
Weekly Context Matters - Blue background = institutional interest
Z-Score is King - Focus on ⚡ alerts for highest probability
Avoid Low Volume Breakouts - Red ⚠️ labels = high failure risk
🎓 Trading Psychology
Volume precedes price. When RVol+ shows:
High RVol + Rising OBV = Accumulation before breakout
High RVol at Resistance = Test of conviction
Low RVol on Breakout = Retail-driven (fade candidate)
Z-Score > 3 = Potential "whale" positioning
📝 Credits
Based on the time-based RVol concept from /u/HurlTeaInTheSea, enhanced with:
Statistical analysis (z-scores, percentiles)
Multi-timeframe integration
OBV divergence detection
Professional-grade visualization
Swing trading optimization
🔧 Version History
v2.0 - Enhanced Edition
Added Z-Score analysis
Multi-timeframe volume context
OBV divergence detection
Breakout confirmation system
Smart color coding
Customizable stats table
Debug logging mode
Performance optimizations
📚 Learn More
For optimal use with swing trading:
Combine with support/resistance levels
Watch for volume clusters in consolidation
Use weekly timeframe for trend confirmation
Monitor OBV divergence for early warnings
⚠️ Disclaimer
This indicator is for educational purposes. Volume analysis is one component of trading decisions. Always use proper risk management, consider multiple timeframes, and validate signals with price structure. Past performance does not guarantee future results.
🚀 Getting Started
Add indicator to chart
Adjust "N Day Average" to your preference (5-10 days typical)
Position stats table to avoid overlap
Enable features you want to monitor
Watch for 🚀 breakout confirmations!
Happy Trading! 📈

Ober Trend Oscillator [by Oberlunar]The Ober Trend Oscillator by Oberlunar unifies a volume-weighted view of price with order-flow information in a single, disciplined signal. At its core is a Triple Hull Moving Average applied to the session VWAP. This pairing is intentional: the Hull family is widely used because its quadratic weighting and internal differencing reduce phase lag versus SMA/EMA while preserving a smooth, readable contour; running it on top of VWAP anchors the calculation to a price already “risk-weighted” by volume, which behaves in practice like a microstructural equilibrium level. Around VWAP, the indicator computes standard-deviation envelopes that provide statistical context; excursions to the far band against the prevailing direction often mark probabilistic excess and become the first checkpoint for signal qualification.
The order-flow module is built on a tick-rule Cumulative Volume Delta, the most robust choice when native bid/ask deltas are unavailable. Volumes are signed by up- or down-moves, cumulatively integrated, then smoothed by a configurable EMA. To make the series comparable across instruments and timeframes, the CVD is standardised via an adjustable z-score window. This normalisation matters because it reframes “push” and “exhaustion” as deviations from recent behaviour rather than absolute thresholds tied to each market’s idiosyncratic liquidity. When enabled, a pivot-based divergence engine searches for fresh local highs or lows in price that the CVD refuses to confirm and annotates the symbol Δ with the percentage size of the divergence on price, on CVD, or both. Quantifying divergence avoids binary, eye-ball readings and lets you compare the relative strength of signals over time.
Signal generation follows a two-stage logic. Stage one is regime detection by the THMA on VWAP. The slope of the long THMA defines the primary trend, while the instantaneous difference between the THMA and its own lag sets the “serpentine” colour that conveys the local direction of pressure. Using slope on the longer window is deliberate: trend-following practice shows that slope filters materially reduce false positives in choppy regimes. Stage two enforces contextual alignment between price and higher-timeframe VWAP bands. For a long, the THMA computed on the higher-timeframe VWAP must sit below the current curve and below the second lower deviation, consistent with either a mean-reverting excess or early re-accumulation; shorts are defined symmetrically. Volume-flow confirmation is then required through either a rising CVD, a supportive z-score, or a detected pivot divergence in the same direction. To discourage over-trading, signals alternate by design and a strict colour gate is applied: a green diamond is never printed on a red line and bullish divergences are not drawn when the serpentine indicates bearish pressure. This visual consistency is not cosmetic; it reduces cognitive dissonance between filters and execution signal and improves reading discipline.
Parameters are organised to make these choices explicit. The main THMA length controls the oscillator’s sensitivity to VWAP, while the “trend” and “long-term” lengths drive the slope filter, with the latter acting as the regime anchor. The higher timeframe used to compute THMA on VWAP is the context-alignment knob and enables true multi-period operation, which is essential in fractal markets such as crypto, FX and equity indices. The VWAP deviation multiplier sets the breadth of the statistical bands; values modestly below one are a deliberate default to keep excess detection sensitive without turning the envelopes into a very wide channel. The ATR window that drives the line’s thickness is not a visual gimmick: thickness adapts to volatility and communicates the movement’s energy at a glance, much like an adaptive envelope.
The CVD package offers full control. A dedicated timeframe lets you decouple order-flow estimation from the chart’s timeframe when a slower, more reliable read of pressure is preferred. The calculation mode can reference Close-to-Close for responsiveness or HL2 for slightly greater robustness to closing noise, depending on the instrument’s microstructure. EMA smoothing governs granularity, the slope lookback sets how many observations are required to validate an inflection, and the z-score length defines the statistical horizon for normalisation—longer windows make the signal steadier, shorter windows make it more tactical. The pivot divergence option with percentage sizing grades relevance rather than merely flagging presence. Measuring both the price change between pivots and the CVD change is intentional: the most actionable divergences exhibit not only directionally opposing shapes but also a quantitative mismatch between price and flow; putting the two numbers side by side clarifies whether price is outrunning flow or flow is reversing ahead of price.
On the attached weekly Bitcoin example, the turquoise serpentine highlights impulsive phases while red denotes retracement or distribution. Δ labels with “P:%” and “C:%” mark points where price sets a new extreme without a matching CVD extreme; the percentage annotation helps distinguish a trivial imbalance from a credible exhaustion. Diamonds appear only when their colour agrees with the serpentine, and their location relative to the higher-TF VWAP bands clarifies when the market stops pushing “with volume” and starts pushing “against volume”—often the operational cue that precedes mean reversion or a consolidation before the next impulse.
Three methodological choices deserve emphasis. The THMA-on-VWAP architecture addresses the classic lag-versus-noise trade-off by combining a low-lag smoother with a volume-anchored base series that reflects institutional execution practice. Z-scoring the CVD is consistent with a statistical reading of flow that reasons in deviations from expected behaviour rather than fixed thresholds, which is particularly relevant on assets with shifting liquidity regimes. Finally, the colour gate plus signal alternation mitigates the well-known clustering of false positives in sideways markets: you do not print green on red or red on green, and you do not fire the same direction twice in a row without an opposite transition, which avoids hammering into the same move.
Practical usage is straightforward. Select your trading timeframe and align context with a higher timeframe in the VWAP-THMA; tune the VWAP deviation multiplier to match the instrument’s excess profile; choose an equal or slower CVD timeframe to extract structural pressure; enable divergence sizing when you want to measure, not only see, the gap between price and flow. Signals can also be drawn on the main chart, so next to candles, you will see both the execution diamonds and Δ labels with their percentage sizes. If you work with higher-timeframe inputs via `request.security`, be aware that those series confirm only at their own close; you can require confirmation for both the higher-TF VWAP and CVD timeframes to eliminate any practical repaint. Integrated alerts tied to THMA+VWAP+CVD validation convert discretionary reading into a monitorable workflow consistent with systematic routines.
Known limitations are stated explicitly. Tick-rule CVD is an approximation and, while standard in the absence of native bid/ask deltas, it may diverge from “true” delta on venues with unusual execution dynamics; normalisation helps but does not eliminate this. Pivot divergences depend on swing definition and require sensitivity calibration to avoid over-signalling on erratic markets. By construction, the oscillator favours trending contexts with statistically motivated pullbacks; during prolonged congestion, signals will naturally thin out, and the standardised CVD becomes the primary discriminator.
In sum, the Ober Trend Oscillator is a dual-channel reader: the THMA-on-VWAP line tells you about regime and movement quality, and the normalised CVD tells you about the pressure sustaining that movement. When the two stories align, continuation probability improves; when they diverge, the Δ annotation quantifies the gap and offers an objective basis for judging whether you are seeing a healthy pause or an impending reversal. The integration of volume-weighted price, simple statistics, and order-flow makes the indicator genuinely multi-period, capable of scaling from intraday to swing without changing its visual language or its decision criteria.
Oberlunar 👁️⭐

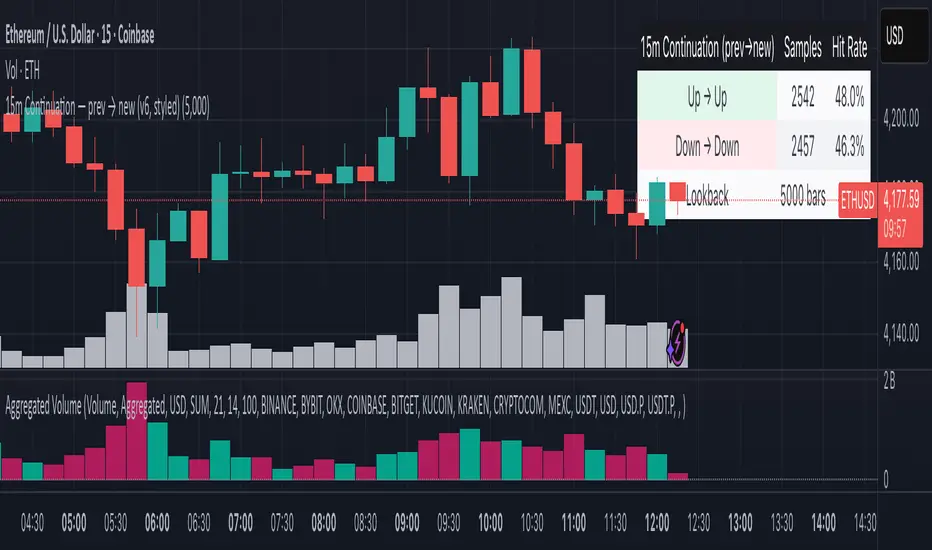
15m Continuation — prev → new (v6, styled)This indicator gives you backtested statistics on how often reversals vs continuations occur on 15 minute candles on any pair you want to trade. This is great for 15m binary markets like on Polymarket.
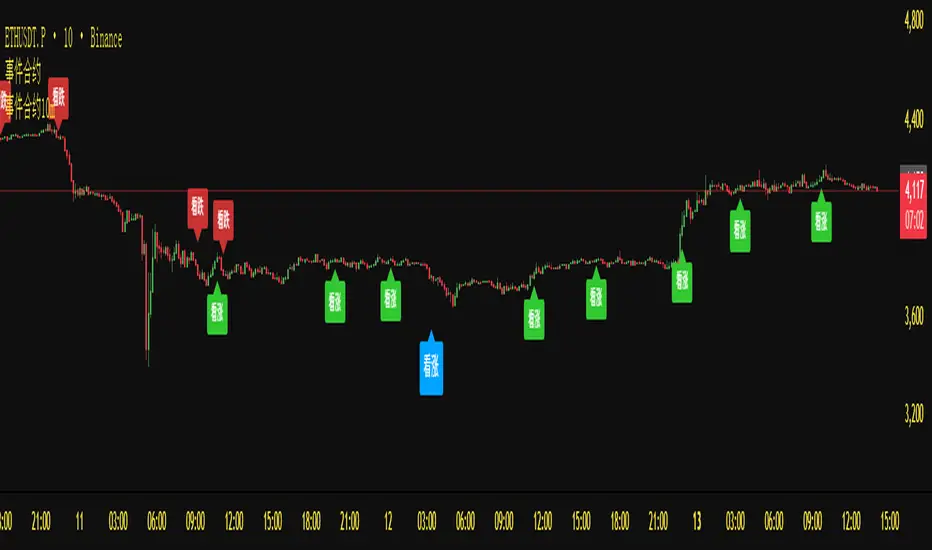
RSI+VOL——Binary(One bar)Overview
This indicator integrates Stochastic RSI, MACD trend alignment, ADX trend strength, and multi-dimensional volume analysis to provide intelligent signal guidance and market activity monitoring. It is suitable for short-term, swing, and event-driven trading, offering clear visualization of trend direction, market strength, and volume anomalies.
Core Features
1️⃣ Stochastic RSI Signals
Automatically identifies overbought and oversold conditions to generate buy and sell reference signals.
Signals are filtered with candle closing direction to reduce counter-trend entries.
2️⃣ MACD Trend Alignment
Signals trigger only when MACD trend direction aligns with Stochastic RSI, improving accuracy.
Real-time trend alignment reduces noise from ranging markets.
3️⃣ ADX Trend Strength Filter
Signals trigger only when ADX indicates a significant trend, filtering out low-strength movements.
Helps capture primary market directions.
4️⃣ Multi-Dimensional Volume Analysis
Differentiates bullish and bearish volume to identify breakout signals.
Relative volume (RVOL) ensures signals occur during periods of active trading.
Background highlights abnormal spikes and extreme volume, clearly reflecting market activity.
5️⃣ Signal Visualization and Alerts
Buy and sell labels with corresponding RSI values are displayed on the chart.
Built-in alert conditions support TradingView notifications and strategy integration.
Indicator Value
Multi-dimensional alignment: combines trend, momentum, and market activity for comprehensive assessment.
High-precision signal reference: filters noise and provides clear entry indications.
Market activity monitoring: highlights extreme volume to reflect market participation.
Broad applicability: suitable for short-term, swing, and event-driven trading across various markets.
[DEM] Parabolic SAR Bars (PSAR Bars) Parabolic SAR Bars is a visual enhancement of the traditional Parabolic SAR indicator that uses dynamic color coding to represent the relative position and momentum of price versus the SAR levels. The indicator calculates the percentage difference between the closing price and the Parabolic SAR value, then applies either a gradient color scheme that transitions from red to blue based on the relative strength within a 20-period range, or a momentum-based coloring system using purple, blue, and red to indicate directional changes. Both the SAR plot points and the price bars themselves are colored according to this system, creating an intuitive visual representation where traders can quickly assess not just whether price is above or below the SAR, but also the strength and momentum of that relationship. This approach transforms the binary nature of traditional Parabolic SAR signals into a more nuanced visual tool that helps identify the intensity of trending conditions and potential momentum shifts before actual SAR reversals occur.

Machine Learning Gaussian Mixture Model | AlphaNattMachine Learning Gaussian Mixture Model | AlphaNatt
A revolutionary oscillator that uses Gaussian Mixture Models (GMM) with unsupervised machine learning to identify market regimes and automatically adapt momentum calculations - bringing statistical pattern recognition techniques to trading.
"Markets don't follow a single distribution - they're a mixture of different regimes. This oscillator identifies which regime we're in and adapts accordingly."
━━━━━━━━━━━━━━━━━━━━━━━━━━━━━━━━━━━━━━━━
🤖 THE MACHINE LEARNING
Gaussian Mixture Models (GMM):
Unlike K-means clustering which assigns hard boundaries, GMM uses probabilistic clustering :
Models data as coming from multiple Gaussian distributions
Each market regime is a different Gaussian component
Provides probability of belonging to each regime
More sophisticated than simple clustering
Expectation-Maximization Algorithm:
The indicator continuously learns and adapts using the E-M algorithm:
E-step: Calculate probability of current market belonging to each regime
M-step: Update regime parameters based on new data
Continuous learning without repainting
Adapts to changing market conditions
━━━━━━━━━━━━━━━━━━━━━━━━━━━━━━━━━━━━━━━━
🎯 THREE MARKET REGIMES
The GMM identifies three distinct market states:
Regime 1 - Low Volatility:
Quiet, ranging markets
Uses RSI-based momentum calculation
Reduces false signals in choppy conditions
Background: Pink tint
Regime 2 - Normal Market:
Standard trending conditions
Uses Rate of Change momentum
Balanced sensitivity
Background: Gray tint
Regime 3 - High Volatility:
Strong trends or volatility events
Uses Z-score based momentum
Captures extreme moves
Background: Cyan tint
━━━━━━━━━━━━━━━━━━━━━━━━━━━━━━━━━━━━━━━━
💡 KEY INNOVATIONS
1. Probabilistic Regime Detection:
Instead of binary regime assignment, provides probabilities:
30% Regime 1, 60% Regime 2, 10% Regime 3
Smooth transitions between regimes
No sudden indicator jumps
2. Weighted Momentum Calculation:
Combines three different momentum formulas
Weights based on regime probabilities
Automatically adapts to market conditions
3. Confidence Indicator:
Shows how certain the model is (white line)
High confidence = strong regime identification
Low confidence = transitional market state
Line transparency changes with confidence
━━━━━━━━━━━━━━━━━━━━━━━━━━━━━━━━━━━━━━━━
⚙️ PARAMETER OPTIMIZATION
Training Period (50-500):
50-100: Quick adaptation to recent conditions
100: Balanced (default)
200-500: Stable regime identification
Number of Components (2-5):
2: Simple bull/bear regimes
3: Low/Normal/High volatility (default)
4-5: More granular regime detection
Learning Rate (0.1-1.0):
0.1-0.3: Slow, stable learning
0.3: Balanced (default)
0.5-1.0: Fast adaptation
━━━━━━━━━━━━━━━━━━━━━━━━━━━━━━━━━━━━━━━━
📊 TRADING STRATEGIES
Visual Signals:
Cyan gradient: Bullish momentum
Magenta gradient: Bearish momentum
Background color: Current regime
Confidence line: Model certainty
1. Regime-Based Trading:
Regime 1 (pink): Expect mean reversion
Regime 2 (gray): Standard trend following
Regime 3 (cyan): Strong momentum trades
2. Confidence-Filtered Signals:
Only trade when confidence > 70%
High confidence = clearer market state
Avoid transitions (low confidence)
3. Adaptive Position Sizing:
Regime 1: Smaller positions (choppy)
Regime 2: Normal positions
Regime 3: Larger positions (trending)
━━━━━━━━━━━━━━━━━━━━━━━━━━━━━━━━━━━━━━━━
🚀 ADVANTAGES OVER OTHER ML INDICATORS
vs K-Means Clustering:
Soft clustering (probabilities) vs hard boundaries
Captures uncertainty and transitions
More mathematically robust
vs KNN (K-Nearest Neighbors):
Unsupervised learning (no historical labels needed)
Continuous adaptation
Lower computational complexity
vs Neural Networks:
Interpretable (know what each regime means)
No overfitting issues
Works with limited data
━━━━━━━━━━━━━━━━━━━━━━━━━━━━━━━━━━━━━━━━
📈 PERFORMANCE CHARACTERISTICS
Best Market Conditions:
Markets with clear regime shifts
Volatile to trending transitions
Multi-timeframe analysis
Cryptocurrency markets (high regime variation)
Key Strengths:
Automatically adapts to market changes
No manual parameter adjustment needed
Smooth transitions between regimes
Probabilistic confidence measure
━━━━━━━━━━━━━━━━━━━━━━━━━━━━━━━━━━━━━━━━
🔬 TECHNICAL BACKGROUND
Gaussian Mixture Models are used extensively in:
Speech recognition (Google Assistant)
Computer vision (facial recognition)
Astronomy (galaxy classification)
Genomics (gene expression analysis)
Finance (risk modeling at investment banks)
The E-M algorithm was developed at Stanford in 1977 and is one of the most important algorithms in unsupervised machine learning.
━━━━━━━━━━━━━━━━━━━━━━━━━━━━━━━━━━━━━━━━
💡 PRO TIPS
Watch regime transitions: Best opportunities often occur when regimes change
Combine with volume: High volume + regime change = strong signal
Use confidence filter: Avoid low confidence periods
Multi-timeframe: Compare regimes across timeframes
Adjust position size: Scale based on identified regime
━━━━━━━━━━━━━━━━━━━━━━━━━━━━━━━━━━━━━━━━
⚠️ IMPORTANT NOTES
Machine learning adapts but doesn't predict the future
Best used with other confirmation indicators
Allow time for model to learn (100+ bars)
Not financial advice - educational purposes
Backtest thoroughly on your instruments
━━━━━━━━━━━━━━━━━━━━━━━━━━━━━━━━━━━━━━━━
🏆 CONCLUSION
The GMM Momentum Oscillator brings institutional-grade machine learning to retail trading. By identifying market regimes probabilistically and adapting momentum calculations accordingly, it provides:
Automatic adaptation to market conditions
Clear regime identification with confidence levels
Smooth, professional signal generation
True unsupervised machine learning
This isn't just another indicator with "ML" in the name - it's a genuine implementation of Gaussian Mixture Models with the Expectation-Maximization algorithm, the same technology used in:
Google's speech recognition
Tesla's computer vision
NASA's data analysis
Wall Street risk models
"Let the machine learn the market regimes. Trade with statistical confidence."
━━━━━━━━━━━━━━━━━━━━━━━━━━━━━━━━━━━━━━━━
Developed by AlphaNatt | Machine Learning Trading Systems
Version: 1.0
Algorithm: Gaussian Mixture Model with E-M
Classification: Unsupervised Learning Oscillator
Not financial advice. Always DYOR.

Session Sniper Bands — Pro Overlay (Bollinger, Sessions, Engulf)The Session Sniper Bands — Pro Overlay combines three powerful tools into one clean, professional script designed to help traders spot high-probability setups across any market.
📌 What’s included:
Dual Bollinger Bands → track volatility squeezes, expansions, and mean reversion zones.
Customizable Trading Sessions (Tokyo / London / New York) → shaded regions with editable names, open/close lines, range, and average price markers.
Engulfing Candlestick Signals → automatic bullish and bearish engulfing arrows for precision entry timing.
✨ Features:
Session names and times are fully customizable (rename “Tokyo” to “Asia Open,” etc.).
Clear OB/OS volatility cues via Bollinger stack.
Lightweight visuals that won’t clutter your chart.
Works across Forex, Crypto, Indices, and Binary Options.
⚡ Why use it?
This overlay is built for traders who want to snipe entries with session context. Spot when volatility contracts, align with session flows, and confirm with engulfing momentum candles — all in one view.
⚠️ Disclaimer: This script is for educational purposes only and is not financial advice. Always test on demo before trading live.
MA20 & MA50 RisingMA20 & MA50 Rising Scanner
Detects when both the 20-period and 50-period simple moving averages turn upward on the most recent bar. Designed as a lightweight screener column for TradingView’s watchlists.
Overview
This indicator plots a binary flag (0 or 1) per symbol, where
- 1 means SMA(20) > SMA(20) and SMA(50) > SMA(50)
- 0 means one or both moving averages did not rise
Add it as a custom column in your watchlist to instantly surface stocks with both short- and medium-term trend acceleration.
How It Works
- Calculates ma20 = simple moving average of the last 20 closes
- Calculates ma50 = simple moving average of the last 50 closes
- Compares each with its prior value (ma20 and ma50 )
- Sets flag to 1 only when both are higher than yesterday’s values
When you filter your watchlist for flag == 1, you see only symbols whose 20- and 50-period SMAs both rose on the latest bar.

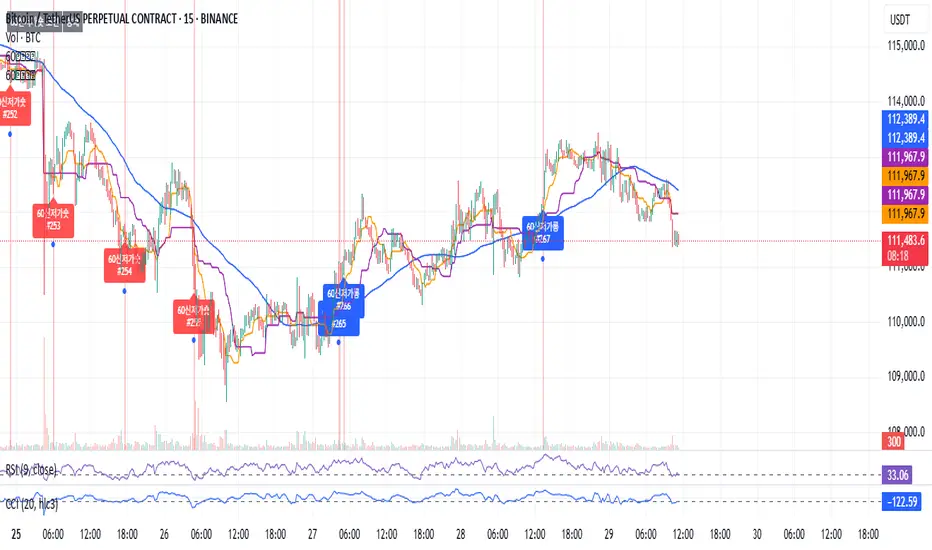
60 신고가 롱“60-Day New High Long” is a momentum breakout strategy that buys when price makes a fresh 60-day high, expecting continuation after resistance gives way.
Enter on the breakout close (or next open) with confirmation such as expanding volume, relative strength vs. a benchmark, and price above the 50/200-day MAs.
Manage risk with a stop below the recent swing low or 20-day low; take profits via ATR-based targets or a trailing stop, and be cautious around binary catalysts (earnings/news).
DM Impulse Enhanced [BackQuant]DM Impulse Enhanced
What this is (and what it isn’t)
DM Impulse Enhanced is a signal-driven overlay that classifies market action into two practical regimes: Long (risk-on) and Cash (risk-off). It’s built around a proprietary impulse model from the directional-movement family, wrapped in a persistence test and a state machine. Because this script is private, the core mechanics are intentionally abstracted here; what follows explains how to read and use it without revealing the protected calculation.
Why traders use it
Many tools oscillate or describe “how stretched” price is; fewer make a firm, operational call that you can automate. DM Impulse Enhanced aims to do exactly that declare when upside pressure is broad and durable enough to justify a long bias, and when deterioration is strong enough to stand aside (cash/short discretion). The emphasis is on impulse persistence rather than one-off spikes.
What you see on the chart
• Long / Cash markers – Green up-triangles (Long) and red down-triangles (Cash) plot at the bar where the regime changes.
• Regime-tinted bars (optional) – Candles can be softly shaded green during Long and red during Cash for at-a-glance context.
• Trend ribbon (context only) – A narrow ribbon (fast/slow moving averages) is tinted by the current regime to show trend alignment; it does not generate signals on its own.
• No separate sub-pane – Signals are intended to sit directly on price for immediate decision-making.
How the logic behaves (high-level)
Impulse core – A directional-movement–based engine estimates the strength of buying vs. selling pressure over a user-defined horizon.
Persistence gate – Instead of reacting to a single reading, the model evaluates how consistently that impulse dominates across a configurable lookback range.
State machine – When persistence clears (or fails) a pair of thresholds, the model flips and stays in that regime until evidence justifies a change. This “stickiness” is intentional; it reduces whipsaws in choppy tape.
Inputs & controls
Calculation Settings
• DM Length – The base horizon for the impulse engine. Longer = smoother/steadier; shorter = quicker/more reactive.
• Start / End – Defines the span of the persistence check. Expanding the span asks the market to prove itself against more history before changing regime.
Signal Settings
• Long Threshold – The persistence level required to promote the model into Long.
• Short Threshold – The level that, once crossed to the downside, demotes the model into Cash. Using a cross-under event for risk-off helps avoid premature exits on noise.
Visual Settings
• Long / Short colours – Customize marker and shading hues.
• Color Bars? – Toggle candle tinting by regime (off if you prefer a clean chart).
Reading the signals
• Long prints only when the model observes sustained upside pressure across the configured span. Treat this as permission to engage with pullbacks, breakouts, or your preferred setups in the direction of the trend.
• Cash prints when downside deterioration is strong enough to invalidate the prior regime. It’s a risk-off directive—flatten, hedge, or switch to short strategies according to your plan.
• Regime persistence is a feature: once Long, the model won’t flip on minor dips; once Cash, it won’t re-arm on minor bounces. If you want more flips, shorten the spans and relax thresholds; if you want fewer, do the opposite.
Practical tuning guide
Match DM Length to your timeframe
– Intraday: smaller length for timely response.
– Swing/Position: larger length to filter desk-noise and track higher-timeframe flows.
Size the persistence span to your goal
– Narrow span: faster regime changes, more trades, more noise.
– Wide span: fewer, higher-conviction calls, longer holds.
Set realistic thresholds
– The Long threshold should be reachable with your chosen span; the Short threshold should be low enough to catch genuine deterioration but not so tight that it flips on every dip.
Decide on cosmetics
– Turn on bar tinting for discretionary reading, or keep it off when exporting screenshots or running other overlays.
Suggested workflows
• Trend-following with discipline – Trade only in the Long regime; use structure (higher lows, anchored VWAP, or pullbacks to your MA stack) for entries and the Cash flip as a portfolio-level exit.
• Risk overlay – Keep your normal strategy, but: reduce size when Cash appears; re-enable full risk only after Long reasserts.
• Multi-timeframe gating – Require Long on a higher timeframe (e.g., 4H or 1D), then take entries on a lower one. If the high-TF posts Cash, stand down.
How the ribbon fits in
The ribbon visualizes short- vs. intermediate-term trend in the same colour as the regime. It’s deliberately “dumb”: it does not change the signal, it just helps you see when price action and regime are in harmony (e.g., pullbacks during Long that hold above the ribbon).
Alerts included
• DM Impulse LONG – Triggers as the persistence measure clears the Long threshold.
• DM Impulse CASH – Triggers when deterioration crosses the Short threshold from above.
Configure alerts to fire on bar close if you want final (non-intrabar) decisions.
Strengths
• Actionable binary output – Long/Cash is unambiguous and easy to automate.
• Persistence-aware – Focuses on runs that endure, not one-bar excitement.
• Asset/timeframe agnostic – Works anywhere you trust directional-movement concepts (equities, futures, crypto, FX).
Limitations & cautions
• Not a reversal caller – It’s a regime classifier. If you need early bottoms/tops, pair it with your own exhaustion or liquidity tools.
• Parameter feasibility matters – If your thresholds are set beyond what your span can reasonably achieve, signals may rarely (or never) trigger.
• Chop happens – In mean-reverting or news-driven tape, expect more frequent flips unless you widen spans and thresholds.
• Intrabar movement – Like any responsive model, provisional intrabar states can appear before the bar closes. Use “bar close” alerts for finality.
Getting started (safe defaults you can adapt)
• Intraday bias – Shorter DM Length, modest span, moderately tight thresholds.
• Swing filter – Longer DM Length, wider span, stricter Long and sufficiently low Short.
• Conservative overlay – Keep thresholds firm and spans wide; use signals to scale risk rather than flip directions frequently.
Summary
DM Impulse Enhanced is a persistence-focused regime classifier built on directional-movement concepts. It answers a narrow question clearly “Risk-on or risk-off?” and stays with that answer until the evidence meaningfully changes. Use it as a bias switch, a portfolio risk overlay, or a gate for your existing entry logic, and size its spans/thresholds to the cadence of the market you trade.

RCI Buy/Sell Signals RCI Buy/Sell Signals — Dual-RCI State Machine with EMA Bias (Protected)
A purpose-built signal tool that combines two RCI horizons with a deterministic state machine and an EMA-based background bias. It is not a simple mashup: the components are designed to work together so that trend context, timing, and exits form a coherent workflow.
The code remains closed-source to protect a proprietary implementation; this description explains what it does and how the pieces interact so traders can evaluate it.
What it does
On-chart signals: Marks potential BUY/SELL entries and EXITs directly on the chart (markers are drawn with a −1 bar offset for readability).
Trend bias at a glance: Background shading reflects EMA context:
Green when price is above both EMA1 and EMA2
Red when price is below both EMA1 and EMA2
No shading otherwise
(EMA lengths and timeframes are user-configurable.)
Deterministic state machine: Ensures only one active side at a time (flat → long/short → exit), so entries/exits do not overlap or contradict each other.
How it works (conceptual)
Two-horizon RCI framework:
A MID-RCI monitors regime transitions using mid-range thresholds.
A LONG-RCI acts as a slower directional filter/validator.
Two timing modes (you can enable either or both):
Steadily — MID-RCI transitions across mid-band thresholds (e.g., around −50/50) govern entries; LONG-RCI direction is used to confirm/align.
Above — LONG-RCI crosses its pivotal level (around zero) with directional agreement.
These modes are integrated—not stacked randomly—so that one provides timing, the other directional context.
Exits & risk guard: Exits trigger on MID-RCI reaching extreme bands (e.g., ±85) or when price violates a simple N-bar extremum stop (default: 20-bar low/high), whichever comes first. This makes exits explicit rather than relying on a trailing overlay.
Why this is not “just a merge”
The EMAs are not a separate indicator pasted on top; they only provide a binary bias that gates background shading and helps filter entries visually.
The RCI pair is functionally split (timing vs. confirmation) and then synchronized through a state machine that prevents conflicting signals and enforces clean transitions.
The script ships with signal placement discipline (−1 offset markers for clarity) and built-in exit logic based on RCI extremes plus a simple context stop—an integrated design choice, not an ad-hoc mix.
Inputs (overview)
Display: Show Entry Signals / Show Exit Signals / Show Background
Context: EMA1/EMA2 lengths & timeframes (background bias only)
RCI: Long/Mid lengths and source
How to use
Apply the script on a clean chart (no other indicators unless you explain why).
Use the background color as high-level bias, then use the on-chart signals for timing.
Optionally set alerts with “Any alert() function call” to receive signal notifications.
Confirm with your own risk management, liquidity checks, and higher-timeframe confluence.
Notes on publication (for moderators & traders)
Closed-source rationale: The specific RCI ranking/threshold scheme and the state-machine selection logic are part of ongoing proprietary research; the code is protected.
This description details the concepts and interactions sufficiently to understand what the script does and how components work together, while preserving implementation specifics.
Disclaimer
For educational/informational purposes only; not financial advice. Test thoroughly before live use. Trading involves risk.

VWAP For Loop [BackQuant]VWAP For Loop
What this tool does—in one sentence
A volume-weighted trend gauge that anchors VWAP to a calendar period (day/week/month/quarter/year) and then scores the persistence of that VWAP trend with a simple for-loop “breadth” count; the result is a clean, threshold-driven oscillator plus an optional VWAP overlay and alerts.
Plain-English overview
Instead of judging raw price alone, this indicator focuses on anchored VWAP —the market’s average price paid during your chosen institutional period. It then asks a simple question across a configurable set of lookback steps: “Is the current anchored VWAP higher than it was i bars ago—or lower?” Each “yes” adds +1, each “no” adds −1. Summing those answers creates a score that reflects how consistently the volume-weighted trend has been rising or falling. Extreme positive scores imply persistent, broad strength; deeply negative scores imply persistent weakness. Crossing predefined thresholds produces objective long/short events and color-coded context.
Under the hood
• Anchoring — VWAP using hlc3 × volume resets exactly when the selected period rolls:
Day → session change, Week → new week, Month → new month, Quarter/Year → calendar quarter/year.
• For-loop scoring — For lag steps i = , compare today’s VWAP to VWAP .
– If VWAP > VWAP , add +1.
– Else, add −1.
The final score ∈ , where N = (end − start + 1). With defaults (1→45), N = 45.
• Signal logic (stateful)
– Long when score > upper (e.g., > 40 with N = 45 → VWAP higher than ~89% of checked lags).
– Short on crossunder of lower (e.g., dropping below −10).
– A compact state variable ( out ) holds the current regime: +1 (long), −1 (short), otherwise unchanged. This “stickiness” avoids constant flipping between bars without sufficient evidence.
Why VWAP + a breadth score?
• VWAP aggregates both price and volume—where participants actually traded.
• The breadth-style count rewards consistency of the anchored trend, not one-off spikes.
• Thresholds give you binary structure when you need it (alerts, automation), without complex math.
What you’ll see on the chart
• Sub-pane oscillator — The for-loop score line, colored by regime (long/short/neutral).
• Main-pane VWAP (optional) — Even though the indicator runs off-chart, the anchored VWAP can be overlaid on price (toggle visibility and whether it inherits trend colors).
• Threshold guides — Horizontal lines for the long/short bands (toggle).
• Cosmetics — Optional candle painting and background shading by regime; adjustable line width and colors.
Input map (quick reference)
• VWAP Anchor Period — Day, Week, Month, Quarter, Year.
• Calculation Start/End — The for-loop lag window . With 1→45, you evaluate 45 comparisons.
• Long/Short Thresholds — Default upper=40, lower=−10 (asymmetric by design; see below).
• UI/Style — Show thresholds, paint candles, background color, line width, VWAP visibility and coloring, custom long/short colors.
Interpreting the score
• Near +N — Current anchored VWAP is above most historical VWAP checkpoints in the window → entrenched strength.
• Near −N — Current anchored VWAP is below most checkpoints → entrenched weakness.
• Between — Mixed, choppy, or transitioning regimes; use thresholds to avoid reacting to noise.
Why the asymmetric default thresholds?
• Long = score > upper (40) — Demands unusually broad upside persistence before declaring “long regime.”
• Short = crossunder lower (−10) — Triggers only on downward momentum events (a fresh breach), not merely being below −10. This combination tends to:
– Capture sustained uptrends only when they’re very strong.
– Flag downside turns as they occur, rather than waiting for an extreme negative breadth.
Tuning guide
Choose an anchor that matches your horizon
– Intraday scalps : Day anchor on intraday charts.
– Swing/position : Month or Quarter anchor on 1h/4h/D charts to capture institutional cycles.
Pick the for-loop window
– Larger N (bigger end) = stronger evidence requirement, smoother oscillator.
– Smaller N = faster, more reactive score.
Set achievable thresholds
– Ensure upper ≤ N and lower ≥ −N ; if N=30, an upper of 40 can never trigger.
– Symmetric setups (e.g., +20/−20) are fine if you want balanced behavior.
Match visuals to intent
– Enabling VWAP coloring lets you see regime directly on price.
– Background shading is useful for discretionary reading; turn it off for cleaner automation displays.
Playbook examples
• Trend confirmation with disciplined entries — On Month anchor, N=45, upper=38–42: when the long regime engages, use pullbacks toward anchored VWAP on the main pane for entries, with stops just beyond VWAP or a recent swing.
• Downside transition detection — Keep lower around −8…−12 and watch for crossunders; combine with price losing anchored VWAP to validate risk-off.
• Intraday bias filter — Day anchor on a 5–15m chart, N=20–30, upper ~ 16–20, lower ~ −6…−10. Only take longs while score is positive and above a midline you define (e.g., 0), and shorts only after a genuine crossunder.
Behavior around resets (important)
Anchored VWAP is hard-reset each period. Immediately after a reset, the series can be young and comparisons to pre-reset values may span two periods. If you prefer within-period evaluation only, choose end small enough not to bridge typical period length on your timeframe, or accept that the breadth test intentionally spans regimes.
Alerts included
• VWAP FL Long — Fires when the long condition is true (score > upper and not in short).
• VWAP FL Short — Fires on crossunder of the lower threshold (event-driven).
Messages include {{ticker}} and {{interval}} placeholders for routing.
Strengths
• Simple, transparent math — Easy to reason about and validate.
• Volume-aware by construction — Decisions reference VWAP, not just price.
• Robust to single-bar noise — Needs many lags to agree before flipping state (by design, via thresholds and the stateful output).
Limitations & cautions
• Threshold feasibility — If N < upper or |lower| > N, signals will never trigger; always cross-check N.
• Path dependence — The state variable persists until a new event; if you want frequent re-evaluation, lower thresholds or reduce N.
• Regime changes — Calendar resets can produce early ambiguity; expect a few bars for the breadth to mature.
• VWAP sensitivity to volume spikes — Large prints can tilt VWAP abruptly; that behavior is intentional in VWAP-based logic.
Suggested starting profiles
• Intraday trend bias : Anchor=Day, N=25 (1→25), upper=18–20, lower=−8, paint candles ON.
• Swing bias : Anchor=Month, N=45 (1→45), upper=38–42, lower=−10, VWAP coloring ON, background OFF.
• Balanced reactivity : Anchor=Week, N=30 (1→30), upper=20–22, lower=−10…−12, symmetric if desired.
Implementation notes
• The indicator runs in a separate pane (oscillator), but VWAP itself is drawn on price using forced overlay so you can see interactions (touches, reclaim/loss).
• HLC3 is used for VWAP price; that’s a common choice to dampen wick noise while still reflecting intrabar range.
• For-loop cap is kept modest (≤50) for performance and clarity.
How to use this responsibly
Treat the oscillator as a bias and persistence meter . Combine it with your entry framework (structure breaks, liquidity zones, higher-timeframe context) and risk controls. The design emphasizes clarity over complexity—its edge is in how strictly it demands agreement before declaring a regime, not in predicting specific turns.
Summary
VWAP For Loop distills the question “How broadly is the anchored, volume-weighted trend advancing or retreating?” into a single, thresholded score you can read at a glance, alert on, and color through your chart. With careful anchoring and thresholds sized to your window length, it becomes a pragmatic bias filter for both systematic and discretionary workflows.

Six Meridian Divine Swords [theUltimator5]The Six Meridian Divine Sword is a legendary martial arts technique in the classic wuxia novel “Demi-Gods and Semi-Devils” (天龙八部) by Jin Yong (金庸). The technique uses powerful internal energy (qi) to shoot invisible sword-like energy beams from the six meridians of the hand. Each of the six fingers/meridians corresponds to a “sword,” giving six different sword energies.
The Six Meridian Divine Swords indicator is a compact “signal dashboard” that fuses six classic indicators (fingers)—MACD, KDJ, RSI, LWR (Williams %R), BBI, and MTM—into one pane. Each row is a traffic-light dot (green/bullish, red/bearish, gray/neutral). When all six align, the script draws a confirmation line (“All Bullish” or “All Bearish”). It’s designed for quick consensus reads across trend, momentum, and overbought/oversold conditions.
How to Read the Dashboard
The pane has 6 horizontal rows (explained in depth later):
MACD
KDJ
RSI
LWR (Larry Williams %R)
BBI (Bull & Bear Index)
MTM (Momentum)
Each tick in the row is a dot, with sentiment identified by a color.
Green = bullish condition met
Red = bearish condition met
Gray = inside a neutral band (filtering chop), shown when Use Neutral (Gray) Colors is ON
There are two lines that track the dots on the top or bottom of the pane.
All Bullish Signal Line: appears only if all 6 are strongly bullish (default color = white)
All Bearish Signal Line: appears only if all 6 are strongly bearish (default color = fuchsia)
The Six Meridians (Indicators) — What They Mean:
1) MACD — Trend & Momentum
What it is: A trend-following momentum indicator based on the relationship between two moving averages (typically 12-EMA and 26-EMA)
Logic used: Classic MACD line (EMA12−EMA26) vs its 9-EMA signal.
Bullish: MACD > Signal and |MACD−Signal| > Neutral Threshold
Bearish: MACD < Signal and |diff| > threshold
Neutral: |diff| ≤ threshold
Why: Small crosses can whipsaw. The neutral band ignores tiny separations to reduce noise.
Inputs: Fast/Slow/Signal lengths, Neutral Threshold.
2) KDJ — Stochastic with J-line boost
What it is: A variation of the stochastic oscillator popular in Chinese trading systems
Logic used: K = SMA(Stochastic, smooth), D = SMA(K, smooth), J = 3K − 2D.
Bullish: K > D and |K−D| > 2
Bearish: K < D and |K−D| > 2
Neutral: |K−D| ≤ 2
Why: K–D separation filters tiny wiggles; J offers an “extreme” early-warning context in the value label.
Inputs: Length, Smoothing.
3) RSI — Momentum balance (0–100)
What it is: A momentum oscillator measuring speed and magnitude of price changes (0–100)
Logic used: RSI(N).
Bullish: RSI > 50 + Neutral Zone
Bearish: RSI < 50 − Neutral Zone
Neutral: Between those bands
Why: Centerline/adaptive bands (around 50) give a directional bias without relying on fixed 70/30.
Inputs: Length, Neutral Zone (± around 50).
4) LWR (Williams %R) — Overbought/Oversold
What it is: An oscillator similar to stochastic, measuring how close the close is to the high-low range over N periods
Logic used: %R over N bars (0 to −100).
Bullish: %R > −50 + Neutral Zone
Bearish: %R < −50 − Neutral Zone
Neutral: Between those bands
Why: Uses a centered band around −50 instead of only −20/−80, making it act like a directional filter.
Inputs: Length, Neutral Zone (± around −50).
5) BBI (Bull & Bear Index) — Smoothed trend bias
What it is: A composite moving average, essentially the average of several different moving averages (often 3, 6, 12, 24 periods)
Logic used: Average of 4 SMAs (3/6/12/24 by default):
BBI = (MA3 + MA6 + MA12 + MA24) / 4
Bullish: Close > BBI and |Close−BBI| > 0.2% of BBI
Bearish: Close < BBI and |diff| > threshold
Neutral: |diff| ≤ threshold
Why: Multiple MAs blended together reduce single-MA whipsaw. A dynamic 0.2% band ignores tiny drift.
Inputs: 4 lengths (default 3/6/12/24). Threshold is auto-scaled at 0.2% of BBI.
6) MTM (Momentum) — Rate of change in price
What it is: A simple measure of rate of change
Logic used: MTM = Close − Close
Bullish: MTM > 0.5% of Close
Bearish: MTM < −0.5% of Close
Neutral: |MTM| ≤ threshold
Why: A percent-based gate adapts across prices (e.g., $5 vs $500) and mutes insignificant moves.
Inputs: Length. Threshold auto-scaled to 0.5% of current Close.
Display & Inputs You Can Tweak
🎨 Use Neutral (Gray) Colors
ON (default): 3-color mode with clear “no-trade”/“weak” states.
OFF: classic binary (green/red) without neutral filtering.

Nasdaq Sentiment DashboardBuilds a composite sentiment state — RISK-ON / NEUTRAL / RISK-OFF — using three legs:
Volatility: CBOE VXN vs its moving average and absolute thresholds (risk-on when low & below MA; risk-off when high & above MA).
Breadth (quality of participation): QQEW/QQQ ratio vs its MA (equal-weight beating cap-weight = healthier breadth).
Advance/Decline (intraday breadth): advdec.nq vs its MA, with a magnitude filter (ignores tiny A/D days).
How it works
Pulls each series on your chosen signal timeframe (default Daily).
Creates binary signals per leg:
Vol: volOn if VXN < MA and < vxnLower; volOff if VXN > MA and > vxnUpper.
Breadth: brOn if QQEW/QQQ is above its MA by a deadband; brOff if below.
A/D: adOn if A/D > MA and above adMin; adOff if below MA and < -adMin.
Scores each leg (+1 on, −1 off, 0 neutral) → sums to −3…+3.
State rule (default): RISK-ON if score ≥ +2, RISK-OFF if ≤ −2, else NEUTRAL (i.e., need 2 of 3 to agree).
Detects flips (changes in state) and provides alert conditions that fire only on the flip bar.
What you see
Lines for VXN & MA, QQEW/QQQ & MA, A/D & MA.
Background color shows current composite state.
Triangle markers on the flip bar (up for ON, down for OFF).
A top-right table summarizing state, each leg vs its MA, and the composite score.
How to tune
Vol thresholds: vxnLower / vxnUpper.
Breadth whipsaw control: deadbandBps around the ratio’s MA.
A/D sensitivity: adMin and adMaLen.
Stricter regime: require all 3 to agree by changing the state line to score == 3 / -3.
