Bitcoin Price CompareDumb, simple script to just toss up BTC's price. I use it to quickly make sure a trend is real or not.
在腳本中搜尋"bitcoin"

Bitcoin Exchanges Premium FinalIncludes shape alerts for when exchanges have sudden changes vs bitfinex.

Bitcoin Exchanges Premium (Incl Int & GBTC) vs GdaxShows the exchange premiums internationally (Hong Kong, Luxembourg, Korea, Japan, China) vs Gdax. Also includes GBTC Trust price (adjusted).
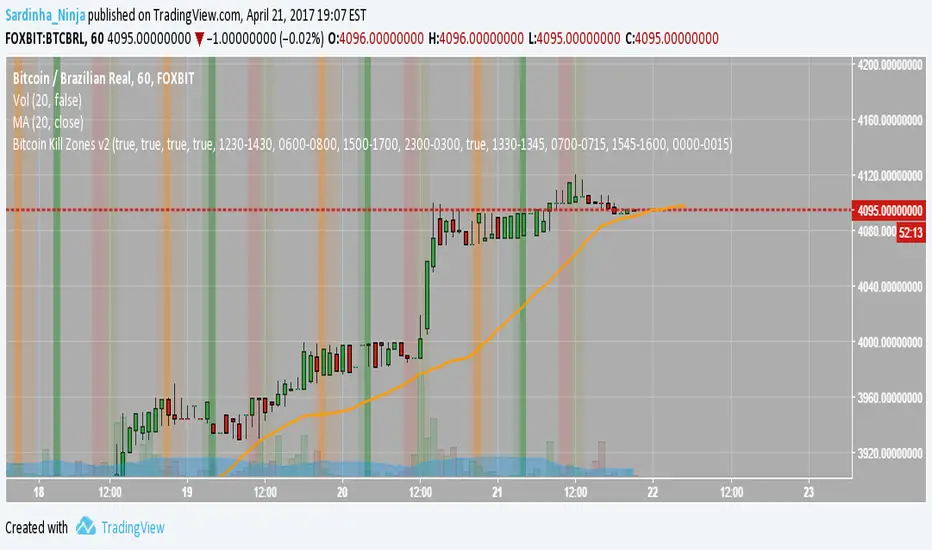
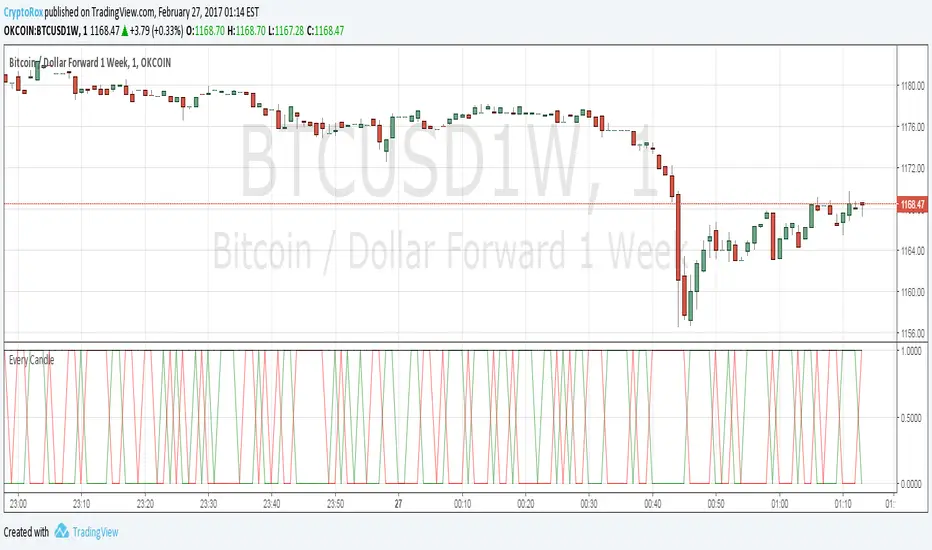
[Autoview] Every Candle Alert ScriptThis script is designed specifically for firing an alert every candle. It can also be used to just fire an alert on a green candle, or a red candle to slow it down a bit.
This is a script we use to close all of our orders or positions on any of the integrated exchanges.
You can use a fire once alert with greater than on condition and the alert will typically fire within seconds. You can also use this to place orders for you without having to navigate away from TradingView to your exchange/brokerage site.
If you would like a better understanding of how to create an alert for automation, please visit the article this strategy is being published for.
use.autoview.with.pink
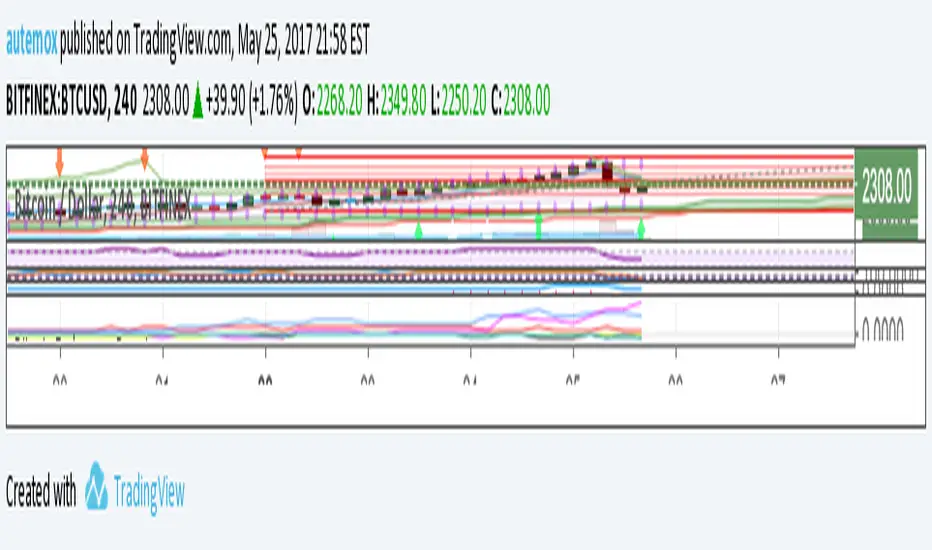
Tops/BottomsUsing Modified code from Lazybear's CVI 0.17% indicator and some logic, this script can help identify value buy and sell opportunities at a very early phase. Best used as a confirmation tool. This is a beta, so use it as such. Enjoy.
Sometimes "top" indications in an uptrend mean to look for an opportunity to add to position while "bottom" indications during a downtrend can represent the same thing. The trend is your friend, use it to your advantage!
Red star above bar == potential top
Green star below bar == potential bottom


Volume Weighted Market Mean [Dia]Calculate a volume weighted market mean price across various exchanges.
Indicator shows mean values of high, low and ohcl/4, weighted by corresponding volume.
- Optional: display of simple arithmetic mean of prices
- Optional: additional price lines for single exchanges.
- EMA smoothing of results

3BBands (3 Spirolinas)The script combines 3 single Bollinger bands into one script for easy plotting and range modification. It can be used for analyzing a market with multiple time frames and ranges using Fibonacci series as the range.

KK_Price Action Channel (TDI BH)Hey guys,
this little script is an addition to another one I will release right after this.
This is the Price Action Channel. The bands are calculated using a smoothed moving average of the highs/lows. I have taken the smoothed moving average script from the public library in order to create this, so all props to whoever created that one.
I am fairly new to creating scripts so use it with caution and let me know what you think!
EDIT: Here is the script I have written this one for:

Bitcoin Index vs. Futures OKCoin WeeklySimple adaptation to lastbattles script to add calculation for index price: calculation can be seen here: www.okcoin.com
I recommend setting it to columns, and setting price at 0, 0 to see divergence of sell/buy.


S3-ZMACDHere's a modified MACD which uses ZL calculation for the emas, phi adjustment to the fast signal and an optimized period set. It useful because it will give predictive signals for many setups.

Gold Timing Composite (EURUSD + DXY + US02Y)Here's the publication-ready description for TradingView:
Gold Timing Composite Indicator - 3-Component Model
Overview
A precision-engineered multi-component oscillator designed specifically for intraday gold trading. This indicator synthesizes three critical market drivers—EUR/USD dynamics, broad US Dollar strength, and Treasury yield movements—to isolate genuine gold price catalysts from market noise, delivering high-probability timing signals through triple-layer confirmation.
Components & Methodology
The indicator employs z-score normalization (default 20-period lookback) to harmonize three distinct but correlated market signals into a unified composite reading:
Fast Price Discovery Signal (40%):
EURUSD (40%) - EUR/USD captures rapid USD repricing with the deepest FX liquidity globally
Broad USD Strength Confirmation (35%):
-DXY (35%) - Inverted US Dollar Index measures comprehensive USD strength across six major currencies (EUR 57%, JPY 14%, GBP 12%, CAD 9%, SEK 4%, CHF 4%)
Real Yield Proxy (25%):
-US02Y (25%) - Inverted 2-Year Treasury yield captures Fed policy expectations and real rate dynamics
Key Features
✅ Dual USD Validation - EURUSD (speed) + DXY (breadth) filter EUR-specific moves from true USD weakness
✅ Real Yield Sensitivity - US02Y isolates rate-driven gold moves from pure currency effects
✅ Triple Confirmation System - Visual alignment dots when all three components agree simultaneously
✅ Mean-Reversion Zones - Overbought/oversold thresholds at ±1.5 standard deviations
✅ Clean Visualization - Candle-based display (no wicks) for rapid pattern recognition
✅ EUR/USD Divergence Detection - Identifies when EURUSD moves are EUR-specific vs broad USD moves
How to Use
Basic Signals:
Green candles = Bullish gold pressure (USD weakening / yields falling)
Red candles = Bearish gold pressure (USD strengthening / yields rising)
Above +1.5 = Overbought zone → look for mean-reversion shorts
Below -1.5 = Oversold zone → look for mean-reversion longs
High-Confidence Setups (Alignment Dots):
Lime dot at top = All 3 components bullish → maximum gold long confidence
Magenta dot at bottom = All 3 components bearish → maximum gold short confidence
No dots = Components diverging → reduce position size or wait for clarity
Divergence Trading:
Gold makes new high but composite doesn't confirm → potential reversal down
Gold makes new low but composite doesn't confirm → potential reversal up
Understanding Component Interactions
Normal Correlation (High Confidence):
EURUSD ↑ + DXY ↓ + US02Y ↓ → Broad USD weakness + falling yields → Strong gold bull signal
EURUSD ↓ + DXY ↑ + US02Y ↑ → Broad USD strength + rising yields → Strong gold bear signal
EURUSD/DXY Divergence (Critical Filter):
EURUSD ↑ but DXY flat/up → EUR-specific strength (ECB, Eurozone news) → Weak gold signal
DXY flat = USD not actually weak, just EUR strong → Gold may not follow EURUSD
EURUSD flat but DXY ↓ → Broad USD weakness (JPY, GBP, CAD all strong) → Strong gold signal
True USD weakness beyond just EUR → High-probability gold long
FX vs Yields Divergence:
EURUSD ↑ + DXY ↓ but US02Y ↑ → USD weak in FX but yields rising → Mixed signal
Hawkish Fed repricing vs currency weakness → Medium confidence, smaller size
EURUSD ↓ + DXY ↑ but US02Y ↓ → USD strong but yields falling → Conflicting drivers
Could be risk-off (safe haven bid to Treasuries) → Analyze broader market context
Best Practices
Timeframes: 5-minute to 15-minute charts for intraday trading
Session Focus: London fix (10:30 AM GMT) and New York open (8:20 AM EST) for peak gold liquidity
Pair With:
Key gold technical levels (round numbers, previous highs/lows)
COMEX gold futures volume profile
Real yield charts (when available)
VIX for risk sentiment context
Risk Management:
Full position: When alignment dots appear (all 3 components agree)
Half position: When 2 of 3 components align
Wait/reduce: When all three components diverge
Weight Adjustments:
Fed announcement days (FOMC, CPI, NFP): Increase US02Y to 35%, reduce EURUSD to 35%
ECB policy days: Monitor EURUSD/DXY divergence closely (EUR-specific moves may not affect gold)
Geopolitical events: DXY and yields may diverge (safe-haven flows) → Focus on DXY + yields, reduce EURUSD weight
Asian session: EURUSD less reliable (lower liquidity), consider increasing DXY weight to 45%
Technical Details
Calculation Method: Z-score normalization with configurable lookback period
Default Weights: EURUSD 40% | -DXY 35% | -US02Y 25%
Extreme Threshold: ±1.5 standard deviations (adjustable)
Alignment Trigger: All 3 components in unanimous agreement
Customizable Parameters:
Z-score lookback period (default: 20)
15-20: Faster, more sensitive (intraday focus)
30-50: Slower, smoother (swing trade context)
Individual component weights
Extreme threshold levels (1.3 for more signals, 1.8 for extremes only)
Alignment indicator toggle
Advantages Over Simple Indicators
Unlike single-instrument or DXY-only indicators, this composite:
Filters EUR-specific noise - When EURUSD moves but DXY doesn't confirm, gold often doesn't follow
Combines speed + breadth - EURUSD for fast entries, DXY for broad confirmation
Isolates real yield drivers - US02Y separates rate-driven moves from pure FX effects
Identifies regime shifts - When FX and yields diverge, signals changing market dynamics
Adaptable weighting - Adjust for different sessions, events, or market regimes
Real-World Signal Examples
Example 1: High-Confidence Long (All Aligned)
Fed dovish surprise → US02Y falls sharply
USD sells off → EURUSD rises + DXY falls
Composite surges, lime dot appears
Action: Full position gold long
Example 2: False Signal (EUR-Specific)
ECB hawkish statement → EURUSD rallies
But DXY unchanged (JPY, GBP, CAD not moving)
US02Y also unchanged
Composite rises but no alignment dot
Action: Small/no gold position (move is EUR-specific, not USD weakness)
Example 3: Mixed Signal (FX vs Yields)
Strong US jobs data → US02Y spikes (bearish gold)
But USD sells off in FX → EURUSD up + DXY down (bullish gold)
Composite shows divergence, no dots
Action: Wait for clarity or trade with tight stops
Example 4: Divergence Entry
Gold makes new intraday high
But composite fails to confirm (makes lower high)
Bearish divergence forms
Action: Short gold on next pullback
Suggested Complementary Analysis
Fundamental:
Fed vs ECB policy divergence and forward guidance
Real yield trends (10Y TIPS when available)
Inflation expectations (breakevens)
Central bank balance sheet changes
Geopolitical risk premium
Technical:
Gold futures COT (Commitment of Traders) positioning
COMEX gold open interest
Gold/Silver ratio
Mining stock performance (GDX, GDXJ)
Intermarket:
US equity market performance (risk-on/risk-off context)
Crude oil (inflation proxy)
Copper (growth expectations)
Bitcoin correlation (alternative store of value narrative)
Limitations & Considerations
When the Indicator Struggles:
Flash crashes or circuit breakers - Extreme events can break normal correlations temporarily
Asian session gaps - Lower EURUSD liquidity can cause false signals
Central bank interventions - SNB or BOJ FX intervention distorts DXY temporarily
Geopolitical shocks - Gold can decouple from USD/yields during wars, crises (safe-haven bid)
Quarter-end flows - Rebalancing can create temporary USD moves unrelated to fundamentals
Best Used When:
Normal market conditions (liquid sessions, no major shocks)
Clear trending or mean-reverting environment
Components showing consistent correlations
Combined with price action and volume confirmation
Performance Optimization Tips
Backtest your timeframe - Test 15-25 lookback periods to find optimal sensitivity
Session-specific weights - Use different weight profiles for London vs New York vs Asia
Combine with price action - Don't trade composites alone; wait for gold to confirm with candle patterns
Monitor component correlations - If EURUSD/DXY correlation breaks down, reduce both weights temporarily
Use with stop-loss discipline - Composite extremes suggest mean-reversion, but trends can extend
Disclaimer
This indicator is a technical analysis tool and does not guarantee profitable trades. Gold markets are influenced by numerous factors including geopolitics, central bank policy, inflation, and market sentiment that cannot be fully captured by any indicator. Always employ proper risk management, position sizing, and stop-losses. Backtest thoroughly before live implementation. Past performance is not indicative of future results.
Credits
Developed for intraday precious metals traders seeking multi-factor confirmation for gold timing decisions. Built on intermarket analysis principles combining currency dynamics, interest rate differentials, and statistical normalization for robust signal generation. Designed to filter EUR-specific noise and isolate true USD weakness—the primary driver of gold price movements.
Version: 1.0
Pine Script Version: 6
Asset Class: Precious Metals (Gold, Silver)
Category: Oscillators, Multi-Timeframe Analysis, Intermarket Analysis
Use Case: Intraday mean-reversion and momentum timing for gold (XAUUSD, GC futures)
Trading gold with this indicator? Share your results, questions, or improvement suggestions in the comments!

BTC Cycle Halving Thirds NicoThe bold black vertical lines are the INDEX:BTCUSD halvings.
The background speak for itself.
Time to be bearish?

BTC Fibonacci DMA350 TrendlinesAdapted from Tim Graham's Code.
See Original Inspiring Article from Phillip Swift at: @positivecrypto
When looking into BITSTAMP:BTCUSD 1D data in spreadsheet. Historically, BTC Highs Hit (Simple Daily Moving Average 350 Days) DMA350 in reverse Fibonacci Sequence Order
2013 Hit DMA350*8 before All Time High (ATH)
2017 Hit DMA350*5 before ATH
I expect 2021 to hit DMA350*3 ATH. When BTC hits DMA350*3 ATH, I suggest selling!

MA Multiplier with FibonacciThis implementation of the "2-Year MA Multiplier" gives you some control over the indicator, you can change the multiplier from it's default of 5, you can change the lookback from it's default of 730 days and I've also added three fibonacci traces between the moving average and it's multiple that you can play with. Oh and you can also choose the data source ('close' or 'hl2' make most sense).
The formula for this indicator was created by Philip Swift.
Thanks to @Pladizow for pointing me to this indicator.

MAFIA CANDLESMafia Candles is a Exhaustion bar count and candle count indicator, Using the Leledc Candles and 1-3 counting candle play gives you a pretty good idea where a so called "top" will be or a so called "bottom" will be!
In this example, getting the transparent round circles ( either lime or red ) would mean that the move will be a good size move!
EXAMPLE=1 You see a down trend and then the Mafia Candles Flashes a Green Dot on the forming new red candle. This is where in theory you might want to consider going long on the market!
EXAMPLE=2 If you see a RED $ symbol, after a uptrend, this means in theory, there might be room for a short play or room for a small pullback in the price!
THE CIRCLES(RED OR LIME COLORED) ARE INDICATING BIGGER MOVES!
THE $ SYMBOLS (RED OR LIME COLORED) ARE INDICATING SMALLER PULLBACKS OR SMALLER PUMPS IN PRICE!
RED IS CONSIDERED TO BE A SELL!
LIME COLOR IS CONSIDERED TO BE A BUY!
AS MUCH IS BASED OF THE 1-3 CANDLE COUNT AND THE LEDLEC CANDLE DEVIATION STRATEGY, LET ME EXPLAIN THE THEORY ON BOTH THE 1-3 CANDLE COUNT AND THE LELEDC STRATEGY I COMBINE TO BRING YOU THIS ADDITION OF THE INDICATOR....
LELEDC THEORY USAGE...
An Exhaustion Bar is a bar which signals
the exhaustion of the trend in the current direction. In other words an
exhaustion bar is “A bar of last seller” in case of a downtrend and “A bar of
last buyer”in case of an uptrend.
Having said that when a party cannot take the price further in their direction,naturally the other party comes in , takes charge and reverses the direction of the trend.
TO EASIER UNDERSTAND I GIVE YOU A EASY EXAMPLE OF WHAT AN LELEDC EXHAUSTION BAR IS...
1. A wide range bar ( a bar with
long body!!!).
2. A long wick at the bottom of
the bar and no or negligible wick at the top of the bar in case of “Bear exhaustion bar” and
a long wick at the top and no or
negligible wick at the bottom of the bar in case of
“Bull exhuation bar”!!!
3. Extreme volume and.....
4. Bar forming at a key support or resistance
area including a Round Number (RN) and Big Round Number ( BRN ).THE PSYCHOLOGY BEHIND THIS!!!
Now let's assume that we have a group
of people,say 100 people who decides to go for a casual running. After running for few KM's few of
them will say “I am exhausted. I cannot run further”. They will quit running.
After running further, another bunch of runners will say “I am exhausted. I can’t run
further” and they also will quit running.
This goes on and on and then there will be a stage where only few will be left in the running. Now a stage will come where the last person left in the running will say “I
am exhausted” and he stops running. That means no one is left now in the
running.This means all are exhausted in the running.
The same way an exhaustion bar works and if we can figure out that
exhaustion bar with all the tools available on hand, we will be in a big trade
for sure!!.The reason is an exhaustion bar is formed at exact tops and bottoms most of the times.In forex with wide variety of pairs available at the counter ,one can trade this technique to make lifetime gains.
NOW LET ME EXPLAIN THE 1-3 CANDLE CORRECTION COUNT THEORY WHICH IS USED TO GET THE SUM UP SIGNALS FROM THIS INDICATOR FROM ITS INPUT LEVELS!!!
1-3 CANDLES....
The 1-3 Candlestick pattern is basically like sequential, aka a candle counting system!
1-3 CANDLE COUNT means you count the number of bullish=green candles or the bearish=red candles!
3 BULL/GREEN CANDLES in a row, each closing its close higher than the previous one before it is the 1-3 candle top count idea!
lets say you get 3 red bear candles, each candle after the first closes its body below the previous red candle before it, then you see 3 red candles with each closing lower bodies lower than the previous candle, THATS A POSSIBLE SIGN OF BEARISH EXHAUSTION, AND YOU MIGHT HAVE SOME BULLS STEP IN TO TAKE THE PRICE UP AFTER THE IMMEDIATE DOWNFALL OF THOSE 3 RED CANDLES!!
PLEASE IF ANYONE HAS QUESTIONS OR NEEDS ANY FURTHER EXPLANATION, DONT HESISITATE TO MESSAGE ME! CHALRES KNIGHT IS THE ORIGINAL AUTHOR OF THE 1-3 CANDLE COUNT AND THE LELEDC EXHAUSTION BAR INDICATOR ON METE-TRADER! R.IP CHARLES F KNIGHT!!! WE LOVE YOU AND MISS YOU BROTHER!
CHARLES KNIGHT PASSED DOWN ALL OF HIS INDICATORS AND SCRIPTS IN ORIGINAL CODE TO MYSELF WHEN HE PASSED AWAY AND I WILL CONTINUE TO HONOR HIS MEMORY BY ENHANCING HIS ORIGINAL SOURCE CODED SCRIPTS TO ENHANCE THE LIFE FOR ALL TRADERS!
CHARLIE LOVED WHEN I WOULD PUT MY OWN SWING ON HIS INDICATORS! HE TAUGHT ME EVERYTHING I KNOW AND I KNOW ONE DAY I WILL SEE HIM AGAIN!
TRADE IN PARADISE CHARLIE!!!
THE BEST TRADER IN THE WORLD!!!
